The purpose of this research is to formulate alternative strategies to accelerate the achievement of a sustainable West Nusa Tenggara (NTB) Zero Waste Program at the Environmental and Forestry Agency Office. This study uses the SWOT-QSPM approach as the basis for making alternative strategies. SWOT analysis is carried out using the IFE (Internal Factor Evaluation) matrix which describes the company's strengths and weaknesses and the EFE (External Factor Evaluation) matrix which describes the company's opportunities and threats and the IE (Internal External) matrix which shows the company's current position. . The results of the Internal – External analysis show that the strategy improvement that has been carried out has not been based on the potential and opportunities it has. With QSPM Analysis, to accelerate the achievement of the Zero Waste Program is to carry out a partnership strategy.
Keywords
Zero Waste Policy
QSPM
Strategy
JEL Classification
Q58
Q53
R11
INTRODUCTION
Background
A report from the World Bank, in the Indonesian Marine Garbage Hotspot [1], notes that there are more than 150 million tons of plastic in the world's oceans. This number will increase by another 250 million if the trends of urbanization, production and consumption continue. A report from the World Economic Forum and the Ellen MacArthur Foundation predicts that by 2050 there will be “more plastic than fish (by weight). The report also mentions East Asia is the region with the fastest growing waste production in the world. Published research shows that among the 192 countries in the world analyzed, five are responsible for more than 50% of the total plastic waste in the oceans; China, Indonesia, Vietnam, Philippines and Thailand.
Mulasari [2] states that waste is an object or material that is no longer used by humans so that it is thrown away. The stigma associated with the community is that all existing waste is dirty, etc., so it must be burned or disposed of properly. According to WHO in Fadhillah, waste is something that is not used, not used, not liked or something that is discarded from human activities and does not happen by itself. In other words, everything that is a community activity always creates waste.
Wahdah [3] argues that not all waste can be decomposed again, because there are several types of waste that undergo degradation. Garbage is generally divided into three, namely; organic, inorganic and B3 waste. Organic/biodegradable waste is waste that comes from living things and can be degraded or decomposed. One example of organic waste is dry leaves [4]. Inorganic waste is non-decomposing waste such as plastic, paper, rubber, metal, building materials, etc. [5]. Meanwhile, B3 waste is the residue of a business and/or activity containing B3. Types of household B3 waste, even in small concentrations, still contain large amounts of hazardous materials [6].
Data from Katadata [7] states that in a year, Indonesia's plastic waste production reaches 3.22 million tons. The World Bank estimates it currently represents around 85,000 tonnes of waste daily in Indonesia, with an estimated increase of up to 150,000 tonnes generated per day by 2025; 8 an increase of 76% in just 10 years. One of the causes of Indonesia's accumulation of waste is suspected to be due to minimal governance. More than plastic waste only ends up buried in the Final Disposal Site (TPA). While the amount of waste that is recycled is only 8 percent. The rest is waste that is processed in an environmentally unfriendly way, such as being burned [7].
Figure 1: Waste Contributing Country Data
As one of the efforts, the Government of the Republic of Indonesia in the National Long-Term Plan for Urban Areas of the Government of the Republic of Indonesia, 2015-2045, has stated its determination to reduce plastic waste and marine debris by 70% by 2025. National Policies and Strategies for Household Waste Management and Garbage Similar to Household Waste (Jakstranas) compiled by the Coordinating Ministry for Economic Affairs (Kemenko-Ekonomi) also offers a goal of reducing and recycling waste by 30% by 2025. This shows the seriousness of the government in handling waste and the importance of waste management in a city or region. If waste management in a city is good, it will be able to create a good environment as well. On the other hand, if waste management is not carried out properly, it will cause various environmental and health problems, such as global warming [8].
Research conducted by Nizar [9] states that improper waste management will have a major impact on the environment. For this reason, it is necessary to carry out a good and integrated waste management. In urban or urban environments, several obstacles or challenges are often faced such as relatively low public awareness, especially those who sell in the market, the lack of waste collection infrastructure, and the limited number of socialization, counseling, etc. [10].
The Provincial Government of West Nusa Tenggara (NTB) is currently focusing on the circular economy as part of its flagship program: NTB Zero Waste. This program has a target of 70% waste management and 30% waste reduction by 2023. The design of this program is based on the state of the increasing waste production in NTB from day to day. Quoted from Kompasiana, Syamsudin, Secretary of the NTB Environment and Forestry Service (LHK), stated that the volume of waste in 10 regencies/cities of NTB reached 3,388 tons, while the volume of waste disposed of every day reached 76 tons. Kurniawati [11] in her research argues that although the NTB government has carried out various strategies, in reality this program is still not optimal, so alternative solutions to other problems are needed.
This study will focus on making alternative strategies using the QSPM Matrix in achieving NTB Zero Waste. The alternative strategy is expected to assist in formulating policies related to waste management in NTB, especially waste in the ocean (marine) and coastal communities in this case is Kuta Mandalika Beach. The objectives of this study are:
To identify external and internal factors that influence the waste management strategy
To formulate alternative waste management strategies
To determine priorities for developing waste management strategies
MATERIALS AND METHODS
This research is a descriptive study, which is intended to make careful measurements of existing phenomena without having to test hypotheses. The research technique was carried out by means of field surveys, focus group discussions (FGD) involving participants, open interviews, and literature studies related to the NTB Zero Waste Program. Quantitative Strategic Planning Matrix (QSPM) approach [12-13], as the basis for formulating an alternative strategy to accelerate the NTB Lestari program: Zero Waste. Quantitative Strategic Planning Matrix (QSPM) is objectively able to show which strategy is the best from various alternatives [14-15].
Stages of analysis with SWOT and QSPM are as follows [16-17]
Input Stage:
Determine EFEM (The External Factor Evaluation Matrix). At this stage the determination and evaluation of external factors is carried out. External environmental analysis aims to build a limited list of opportunities that are more profitable and include threats that must be avoided [18]
Determine IFEM (The Internal Factor Evaluation Matrix). At this stage the determination and evaluation of internal factors is carried out. According to David (2011), the IFE matrix is used to find out the strengths and weaknesses that are the object of research
Matching Stage
Define Internal External Matrix. At this stage, an analysis of the strengths, weaknesses, opportunities, and threats is carried out for alternative strategies. Internal External Matrix (IE) is important to position the company into a matrix consisting of nine cells. The IE matrix consists of two dimensions, namely the total score of the IFE matrix on the X axis and the EFE matrix on the Y axis. This matrix is grouped into three strategies (Table 1), namely Grow and Build in cells I, II or IV, Hold and Maintain
includes cells III, V, or VII, and Harvest and Divest includes cells VI, VIII, or IX.
Decision Stage
SWOT analysis describes various alternative strategies that come from a comprehensive study of internal and external environmental factors, which then produces 4 possible strategies, namely: [19-21]:
SO strategy, namely a strategy to use strengths by taking advantage of opportunities
WO strategy, namely a strategy to minimize weaknesses by taking advantage of opportunities
ST strategy, namely a strategy to use force in overcoming threats; WT strategy, which is a strategy to minimize weaknesses and avoid threat
QSPM analysis is used to evaluate the strategy objectively based on the main internal-external success factors that have been identified in the previous stage. Conceptually, QSPM determines the relative attractiveness of different strategies based on the extent to which alternative strategies will take advantage of strengths and opportunities, improve weaknesses, and avoid or reduce threats [17,22-26]. QSPM components are strategic alternatives, key factors, weights, attractiveness scores and total scores. The attractiveness score is defined as a numerical value indicating the relative attractiveness of each strategy in a set of alternative designed strategies. The range of attractiveness scores was 1 = not related, 2 = somewhat related, 3 = moderately related and 4 = strongly related. The Total Attractive Score (TAS) value is the multiplication of the Attractive score and the Weight value in the analysis of IFE (Internal Factor Evaluation) and EFE (External Factor Evaluation) [12]. According to Sumiash, et al, the main factor of QSPM comes from the IFE Matrix and EFE Matrix and alternative strategies from the SWOT Matrix Researchers must use good intuitive judgment to choose which strategy to analyze using QSPM analysis.
RESULTS AND DISCUSSION
The results of the analysis carried out by researchers based on the assessment of the weight, rating, and score of each external and internal environmental factor show the conditions as presented in the EFE and IFE tables, IE matrix, SWOT matrix, and QSPM which are described in succession below.
External–Internal Matrix (EI Matrix)
Based on the analysis carried out on external and internal factors summarized in the EFE and IFE matrices in advance, an EI Matrix can be compiled by bringing together the scores in the two matrices. Thus, in this EI matrix, the ratio of EFE: IFE = 3.3 and 2.965 falls in cells I and V. This means that the Department of Environment and Forestry as a waste manager needs to implement a penetration and development strategy. This strategy can be interpreted as strengthening the strength variables possessed and carrying out developments in related fields.
SWOT analysis
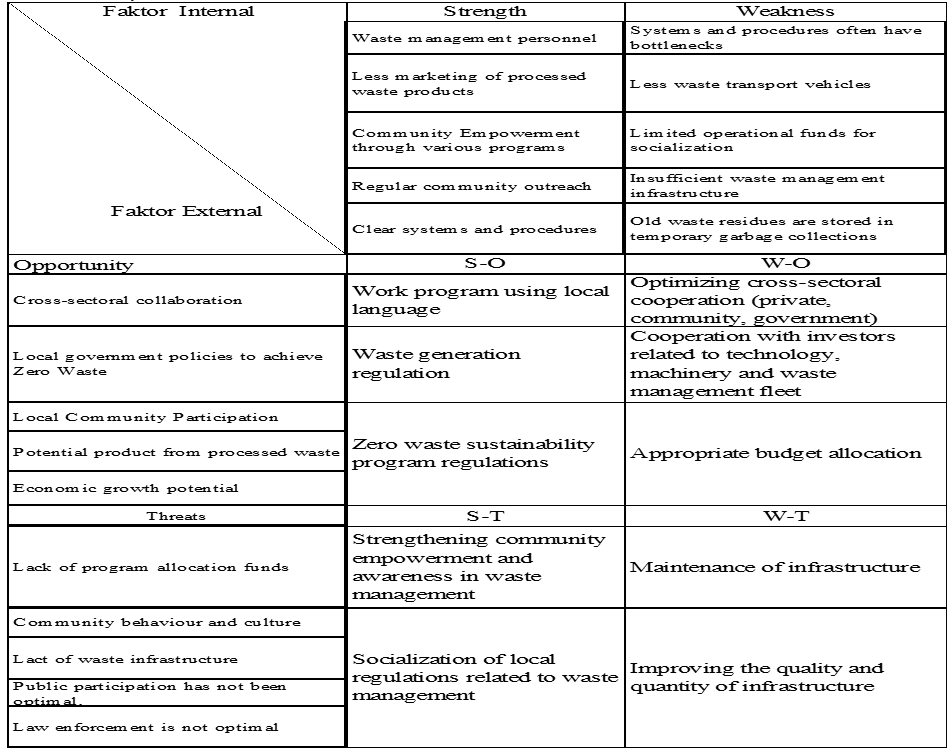
The results of the elaboration of the SWOT matrix can be explained by the following four strategies:
SO Strategy
Work program using local language
Waste generation regulations
Perda on the sustainability program of the NTB Zero Waste program
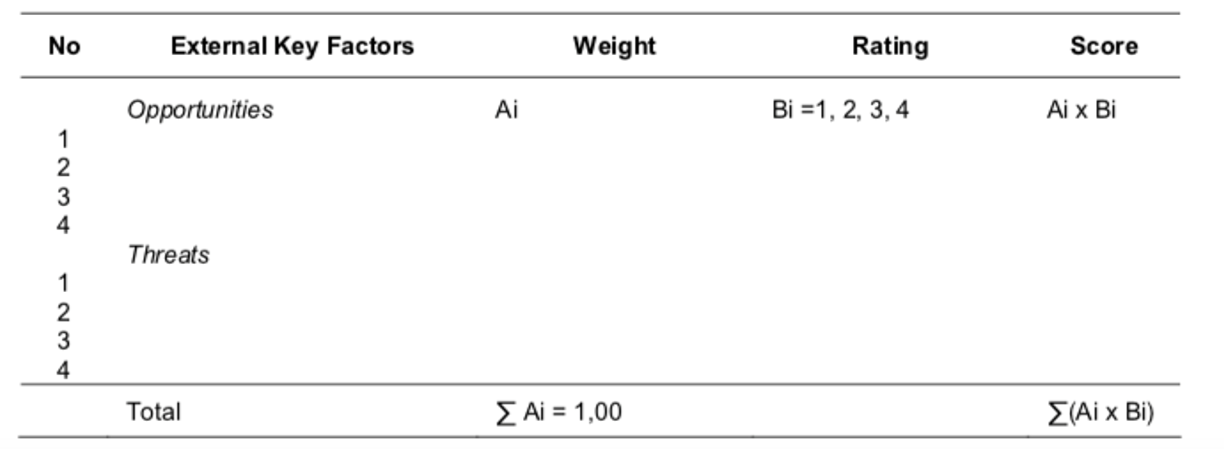
Table 5: External Factor Evaluation Matrix
Opportunity
Weight
Rating
Score
Cross-sectoral collaboration
0,1
4
0,4
Local government policies to achieve Zero Waste
0,1
4
0,4
Local Community Participation
0,1
4
0,4
Potential product from processed waste
0,07
3
0,21
Economic growth potential
0,08
3
0,24
Threats
-
-
-
Lack of program allocation funds
0,2
4
0,8
Community behaviour and culture
0,1
4
0,4
Lact of waste infrastructure
0,1
3
0,3
Public participation has not been optimal.
0,1
-
0
Law enforcement is not optimal
0,05
3
0,15
-
1
-
3,3
Table 6: Internal Factor Evaluation Matrix
Strength
Weight
Rating
Score
Waste management personnel
0,07
2,5
0,175
Less marketing of processed waste products
0,1
3
0,3
Community Empowerment through various programs
0,1
3
0,3
Regular community outreach
0,1
3
0,3
Clear systems and procedures
0,1
3
0,3
Weakness
-
-
-
Systems and procedures often have bottlenecks
0,1
2
0,2
Less waste transport vehicles
0,1
3
0,3
Limited operational funds for socialization
0,2
4
0,8
Insufficient waste management infrastructure
0,08
3
0,24
Old waste residues are stored in temporary garbage collections
0,05
1
0,05
-
1
2,965
Table 7: SWOT analysis
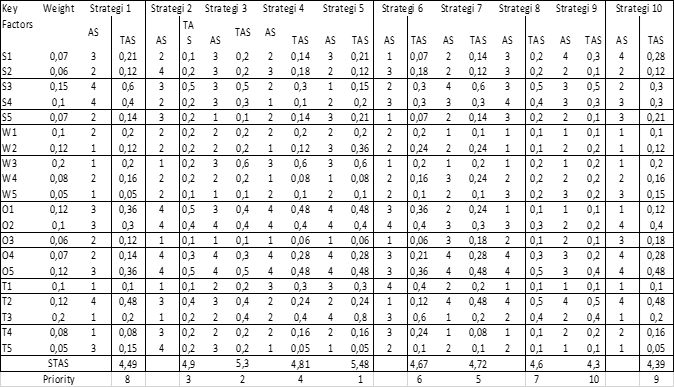
Table 8: Analysis of QSPM
Table 9: Strategic Priorities
No
QSPM (Priorities Strategi)
1
Cooperation with investors related to technology, machinery and waste management fleet
Strengthening and reviewing the forms of cooperation that have been carried out between the industry (private), community (society) and the government
5
Strengthening community empowerment and awareness in waste management
Shaping environmental care behavior in the community by approaching community leaders (religion, politics, environment)
Socialization by inviting the active participation of the community
Making people have a mindset of potential waste = money
W0 Strategi Strategy
Optimization of cross-sectoral cooperation (private, government and community)
Cooperation with investors related to technology, machinery and waste management fleet
Appropriate budget allocation
ST strategy
Strengthening community empowerment and awareness in waste management
Socialization of local regulations related to waste management
WT Strategy
Maintenance of infrastructure
Improving the quality and quantity of infrastructure
QSPM Analysis
The results of the weighting and assessment of the attractiveness score of internal and external strategic factors as the best alternative strategic decisions that must be immediately implemented in the QSPM analysis are as follows:
After conducting a series of analyzes with the previous approaches, conclusions can be drawn from this study, namely: 1. From the IE matrix analysis, the EFE score of 3.3 and IEF 2.965 fell in cells I and V (cell growth and look after). Thus, it can be concluded that the efforts to accelerate the Zero Waste Program currently being carried out by the BLHK Service are not in accordance with the existing potential and opportunities
Zero Waste Program in Kab. Central Lombok has not been successful because it has not been implemented optimally, especially in terms of operations and socialization to the community. Although community participation is quite good, it is hindered by the lack of funds for the implementation of work programs. It can be concluded from this research that strategic priorities are dominated by opportunity factors to solve problems of weakness (funds and lack of infrastructure) and threats (community culture, law enforcement) and to maximize strength factors (fitness of vision and mission and community empowerment)
Strategic decisions that can be immediately implemented according to the attractiveness score of each strategic factor, it turns out that the highest number is minimizing problems and taking advantage of opportunities. This means that a specific external strategy to be implemented immediately is a partnership, namely "cooperation with investors related to technology, machinery and waste management fleets"
REFERENCE
World Bank. Indonesian Marine Garbage Hotspot. Public Disclosure Authority, Jakarta, 2018.
Mulasari, A. et al. “Situation analysis of the yogyakarta city waste problem and its management policy.” Journal of Public Health, vol. 11, no. 2, 2016. doi:10.15294/kemas.vllil.3521.
Wahdah, N.F.R. et al. “Waste bank as a means of improving creative economy and environmental awareness.” Proceedings of the Community Service Conference, vol. 1, 2019, pp. 505–506.
Suciati, R. and H. Faruq. “The effectiveness of maggots hermetia illucens (black army flies) growth media as a solution for utilizing organic waste.” BIOSFER: Journal of Biology and Biology Education, vol. 1, no. 1, 2017, pp. 8–13.
Marliani, Novi. “Utilization of household waste (inorganic waste) as a form of implementation of environmental education.” Formative Journal, vol. 4, no. 2, 2014, pp. 124–132.
Putra, Terry Irwansyah. et al. “Identification of types and management of household hazardous and toxic waste: a case study of pasar tais village, Seluma District, Seluma Regency.” Journal of Natural Resources and Environmental Management Research, 2019.
Katadata. “Country polluters plastic garbage to oceans.” Databoks, September 2016, https://databoks.katadat a.co.id/datapublish/2016/09/07/negara-pencemar-trash-plastik-ke-sea.
Harjanti, Intan Muning. and Pramaningtyas Anggraini. “Green open space functions in kauman area, semarang city, Indonesia.” Journal of Architectural Design and Urbanism, vol. 3, no. 1, September 2020, pp. 1–9.
Nizar, M. et al. “Municipal waste management based on zero waste concept: literature study.” [Journal name missing], vol. 1, no. 2, 2017, pp. 93–102.
Rizal, M. “Analysis of urban solid waste management (case study in boya village, banawa district, donggala regency).” Journal of Electrical Engineering Mechanical Engineering (SMARTek), vol. 9, no. 2, 2011, pp. 155–172.
Kurniawati, Rika. “Ntb zero waste socialization through digital literacy.” JUPITER, vol. XVII, no. 1, June 2020.
David, M.E. et al. “The quantitative strategic planning matrix: a new marketing tool.” Journal of Strategic Marketing, vol. 25, no. 4, 2017, pp. 342–352.
Setiawan, Rudie. Business Strategy Formulation Using QSPM (Quantitative Strategic Planning Matrix) Method: Case Study at Hotel “X” in Bandung. Master’s Thesis, Business Management and Technology Administration, Bandung, 2005.
Mahfud, T. “Application of the qspm (quantitative strategic planning matrix) method case study: quality improvement strategies for graduates of the catering study program.” [Journal name missing], vol. 1, no. 1, 2017. ISSN 2580–5398.
Purwandari, S. “Analysis of quantitative strategic planning matrix (qspm) as the basis for determining marketing strategy at citra medika vocational school sukoharjo.” Journal of Sainstech Polytechnic Indonusa Surakarta, 2015. ISSN 2355–5009.
David, F.R. Strategic Management: Concepts and Cases. Prentice Hall, 2011.
Taslimi, M.S. and A.K. Omeyr. “Formulating a strategy through quantitative strategic planning matrix (qspm) based on the swot framework (case study: industrial group of barez tires).” International Journal of Economy, Management and Social Sciences, vol. 3, no. 8, 2014, pp. 451–457.
Suharno and Y. Sutarso. Marketing in Practice. Graha Ilmu, Yogyakarta, 2010.
Wang, X.P. et al. “Hybrid swot approach for strategic planning and formulation in china worldwide express mail service.” Journal of Applied Research and Technology, vol. 12, no. 2, 2014, pp. 230–238.
Martínez, C.I. and W.H.A. Piña. “Recycling in bogotá: a swot analysis of three associations to evaluate integrating the informal sector into solid waste management.” International Journal of Social, Behavioral, Educational, Economic and Management Engineering, vol. 9, no. 6, 2015, pp. 1668–1673.
Michailidis, A. et al. “Exploring treated wastewater issues related to agriculture in europe, employing a quantitative swot analysis.” Procedia Economics and Finance, vol. 33, 2015, pp. 367–375.
Valiollarabieifar et al. “Stability monitoring of the social structure of urban housing, using swot qspm technique.” Scholars Journal of Arts, Humanities and Social Sciences, vol. 2, 2014, pp. 362–371.
Ghosian, A. et al. “The quantitative strategic planning matrix (qspm) applied to sport in west azerbaijan province.” International Journal of Sport Studies, vol. 5, no. 1, 2015, pp. 124–128.
Wati, N. et al. “Development strategy of mangrove conservation and ecotourism BeejayBakau Resort.” IOSR Journal of Business and Management, vol. 18, no. 5, 2016, pp. 116–122.
Wahyuningsih, T. “the development strategy of main commodities of rice in Buru district, Maluku.” World Journal of Agricultural Research, vol. 4, no. 1, 2016, pp. 9–17.
Wijayanto, D. “fisheries development strategies of Biak numfor regency, Indonesia.” Aquatic Procedia, vol. 7, 2016, pp. 28–38.
Recommended Articles
Research Article
Developing Social Media Marketing Visual Contents to Increase Engagement Rate (A Case Study of Healthy Tails Animal Clinic in Malang City)
Aditya Nirwana,
...
Felicia Joscelind Verrel
Published: 20/11/2022
Download PDF
Research Article
Longitudinal Research into the History of Debts
Kathleen Okafor
Published: 20/03/2022
Download PDF
Research Article
Responsibility Accounting in Food Enterprises – A Case Study at Kinh do Holdings Company Limited
Thi Ngoc Lan,
...
Ta Thi Thuy Hang
Published: 08/07/2023
Download PDF
Research Article
The Determinants of the Financial Behaviour of SMEs: Empirical Evidence from an Emerging Economy
Santiago Hernandez,
...
Remo Roscigno
Published: 20/03/2022
Download PDF
PO Box 101, Nakuru
Kenya.
Email: office@iarconsortium.org
Editorial Office:
J.L Bhavan, Near Radison Blu Hotel,
Jalukbari, Guwahati-India
None, Z., Sari, P. R. K., Oktapianti, S., Permatacita, F. & Nurjihadi, M. (2021). Sustainable Zero Waste Policy Strategy: Qspm Analysis. IAR Journal of Business Management, 2(2), 1-6.
MLA
None, Zulkieflimansyah, et al. "Sustainable Zero Waste Policy Strategy: Qspm Analysis." IAR Journal of Business Management 2.2 (2021): 1-6.
Chicago
None, Zulkieflimansyah, Putri R. K. Sari, Serly Oktapianti, Fitriah Permatacita and Muhammad Nurjihadi. "Sustainable Zero Waste Policy Strategy: Qspm Analysis." IAR Journal of Business Management 2, no. 2 (2021): 1-6.
Harvard
None, Z., Sari, P. R. K., Oktapianti, S., Permatacita, F. and Nurjihadi, M. (2021) 'Sustainable Zero Waste Policy Strategy: Qspm Analysis' IAR Journal of Business Management 2(2), pp. 1-6.
Vancouver
Zulkieflimansyah Z, Sari PRK, Oktapianti S, Permatacita F, Nurjihadi M. Sustainable Zero Waste Policy Strategy: Qspm Analysis. IAR Journal of Business Management. 2021 Jul;2(2):1-6.


 Download PDF
 Download XML