Coronavirus has been recognized in October, 2019, but the first infection with the virus in Iraq was identified in the province of Najaf, about 160 km south of Baghdad, on February 24, 2020 and aim of the research Knowing the extent of coronavirus effect on liver function, especially liver enzymes, which play a vital role in the vital processes in the human body 60 samples were collected at Al-Furat General Hospital from patients with COVID-19, of which 38 samples were for men, and 22 samples were for women; the blood was separated to extract serum by the centrifuge, then the results were obtained by an Automatic Biochemistry Analyzer device with Accent-200 and (GPT, ALP, TSB, GOT enzymes) were identified for comparisons between control and patients Through taking a section, analyses were performed for 60 patients, average age was 46, and ages were between 23-75 years. The values of the statistical analyses were clarified when compared to healthy people: the nature of the relationship where it was shown that there is a negative relationship in the amounts of GOT, GPT, ALP Proven by sig, which is higher than 0.05 and research shows that Coronavirus has actual effects on liver function, and the majority of patients have high GOT, GPT ALP due to a clear impact of COVID-19 on the liver enzymes.
Quality of Coronavirus was recognized in 2019, and the first case was discovered in China in the Wuhan region. When reading the direct impact of these viruses, a significant impact on the work of the liver was found [1]. The occurrence of functional difference and not only this but there was an effect on the clinical characteristics of patients with COVID -19 [2]. This clinical effect was not recognized to this day, and dealing with it has become something vague and not clear-cut and through multiple studies [3] and then proving that liver disease is present in abundance in people with the disease. If we examine it further, we'll find that SARS-Cov2 is similar in the genetic chain to SARS-Cov. Studies related to this subject published in 2004 show that 60% of people with the disease face a risk of liver damage [4].The symptoms of COVID19 were not limited only to the liver, but the effects included all parts of the body COVID-19 patients, including the lungs, heart, and kidneys [5]. So that it can damage the intestine and formation Infections in the heart, and this was evidenced by analyzing the urine [6]. This indicates that there was an early presence of kidney damage. Liger said that initial data also shows that 14 to 30% of ICU patients lose kidney function and need dialysis or continuous treatment [7]. The disease can also harm the heart, as doctors in China and New York reported inflammation Heart muscle and arrhythmias, which can lead to cardiac arrest in patients with COVID-19 .Its effect extends to the digestive system, causing disruption in liver function and an increase in its enzymes. It also poses a high risk to liver patients to join the list of groups most vulnerable to severe complications from the virus [3]. As for cirrhosis, which occurs, or its impact on people who already or previously have liver diseases, including functional disorders caused by the disease [8].
Clear evidence of attacking it directly on the part, or it may consist of these functional disorders or infections in the liver as a result of the use of medications such as antagonists Vitality and increase the risk to people who already have a chronic disease or have liver damage in this way will lead to complications depending on the type of patient the liver and as for people who suffer from a fatty liver disease where most patients suffer from heart disease and blood pressure which makes them more vulnerable to health problems when infection with the virus [9]. The symptoms of Coronavirus contribute to high levels of the liver and that 35% of patients have had a rise in the levels of liver enzymes and found the effect of coronavirus on the liver as form where the patient who suffers from high levels of enzymes and increased activity in a virus B will be attacked by Coronavirus. In this situation, it is violent for the patient due to significant weakening of the immune system [10]. As for the patients who have liver transplantation, they do not suffer from any of the many problems when infected with the virus as a result of using anti-immunosuppressive drugs [11].
Clinical in Vitro Diagnostic Reagent kit
GPT For in vitro diagnostics use R1: 1x30mL R2: 1x8ML
GOT For in vitro diagnostics use R1: 1x30mL R2: 1x8ML
ALP For in vitro diagnostics use R1: 1x30mL R2: 1x8ML
TSB For in vitro diagnostics use R1: 1x24mL R2: 1x5ML
TSB: 10 μl serum
ALP: 4 μl serum GPT = 15 μl serum GOT = 10 μl serum
Separation
The device separates the blood components to obtain serum and shown in figure 3 device centrifuge
In these tables that are performed in the results between patients with high levels in some liver enzymes (GPT, TSB, GOT, ALP) and the control group of COVID-19 we notice that the percentage increases by 33% in patients with COVID-19 and the highest rate achieved by 108 if compare enzymes in elevated liver levels [12].
The results also showed that a 5% rate indicates a severe reduction in enzyme levels for patients with COVID-19 patients [13]. In general, we note that In the case of the COVID-19, enzyme levels increase by 15% to 45%, and liver infections are significantly more common among patients [14].

Figure 1: Automatic Biochemistry Analyzer / For Clinical Diagnostic / Benchtop Accent-2000

Figure 2: Syringe, pipette and Gel Tube
Table 1: Shown Results of Patients COVID-19
| P | Age | Gander | Tsb (1.70-21) Μmol/L | Gpt (5- 41) U/L | Got (8-40)U/L | Alp (56-119)U/L |
| p1 | 64 | M | 9.23 | 26 | 43 | 147 |
| p2 | 62 | F | 14.29 | 26 | 37 | 87 |
| p3 | 48 | M | 12.7 | 48 | 68 | 45 |
| p4 | 46 | M | 12 | 41 | 48 | 65 |
| p5 | 31 | M | 10.61 | 70 | 33 | 80 |
| p6 | 30 | M | 13.5 | 59 | 38 | 60 |
| p7 | 42 | M | 12 | 40 | 27 | 66 |
| p8 | 47 | M | 8 | 35 | 30 | 123 |
| p9 | 44 | M | 12 | 42 | 30 | 48 |
| p10 | 31 | F | 9.82 | 27 | 28 | 60 |
| p11 | 35 | M | 12 | 29 | 34 | 37 |
| p12 | 34 | M | 10 | 33 | 28 | 86 |
| p13 | 35 | M | 8 | 49 | 32 | 73 |
| p14 | 25 | F | 11.27 | 12 | 17 | 49 |
| p15 | 53 | F | 6.13 | 26 | 35 | 73 |
| p16 | 25 | M | 14.81 | 0 | 21 | 48 |
| p17 | 48 | F | 7.64 | 22 | 38 | 141 |
| p18 | 23 | M | 6.11 | 32 | 20 | 87 |
| p19 | 70 | M | 14.07 | 66 | 34 | 128 |
| p20 | 48 | M | 12 | 96 | 68 | 58 |
| p21 | 60 | M | 14.1 | 65 | 56 | 75 |
| p22 | 75 | M | 6.61 | 19 | 50 | 99 |
| p23 | 42 | F | 14.3 | 55 | 45 | 56 |
| p24 | 36 | F | 6.18 | 9 | 20 | 47 |
| p25 | 52 | M | 6.67 | 17 | 21 | 44 |
| p26 | 60 | M | 9.71 | 35 | 38 | 70 |
| p27 | 75 | F | 23 | 36 | 27 | 59 |
| p28 | 51 | M | 12 | 30 | 27 | 66 |
| p29 | 35 | M | 10 | 108 | 7.9 | 45 |
| p30 | 31 | M | 10 | 33 | 37 | 106 |
| p31 | 38 | M | 8.6 | 33 | 30 | 80 |
| p32 | 18 | F | 6 | 10 | 16 | 44 |
| p33 | 35 | M | 14 | 66 | 37 | 70 |
| p34 | 33 | M | 12 | 47 | 27 | 66 |
| p35 | 19 | F | 7.74 | 15 | 24 | 55 |
| p36 | 30 | F | 8.26 | 16 | 31 | 244 |
| p37 | 40 | M | 11.2 | 10 | 39 | 246 |
| p38 | 29 | M | 13.8 | 18 | 22 | 71 |
| p39 | 30 | M | 6.22 | 53 | 35 | 88 |
| p40 | 40 | M | 12 | 13 | 21 | 88 |
| p41 | 25 | M | 19.5 | 29 | 29 | 52 |
| p42 | 40 | M | 12.3 | 60 | 31 | 75 |
| p43 | 50 | M | 34.8 | 15 | 24 | 86 |
| p44 | 44 | M | 13.9 | 36 | 24 | 64 |
| p45 | 27 | M | 27 | 35 | 25 | 56 |
| p46 | 35 | F | 12.5 | 21 | 22 | 76 |
| p47 | 50 | F | 17.6 | 13 | 22 | 72 |
| p48 | 30 | F | 9.4 | 9 | 22 | 70 |
| p49 | 16 | F | 4.6 | 11 | 20 | 114 |
| p50 | 54 | M | 12 | 67 | 47 | 113 |
| p51 | 29 | M | 15.3 | 41 | 35 | 57 |
| p52 | 25 | M | 10 | 14 | 26 | 67 |
| p53 | 45 | F | 7.6 | 29 | 35 | 124 |
| p54 | 39 | F | 12.9 | 11 | 28 | 58 |
| p55 | 49 | F | 11.3 | 10 | 20 | 111 |
| p56 | 33 | F | 9 | 19 | 23 | 65 |
| p57 | 29 | F | 6.1 | 13 | 21 | 111 |
| p58 | 50 | F | 22 | 18 | 38 | 61 |
| p59 | 70 | F | 19.5 | 48 | 57 | 49 |
| p60 | 34 | M | 10 | 35 | 41 | 74 |
Table 2: Results of Healthy People
| p | AGE | TSB (1.70-21) μmol/L | GPT (5-41) U/L | GOT (8-40)U/L | ALP (56-119) U/L |
| p1 | 40 | 7.3 | 28 | 11.1 | 73 |
| p2 | 55 | 10.6 | 25.2 | 9.9 | 70 |
| p3 | 70 | 7.9 | 40.2 | 14.7 | 88 |
| p4 | 66 | 12 | 33 | 11.6 | 90 |
| p5 | 67 | 15 | 37 | 21.5 | 59 |
| p6 | 66 | 20 | 48 | 40 | 110 |
Table 2: Continue
| p7 | 45 | 12 | 33.3 | 31.4 | 118 |
| p8 | 54 | 14 | 41.3 | 20.1 | 60 |
| p9 | 77 | 11.7 | 33 | 16.4 | 67 |
| p10 | 83 | 10 | 32 | 18 | 64 |
| p11 | 44 | 12.1 | 19 | 22 | 77 |
| p12 | 23 | 8.5 | 34 | 27.5 | 87.4 |
| p13 | 13 | 18.9 | 27.9 | 22 | 66.9 |
| p14 | 28 | 17.3 | 29 | 31 | 59.9 |
| p15 | 32 | 11 | 19 | 11 | 60.4 |
| p16 | 68 | 9 | 9.8 | 16 | 67 |
| p17 | 45 | 14 | 34.2 | 22.6 | 80 |
| p18 | 44 | 6.7 | 23 | 9.9 | 88.7 |
| p19 | 43 | 10 | 12 | 22.9 | 73.4 |
| p20 | 40 | 11 | 21.5 | 33 | 70.7 |

Figure 3: Device Centrifuge

Figure 4: Shown the Rate the Rate of Decline and Rise of GOT in Patients CO-19

Figure 5: Shown the Rate the Rate of Decline and Rise of TSB in Patients CO-19

Figure 6: shown the Rate the Rate of Decline and Rise of GPT in Patients CO-19S

Figure 7: Shown the Rate the Rate of Decline and Rise of GOT in Patients CO-19

Figure 8: Shown the Rate the Rate of Decline and Rise of GOT in Patients CO-19

Figure 9: Shows the Rate of Decline and Rise of TSB in Patients CO-19

Figure 10: Shown the Rate the Rate of Decline and Rise of GPT in Patients CO-19

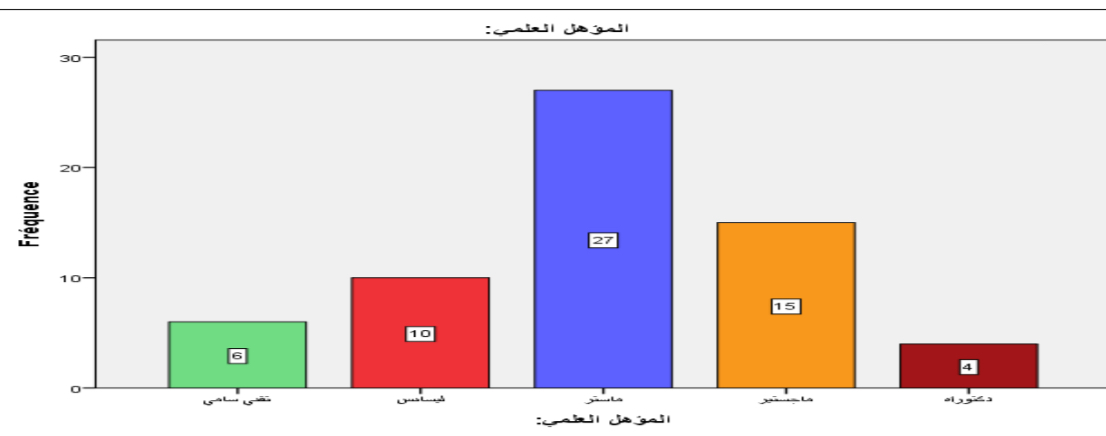
Figure 11: Frequency Distribution of Liver Function Test Parameters in COVID-19 Patients
Table 3: Correlations between Control and COVID-19 Patients in GOT
| Correlations | ||||
GOT Healthy | GOT Co19 | |||
Spearman's rho | GOT healthy | Correlation | 1 | -0.216 |
| Sig. (2-tailed) | 0.406 | |||
| 20 | 20 | |||
| GOT CO-19 | Correlation | -.216 | 1 | |
| Sig. (2-tailed) | 0.406 | |||
| N | 20 | 60 | ||
Table 4: Correlations between Control and COVID-19 Patients in GPT Enzymes
| Correlations | |||
GPT healthy | GPT CO-19 | ||
| GPT healthy | Spearman's rhoCorrelation | 1 | 0.184 |
| Sig. (2-tailed) | 0.436 | ||
| N | 20 | 20 | |
| GPT CO-19 | Spearman's rhoCorrelation | 0.184 | 1 |
| Sig. (2-tailed) | 0.436 | ||
| N | 20 | 60 | |
Table 5: Correlations between Control and COVID-19 Patients in ALP Enzymes
| Correlations | |||
| ALP healthy | ALP CO-19 | ||
| ALP healthy | Spearman's rho Correlation | 1 | -0.096 |
| Sig. (2-tailed) | 0.689 | ||
| N | 20 | 20 | |
| ALP CO-19 | Spearman's rho Correlation | -.096 | 1 |
| Sig. (2-tailed) | 0.689 | ||
| N | 20 | 60 | |
Correlation is significant at the 0.05 level (2-tailed)
In this research, values were found through TSB, GPT, GOT, ALP analyzes and evaluation of the necessary analysis to the affected person COVID-19 Patients, After that, healthy people were compared, where clinical results were demonstrated by the presence of symptoms appearing on the patient in the beginning [15-16].
As the current results showed that there are significant differences between persons infected with COVID 19 Patients and healthy people and that there is no direct effect to the following analyzes GPT, GOT, ALP, and TSB on the person's age according to what was shown to us in the outcome. Still, it is difficult to neglect this effect [16]. Relationship It is non-existent, but it is present, and its existence cannot be denied by TSB analysis. Most of the results were normal, and this is what corresponds to it in healthy people, but a percentage was found that represented one value for a person aged 50 years, and the rate was (31.8) [17-18].
Correlation for GOT between COVID - 19 Patients and Healthy People
Testing the relationship between GOT between COVID 19 Patients with healthy people noted the Correlation Coefficient is negative and this shows an inverse relationship between GOT between COVID19 Patients with healthy people and that the significance or (p-value) Sig. (2-tailed) was equal to0.406 and when compared to the level of significance (0.05) we notice that it is smaller than the level of significance and this means that no relationship.
Correlation for GPT between COVID - 19 Patients and Healthy People
Through statistical analysis Test the relationship between GPT healthy people with GPT CO-19 Note this Correlation coefficient is negative and this shows an inverse relationship between Test for the importance of (p-value) (Two-way) It was equal to 0.436 and when compared to the importance level (0.05) We note that it is greater than the level of significance and this means that there is not relationship between GPT healthy people with GPT CO-19 patients(Table 1-2).
Correlation for ALP between CO- 19and Healthy People
Statistical analysis demonstrated an inverse relationship between ALP between CO- 19and healthy People by taking 60 samples from patients and 20 from healthy, and the statistical indication of the quality of this relationship showed that it was (p- value) 0.689, i.e. it is greater than 0.05 We note that it is greater than the level of significance and this means that there is not relationship between ALP healthy people with ALP CO-19 patients ( Table 3-5).
The relationship between GOT, GPT, and ALP analysis was found between infected and healthy people As for TSB, the significant difference between the two groups was not [19] (Figure1-8).
The effects of GOT on infected people caused major damage to the liver and were among the main factors leading to liver damage about with COVID- 19 Patients [20-21].
According to the results that proved that age was not one of the main factors, but rather a contributing factor to the increase in poor health for the patient if he suffers from other diseases [19,22] (Figure 9-12).
If a person who suffers from COVID-19 is healthy from other diseases and contains immunity here, age does not become a contributing factor [23-24].
Hui, D.S. et al. “The Continuing 2019-nCoV Epidemic Threat of Novel Coronaviruses to Global Health—The Latest 2019 Novel Coronavirus Outbreak in Wuhan, China.” International Journal of Infectious Diseases, vol. 91, 2020, pp. 264–266.
Gorbalenya, A.E. et al. “Severe Acute Respiratory Syndrome-Related Coronavirus: The Species and Its Viruses–A Statement of the Coronavirus Study Group.” 2020.
Chen, N. et al. “Epidemiological and Clinical Characteristics of 99 Cases of 2019 Novel Coronavirus Pneumonia in Wuhan, China: A Descriptive Study.” The Lancet, vol. 395, no. 10223, 2020, pp. 507–513.
Hughes, J.M. et al. “Transmission of Human Infection with Nipah Virus.” Clinical Infectious Diseases, vol. 49, no. 11, 2009, pp. 1743–1748.
Wichmann, D. et al. “Autopsy Findings and Venous Thromboembolism in Patients with COVID-19: A Prospective Cohort Study.” Annals of Internal Medicine, vol. 173, no. 4, 2020, pp. 268–277.
Tang, N. et al. “Abnormal Coagulation Parameters Are Associated with Poor Prognosis in Patients with Novel Coronavirus Pneumonia.” Journal of Thrombosis and Haemostasis, vol. 18, no. 4, 2020, pp. 844–847.
Chen, G. et al. “Clinical and Immunological Features of Severe and Moderate Coronavirus Disease 2019.” The Journal of Clinical Investigation, vol. 130, no. 5, 2020, pp. 2620–2629.
Diao, B. et al. “Reduction and Functional Exhaustion of T Cells in Patients with Coronavirus Disease 2019 (COVID-19).” Frontiers in Immunology, vol. 11, 2020, p. 827.
Ianiro, G. et al. “Screening of Faecal Microbiota Transplant Donors during the COVID-19 Outbreak: Suggestions for Urgent Updates from an International Expert Panel.” The Lancet Gastroenterology & Hepatology, vol. 5, no. 5, 2020, pp. 430–432.
Bermingham, A. et al. “Severe Respiratory Illness Caused by a Novel Coronavirus, in a Patient Transferred to the United Kingdom from the Middle East, September 2012.” Eurosurveillance, vol. 17, no. 40, 2012, p. 20290.
Geller, C. et al. “Human Coronaviruses: Insights into Environmental Resistance and Its Influence on the Development of New Antiseptic Strategies.” Viruses, vol. 4, no. 11, 2012, pp. 3044–3068.
Calderwood, A.H. et al. “ASGE Guideline for Infection Control during GI Endoscopy.” Gastrointestinal Endoscopy, vol. 87, no. 5, 2018, pp. 1167–1179.
Hamming, I. et al. “Tissue Distribution of ACE2 Protein, the Functional Receptor for SARS Coronavirus: A First Step in Understanding SARS Pathogenesis.” The Journal of Pathology, vol. 203, no. 2, 2004, pp. 631–637.
Xiao, F. et al. “Evidence for Gastrointestinal Infection of SARS-CoV-2.” Gastroenterology, vol. 158, no. 6, 2020, pp. 1831–1833.
Chau, T.N. et al. “SARS-Associated Viral Hepatitis Caused by a Novel Coronavirus: Report of Three Cases.” Hepatology, vol. 39, no. 2, 2004, pp. 302–310.
Su, L. et al. “The Different Clinical Characteristics of Coronavirus Disease Cases between Children and Their Families in China–The Character of Children with COVID-19.” Emerging Microbes & Infections, vol. 9, no. 1, 2020, pp. 707–713.
Huang, C. et al. “Clinical Features of Patients Infected with 2019 Novel Coronavirus in Wuhan, China.” The Lancet, vol. 395, no. 10223, 2020, pp. 497–506.
Riley, S. et al. “Transmission Dynamics of the Etiological Agent of SARS in Hong Kong: Impact of Public Health Interventions.” Science, vol. 300, no. 5627, 2003, pp. 1961–1966.
Zhang, C. et al. “Liver Injury in COVID-19: Management and Challenges.” The Lancet Gastroenterology & Hepatology, vol. 5, no. 5, 2020, pp. 428–430.
Yi, Y. et al. “COVID-19: What Has Been Learned and to Be Learned about the Novel Coronavirus Disease.” International Journal of Biological Sciences, vol. 16, no. 10, 2020, p. 1753.
van Deursen, V.M. et al. “Co-Morbidities in Heart Failure.” Heart Failure Reviews, vol. 19, no. 2, 2014, pp. 163–172.
Cowling, B.J. and G.M. Leung. “Epidemiological Research Priorities for Public Health Control of the Ongoing Global Novel Coronavirus (2019-nCoV) Outbreak.” Eurosurveillance, vol. 25, no. 6, 2020, p. 2000110.
Mehta, P. et al. “COVID-19: Consider Cytokine Storm Syndromes and Immunosuppression.” Lancet, vol. 395, no. 10229, 2020, p. 1033.
Monteleone, G. et al. “Preventing COVID-19-Induced Pneumonia with Anticytokine Therapy.” The Lancet Rheumatology, vol. 2, no. 5, 2020, pp. e255–e256.