Contents
Download PDF
pdf Download XML
514 Views
327 Downloads
Share this article
Research Article | Volume 2 Issue 1 (Jan-June, 2021) | Pages 1 - 6
Hydrogeochemical Characteristics, Relationship between Chemical components and the depth and Assessment of Drinking Water Quality in Aljamil region, Libya
 ,
1
Faculty of science - Regdalin, Sabratha University, Libya
2
Faculty of education - Zuwara , Alzawia University, Libya
Under a Creative Commons license
Open Access
Received
Feb. 3, 2021
Revised
March 9, 2021
Accepted
April 19, 2021
Published
May 10, 2021
Abstract

Background: Groundwater is one of the most valuable natural resources, playing a fundamental role in human health and wellness, socio-economic development, and ecosystem functioning. Moreover, it is widely used for various domestic, industrial, and irrigation activities. Methods: Assessment of Chemical components in ground water used for drinking  and house purposes in Aljamil region were carried out. Samples were collected from 20 wells supplying drinking and irrigation water to the inhabitants in the region. All samples were analyzed for 20 parameters. Results: (PH), TDS ,Conductivity ,Salinity % ,SO4 -- ,Cl- ,T.H (CaCO3) ,Ca. as CaCO3 ,Mg. CaCO3, Alkalinity, HCO3-, NO2-, NO-3,NH4+ ,Ca ++ ,Mg++ ,PO4++ ,T, Na+ , K+ , Fe-  recording ( 7.225 ,2699.815, 4284.4, 8.47, 516.26, 674.92, 1998.39, 926.10, 1116.86, 178.8, 0.54, 315, 2.8154, 0.151, 369.543, 255.528, 0.9395, 23.385, 722.205, 15.045 and ,0.044) respectively. Moreover except PH, K+, HCO-3, NO-3and, Fe-which  recorded an  acceptable Pi (Pollution index) with Pi values (0.995 , 0.501, 0.593 , 0.0502 and 0.0293)  all parameters recorded (Pi) values more than the standard value (1) compared with the standard quality reference of (WHO). On the other hand, The major ions recorded are T.H (CaCO3), CaCO3 , Ca. as CaCO3, Na+ ,Cl- , SO4 -- ,Ca ++ , Mg++ ,HCO-3 , T(sodium ion) ,K+ , NO-3 are T.H (CaCO3), Mg , CaCO3 , Ca. as CaCO3, Na+ ,Cl- , SO4 -- ,Ca ++ , Mg++ , HCO3 , T(sodium ion) ,K+ , NO-3. Table 1 Conclusion:  The groundwater of the studied area presented a slight tendency to alkalinity and the majority of the studied parameters recorded an unacceptable Pi values.

Keywords
INTRODUCTION

Water from beneath the ground has been exploited for domestic use, livestock and irrigation since the earliest times. Although the precise nature of its occurrence was not necessarily understood, successful methods of bringing the water to the surface have been developed and groundwater use has grown consistently ever since. It is, however, common for the dominant role of groundwater in the freshwater part of the hydrological cycle to be overlooked. Groundwater is easily the most important component and constitutes about two thirds of the freshwater resources of the world and, if the polar ice caps and glaciers are not considered, groundwater accounts for nearly all usable freshwater [1]. In recent decades, groundwater pollution has become one of the most severe problems in the world, as water can be affected from natural sources or from numerous types of human activities, which can result in poor drinking water quality, water supply losses, high cleaning costs and potential health problems [2].


For arid and semiarid regions, groundwater resources are especially important in terms of quantity and quality. Under these climatic conditions, groundwater overconsumption has led to decreased quality or contamination that may impose hazards to society [3].

Water is one of the most vital resources for the sustenance of human, plants and other living beings. It is required in all aspects of life and health for producing food, agricultural activity and energy generation. Groundwater is rarely treated and presumed to be naturally protected, it is considered to be free from impurities, which are associated with surface water, because it comes from deeper parts of the earth [4] . The World Health Organization (WHO) has discriminated the major factor influencing the greater population is/as lack of access to clean drinking water [5]. Poor quality of water adversely affects the human health, and plant growth [6-7]. The quality of water is vital owing to its suitabilityfor various purposes since it is directly linked with human welfare. Groundwater quality variation is a function of physical and chemical patterns in an area influenced by geological and anthropogenic activities [8].


The total quantity of water on earth is approximately14 trillion cubic meters .Trace elements are the important part of the material basis of medical effects. Heavymetals are among the most persistent pollutants in the aquatic ecosystem because of their resistance to decomposition in natural conditions [9]. It has long been recognized that large area of the globe contains human population characterized by having trace elements deficiency, or excess including chronicpoising. Sediments and suspended particles are also important repositories for trace metals, e.g Cr, Cu, Mo, Ni, Co and Mn. 


Groundwater condition in an aquifer depends on amount, duration, intensity of precipitation, depth of weathering, specific yield and general slope of formation toward drainage channels. Groundwater occurs in the weathered presidium under unconfined conditions as well as in the fractured rocks under semi confined conditions. The thickness of weathered layer irrespective of rock type ranges from 2.2 m to 50 m [10].


In recent times, there has been an increasing health related concern associated with the quality of drinking water in developing countries. According to a recent report by WHO/UNICEF, about 780 million people in the developing world lack access to potable water due largely to microbiological and chemical contaminations [11]. Drinking water sources in these so-called developing countries are under increasing threat from contaminations by chemical, physical and microbial pollutants. Known sources (both naturally occurring and anthropogenic) of chemical contamination of water supplies include organic and inorganic substances from industrial effluents, municipal wastes, petroleum derived hydrocarbons, detergents, mining, agricultural pesticides and fertilizers [12]. 


Water chemistry provides valuable information to determine the origin, transit time, flow patterns and water regimes, geological structure, and mineralogy of aquifers, as well as hydrogeochemical processes. Specific water quality is required to meet both domestic and irrigation needs. Their monitoring and evaluation are essential to design preventive measures on human health, animal life, and vegetation.


Trace metals, among a wide range of contaminants, are consistently of health concern due to their toxicity potentials at very low concentrations, and tendency to bioaccumlate in tissues of living organisms over time [13].


Although several studies have assessed the groundwater quality based on heavy metal pollution for different purposes, there are only a few studies that targeted the abundant of the major chemical components of the ground water and their relationship with the depth of the wells. In the present investigation we put a spot of view on this point in Aljamil region put a spot of view on this point in Aljimil region in western Libya.


MATERIALS AND METHODS

Study Area

Ground water samples were collected from wells (n=20) located in Aljamil region. The samples was carried out to be examined in the laboratory. The location of the wells was recorded using Geological Positioning System (GPS). The sampled wells were a private property. Many of the sampled wells were the main source of drinking water and house proposes for the local population. 


Collection of Samples

Ground water samples were collected in one-liter plastic bottles, which were previously thoroughly washed with tap water and rinsed with distilled water. These were immediately acidified to pH 2 with HNO3 in order to keep metals in solution and prevent them from adhering to the walls of the bottles. All samples were transported to the laboratory in iceboxes and refrigerated at 4°C until analyzed. Sampling protocol was designed in such a way that samples collected in one sampling schedule were analyzed in the shortest possible time.


Sample Analysis

Samples were analyzed for trace metals (PH), TDS ,Conductivity ,Salinity % ,SO4-- ,Cl- ,T.H (CaCO3) ,Ca. as CaCO3 Mg++ CaCO3 ,Alkalinity , HCO-3 ,NO-2 ,NO-3 ,NH4+ ,Ca ++ ,Mg++ ,PO4++ ,T, Na+ , K+ ,Fe using a Perkin Elmer model 1000 Inductively Coupled Plasma. (ICP) spectrophotometer equipped with an ultrasonic nebulizer model Cetec U 5000 AT. The use of the ultrasonic nebulizer instead of a pneumatic nebulizer provided a 5 to 50 fold improvement in detection limits and a 10 fold enhancement resulting in better reproducibility on trace metal level determinations. Analysis was carried out in triplicate and average values are reported. The ICP was calibrated with relevant Perkin Elmer Pe-Pure spectroscopy grade standards.


Quality Assurance and Quality Control Program

To assess the precision and accuracy of results, replicate analysis of blank, standard and samples was done. The relative standard deviations were determined to find the precision of the analysis. Recovery results were calculated for the determination of accuracy. One standard with one set of samples was analyzed routinely.


Pollution Index (Pi)


Pollution index (Pi) is defined as the ratios of the concentration of individual parameter against the baseline standard. It provides information on the relative pollution contributed by individual samples. The critical value is 1.0, values greater than 1.0 indicates significant degree of pollution while values less than 1.0 shows no pollution [14] and [15]

RESULTS AND DISCUSSION

The minimum, maximum and standard division of (trace , macro elements, salts, salinity, alkalinity, and PH) values in different parts of Alajmil region has been estimated. As shown in Table 2 PH, K+, HCO3-, NO3-Fe- , recorded an acceptable Pi index with Pi values (0.995 , 0.501, 0.593, 0.0502 and 0.0293) respectively. While Pi value for TH was extremely unacceptable recording (19.984) followed by PO4++ (7.223). The present data clearing that, only 5 parameters have an acceptable Pi values compared with the standard quality reference assigned by WHO. As shown in Table 3 a positive correlation values were recorded between the depth of the well an all the parameters of the study except salinity. A possible explanation is that a great amounts of salts are abundant deeply in the ground and dissolved in the ground water. On the other hand, TDS , SO4-- , TH (CaCO3), Ca++ , Cl- and Mg ++ were higher than the standard levels recognized by Table 2. A great variations between investigated values and standard ones are occurred in an important chemical components such as TDS, Mg ++ and TH (CaCO3) so, the current study sheds light on a potentially vital problem. pH values ranged from 6.9 to 7.5, showing an alkaline behavior due to water mineralization, probably coming from the salt content in the rock surrounding the aquifer. It can be assumed that the concentration of salts that provide alkalinity to water, which corresponds to the rainy seasons, in which the recharge of the aquifer allowed the dissolution of the ions, which can be confirmed with the reported concentrations, in alkaloid salts. On the other hand, The electrical conductivity shows the presence of dissolved salts in the water that are generally incorporated into the water from geochemical processes such as ion exchange, evaporation, silicate weathering, and the solubilization process that take place within the aquifers [16].In the present study, values of conductivity between 1118 and10650 µS/cm were observed. Electrical conductivity is a parameter directly related to the presence of ions in dissolution, so the presence of dissolved salts can be observed and affected PH values. 


Table 1: Minimum, Maximum, Mean Values and, Standard Division of Samples

 SDMeanMaximumMinimumParameters
0.1877.2257.56.9)PH)
1995.1602699.8156840715TDS
3077.9124284.4106501118Conductivity
5.998.4720.92.7Salinity %
476.118516.261584.330.35SO4 --
512.27674.921685144.3Cl-
1351.171998.395356.371351.17T.H (CaCO3)
592.17926.102358.67192.6Ca. as CaCO3
743.201116.862997.69263.76Mg. CaCO3
1.10178.8182178Alkalinity 
1.10178.8182178HCO3
1.1690.54315400.00NO2-
2.4712.81549.8500.00NO-3
0.3890.1511.50.01NH4+
237.061369.543943.46877.043Ca ++
183.396255.528713.73847.404Mg++
1.02620.93953.30.1PO4++
1.88923.38526.521.0T(sodium ion)
622.530722.2052175145.6Na+
10.0015.045384K+
0.01650.0440.70.0Fe-


Table 2: Pollution Index for Chemical Components Referred To WHO for Ground Water Quality

Water quality parameter (WHO 2004)Pi indexCalcification 
(PH)6.5-80.995Acceptable
EC15002.856unacceptable
TDS10002.699unacceptable
Ca2+2001.84unacceptable
Mg2+1501.703unacceptable
Na+2003.611unacceptable
K+300.501Acceptable
HCO3-3000.593Acceptable
Cl-2502.699unacceptable
SO42-2502.065unacceptable
NO3-500.0502Acceptable
Fe-1.50.0293Acceptable
TH (CaCO3)10019.984unacceptable
PO4++0.137.223unacceptable
SO42502.065unacceptable


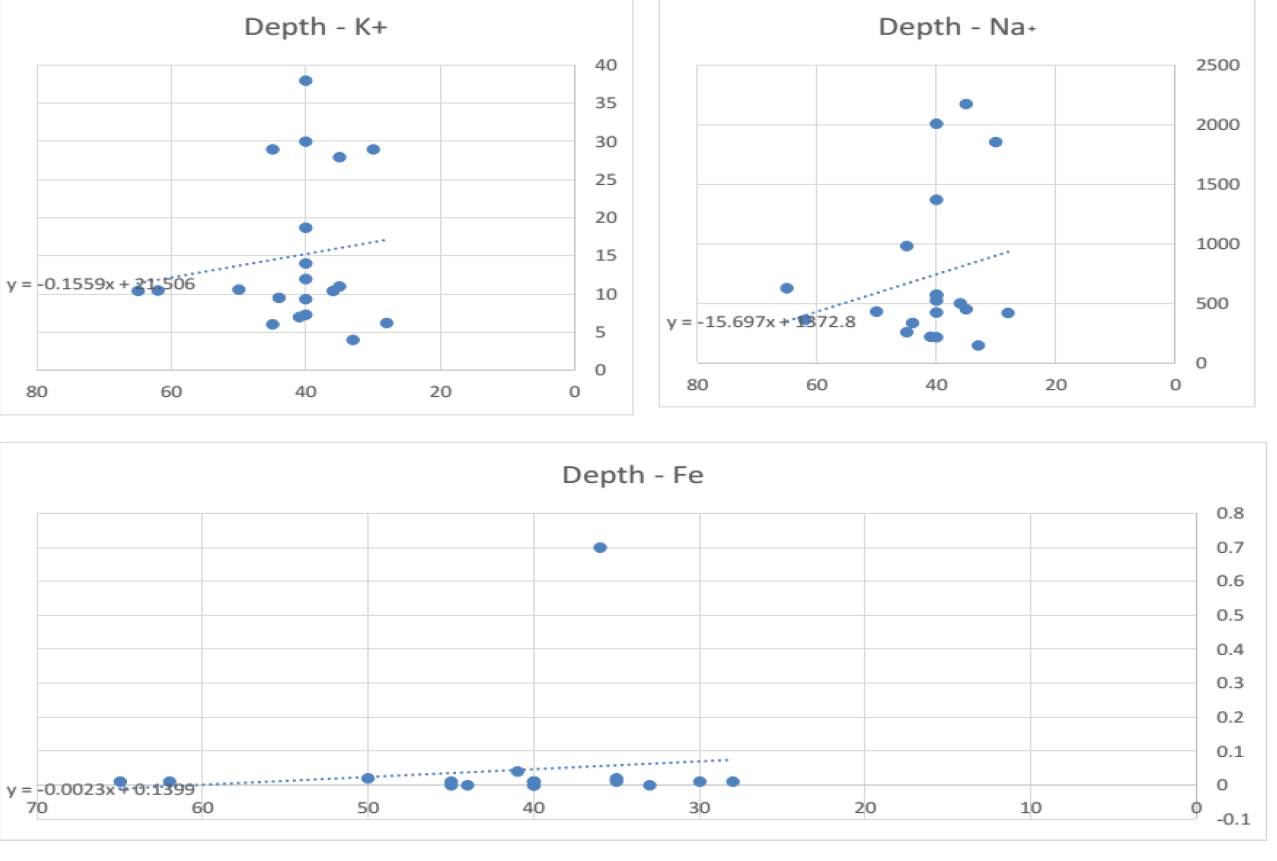
Table 3: Correlation Coefficient Values and Regression Equations for Chemical Components and the Well Depth

Regression equations rParameters
y = -2E-05x + 7.22570.58(PH)
y = -33.183x + 4075.30.166571TDS
y = -37.096x + 58220.197657Conductivity
y = -0.0007x + 0.1129-0.54495Salinity %
y = -3.7557x + 671.940.199474SO4 --
y = -8.4128x + 1023.60.158646Cl-
y = 11.024x + 1541.40.343111T.H (CaCO3)
y = 8.1642x + 587.70.382459Ca. as CaCO3
y = 2.6045x + 1008.90.32506Mg. CaCO3
y = -0.0058x + 179.040.560778Alkalinity 
y = -0.0058x + 179.040.560778HCO3
y = 0.0948x - 3.38440.623167NO2-
y = 0.101x - 1.3730.4981NO-3
y = 0.0279x - 1.00410.6209NH4+
y = 3.282x + 233.50.38225Ca ++
y = 0.6901x + 226.920.313566Mg++
y = 0.0221x + 0.02340.340179PO4++
y = -0.0957x + 27.3520.472379T(sodium ion)
y = -15.697x + 1372.80.115391Na+
y = -0.1559x + 21.5060.20767K+
y = -0.0023x + 0.13990.254769Fe-


Groundwater is under pressure in many parts ofthe world, especially in arid and semiarid regions. It is important to develop methods that reduce the complexity of data to clearly understandable numbers that managers and decision makers can readily use. These results are in agreement with those of [17] who stated that, efficiency in water use, water re-use, groundwater recharge and ecosystem sustainability. Groundwater catastrophe is controlled by both natural and human actions. The World Health Organization (WHO) has discriminated the major factor influencing the greater population is/as lack of access to clean drinking water.

CONCLUSION

This study allows knowledge of the hydrogeochemistry and drinking water quality in Aijamil region, and may be useful for subsequent research since there is no previous information on the chemistry of water in this zone. The groundwater of the studied area presented a slight tendency to alkalinity. The order of abundance of major parameters in this study is: Conductivity > TDS > T.H (CaCO3) > Mg >CaCO3 > Ca. as CaCO3> Na+ >Cl- > SO4 -- >Ca ++ > Mg++ > Alkalinity > HCO3 > T(sodium ion) > K+ > Salinity % > (PH) > NO-3 > PO4++ > NO2- > NH4+ > Fe (Figure 1-3) . More over Most of the substances dissolved in groundwater are in an ionic state. Some ions are almost always present, and their sum represents almost all the dissolved ions. The major ions are T.H (CaCO3), Mg , CaCO3 , Ca. as CaCO3, Na+ ,Cl- , SO4 -- ,Ca ++ , Mg++ , HCO3 , T(sodium ion) ,K+ , NO-3.


Figure 1: Scatter Plots of Depth vs. Various Water Quality Parameters


Figure 2: Scatter Plots of Depth vs. Water Quality Parameters: Chemical and Physical Analysis


Figure 3: Depth-Dependent Variations in Water Quality Parameters”


Figure 4: Ragressions for Chemical Components and well Depth

REFERENCE
  1. Lvovitch, M.I. et al. “World Water Balance: General Report.” IASH/UNESCO/WMO Proceedings of Symposium on World Water Balance, Reading 1970, IASH Proceedings No. 2, International Association of Hydrological Sciences, 1972, pp. 401–415.

  2. Busico, G. et al. “Statistical Analysis to Characterize/Discriminate between Anthropogenic and Geogenic Trace Elements Occurrence in the Campania Plain, Southern Italy.” Environmental Pollution, vol. 234, 2018, pp. 260–269.

  3. Sahoo, M.M. et al. “Modified Heavy Metal Pollution Index (m-HPI) for Surface Water Quality in River Basins, India.” Environmental Science and Pollution Research, 2020.

  4. Tiwari, R.N. et al. “A Study of Bauxite Deposit of Tikar Plateau Rewa District, M.P.” Gondwana Geological Society Special Publication, vol. 13, 2012, pp. 111–118.

  5. Njitchoua, R. et al. “Geochemistry, Origin and Recharge Mechanisms of Groundwater from the Garoua Sandstone Aquifer, Northern Cameroon.” Journal of Hydrology, vol. 190, 1997, pp. 123–140.

  6. Hem, J.D. Study and Interpretation of the Chemical Characteristics of Natural Waters. 3rd ed., Scientific Publishers, 1991.

  7. Karanth, K.R. Groundwater Assessment, Development and Management. Tata McGraw-Hill, 1997.

  8. Subramani, T. et al. “Groundwater Quality and Its Suitability for Drinking and Agricultural Use in Chithar River Basin, Tamil Nadu, India.” Environmental Geology, vol. 47, no. 8, 2005, pp. 1099–1110.

  9. Hussain, J. et al. “Nutrient Evaluation and Elemental Analysis of Four Selected Medicinal Plants of Khyber Pakhtoon Khwa, Pakistan.” Pakistan Journal of Botany, vol. 43, no. 1, 2011, pp. 427–434.

  10. Gopinath, M. Groundwater Quality Assessment in Pungar Subbasin, Tamilnadu, India. M.Phil. Thesis, Annamalai University, 2011.

  11. WHO/UNICEF. Estimated Data from WHO/UNICEF Joint Monitoring Programme (JMP) for Water Supply and Sanitation: Progress., 2012.

  12. Ergul, H.A. et al. “Investigation of Heavy Metal Pollutants at Various Depths in the Gulf of Izmit.” Marine Pollution Bulletin, vol. 73, 2013, pp. 389–393.

  13. Ikejimba, C.C. et al. “Comparative Study of Some Heavy Metals’ Concentrations in Water and Tympanotonus fuscatus var. Radula Samples of Egbokodo River, Warri, Nigeria.” International Journal of Modern Biological Research, vol. 2, 2014, pp. 7–15.

  14. Akpoveta, O.V. et al. “Quality Assessment of Borehole Water Used in the Vicinities of Benin, Edo State and Agbor, Delta State of Nigeria.” Current Research in Chemistry, vol. 3, 2011, pp. 62–69.

  15. Umeobika, U.C. et al. “Physicochemical Analysis of Rain Water Collected from Selected Areas in Awka South, Anambra State, Nigeria.” International Journal of Science Innovations and Discoveries, vol. 3, no. 1, 2013, pp. 56–73.

  16. INEGI. Compendio de Información Geográfica Municipal 2010 Zamora, Michoacán de Ocampo.Mexico City, INEGI, 2010.

  17. Nash, H. et al. Ground Water Quality. Chapman and Hall, 1995.

Recommended Articles
Research Article
Electrochemical Comparative Studies On The Redox Behavior Of Cu(II) And Cr(II) Before And After Interactions With Ciprofloxacin In Solutions
Published: 10/08/2021
Download PDF
Research Article
A Rare Case Report of Waugh Syndrome in an Eight Months Old Male
...
Published: 10/03/2021
Download PDF
Research Article
Study on Prevalence and Etiology of Early Neonatal Deaths in Jasin district, Melaka from 2014-2017
...
Published: 30/05/2021
Download PDF
Research Article
Clinicopathological Correlation in Cases of Acute Appendicitis: An Overview
...
Published: 05/04/2025
Download PDF
Chat on WhatsApp
Flowbite Logo
PO Box 101, Nakuru
Kenya.
Email: office@iarconsortium.org

Editorial Office:
J.L Bhavan, Near Radison Blu Hotel,
Jalukbari, Guwahati-India
Useful Links
Order Hard Copy
Privacy policy
Terms and Conditions
Refund Policy
Shipping Policy
Others
About Us
Team Members
Contact Us
Online Payments
Join as Editor
Join as Reviewer
Subscribe to our Newsletter
+91 60029-93949
Follow us
MOST SEARCHED KEYWORDS
Copyright © iARCON International LLP . All Rights Reserved.