This study compared the chemical compositions of two local varieties of rice in Wukari, Taraba state. The two local varieties of rice analyzed were, Jambawo and Faro, both cultivated in Wukari. The samples were analyzed for proximate composition on dry matter basis, mineral and phytochemical compositions. Gross energy composition was determined theoretically. Proximate composition of the samples were determined by Standard Methods of Association of Official Analytical Chemists (AOAC), while Atomic Absorption Spectrophotometer (AAS) was used for mineral content determination. Phytochemical Screening and quantification were carried out using standard methods. The results of the proximate analysis showed that Jambawo had higher levels of moisture content (13.27%), ash (1.20%), crude lipid (9.08%), crude fibre (0.56%), and crude protein (6.12%) than Faro. However, moisture content, ash, crude lipid, crude fibre, crude protein and carbohydrate (NFE) were 12.41%, 1.04%, 8.17%, 0.30%, 3.02%, and 87.48% respectively. Apart from ash content which were observed to be 1.20±0.05 and 1.04±0.12 for Jambawo and Faro respectively, there were significant differences (p<0.05) in the proximate parameters analyzed for the two varieties of rice. Qualitative screening of array of phytochemicals and quantitative determination of alkaloids, flavonoids, phenols and oxalate were determined. The oxalate content was 1.17% and 1.05% for Jambawo and Faro respectively, while the contents of flavonoids, alkaloids and phenols, as well as that of oxalate (p<0.05) varied significantly. The investigation showed that Jambawo is more nutritious than Faro, this finding can be exploited by consumers and farmers in making choices based on the innovative information revealed.
Keywords
Proximate Composition
Minerals
Phytochemicals
Rice Varieties
Wukari
INTRODUCTION
Rice is the seed of the grass species Oryza sativa (Asian rice) or Oryza glaberrima (African rice), and of the grass family Poaceae [1]. The major rice type grown in Nigeria is the Asian rice Oryza sativa and Nigeria is the highest producer of rice in West Africa [2]. It is one of the most widely consumed and important staple foods in world supplying as much as half of the daily calories of the world population [3]. FAOSTAT [4] reported that rice is the third highest agricultural commodity produced worldwide, after sugarcane and maize.
The nutritional component of rice is one of the most important indicators of quality; rice is predominantly a starchy food though it also contributes useful quantities of proteins and vitamins, mineral, pentosans and fiber [5]. According to Oko at al. [6] rice grain contains 75-80% of starch, 7% protein and 12% water. However, a freshly harvested rice grains contain about 80 % carbohydrates which include starch, glucose, sucrose, dextrin, [7]. After carbohydrate, protein is the second most abundant constituent of rice [8]. Milling of rice generally decreases its fibre contents, however, the percentage fibre contents of milled rice samples were in the range of 1.5 to 2.0% and 1.5 – 2.0% for ash composition [9]. Whole rice is milled before marketing. The nutritional values of rice varies with different varieties, soil fertility, fertilizer application and other environmental conditions [6].
Phytochemical screening reveals the presence of secondary metabolites (non-nutritive compounds) such as flavonoids, alkaloid, saponins tannis oxalate etc. these phytochemical molecules found in plants contributes to its flavour, colour and protect them from pest.
In Wukari and its environs, the north-eastern part of Nigeria, there are varieties of rice cultivated for commercial purpose which include sipi, faro,jambawo, china, jantare, abari and kparogedi, just to mention a few [10] .Out of these varieties, two of them (jambawo and faro) were compared with a view to determine their nutritional worth. Therefore, the objective of this work is to evaluate the proximate, mineral and phytochemical composition of the two selected indigenous rice samples.
MATERIALS AND METHODS
Plant Materials
Two local commercially available rice varieties namely ‘Jambawo’ and ‘Faro’ were procured from the local market in Wukari, Taraba State. These different rice cultivars were all cultivated under similar conditions. At maturity, the grains were harvested, processed and milled in Wukari, Taraba State. The local varieties of rice were taken to the Advanced Chemistry Laboratory, Sheda Science and Technology Complex (Shestco), FCT, Abuja for analysis.
Determination of the Proximate Composition
Determination of Moisture Content: This is a measure of the % moisture lost due to drying at a temperature of 105oC. Moisture Content was determined using oven dry method as describe by Udo and Oguwele [11]. Crucible were thoroughly washed and dried, it was allowed to cool inside a desiccator and weighed (Wo) after cooling. Finely ground rice samples (10g) were put into the crucibles and weighed (W1). Thereafter, it was dried at 105oC for 3 hours, then cooled in a desiccator and weighed. A constant weight (W2) was obtained after the process of drying, cooling and weighing were repeated. Then, the moisture content of the rice sample was obtained by the equation:
Determination of Ash Content
This is based on the vaporization of water and volatiles with burning organic substances in the presence of oxygen in the air to CO2 (dry ashing). According to James [12], 2g of the finely ground dried sample was weighed (W1) into a pre-weighed empty porcelain crucible (Wo) and placed into a muffle furnace at 550OC for 5hrs or more until ash was obtained. The ash was cooled in a desiccator and reweighed (W2). The formula below was used to calculate the % ash content in the rice sample:
Determination of Crude Lipids
The Crude lipid content in the rice sample was extracted using Soxhlet extraction procedure, described by Udo and Oguwele [11]. The ground samples (2g) were weighed (Wo) in a labelled weighing paper (W1) and properly tightened, it was then transferred into an extraction thimble. A measurement of petroleum ether (200cm3) was transferred into a 250 cm3 extraction flask. The apparatus were assembled andextraction was carried out for 6hrs, the thimble was removed carefully and the samples wrapped in papers (defatted sample) dried at 105OC for 30min to be completely free from solvent and moisture, it was then weighed (W2). The percentage crude lipid was calculated using the equation below:
Determination of Crude Fibre Content
Percentage of crude fibre was determined using the method of Udo and Oguwele [11]. About 2.0 g of the rice sample was weighed (Wo) into a 1dm3 conical flask, water (100cm3) and 20cm3 of 20% H2SO4 were added and boiled gently for 30min. A whatman No1 filter paper was used to filter the content. The residue was scrapped back into the flask with a spatula, 100cm3 of water and 20cm3 of 10% NaOH were added and allowed to boil gently for 30min. The mixture was then filtered and the residue washed thoroughly with hot distilled water, then rinsed once with 10% HCl and twice with ethanol and finally three times with petroleum ether. It was allowed to air dry, scrapped into the crucible and dried overnight at 105OC in an air oven. It was then removed and cooled in a desiccator. The sample was weighed (W1) and ashed at 550OC for 90min in a muffle furnace. It was then weighed again (W2) after cooling it in a desiccator.The percentage crude fibre was calculated using the equation below:
Determination of Protein
The crude protein content of the rice samples was determined using the Microkjeldahl method of AOAC [13], which involved protein digestion, distillation and titration. The principle of this method is based on the transformation of protein and that of other nitrogen containing organic compounds, other than nitrates and nitrates into ammonium sulphate by acid digestion:
Protein Digestion
About 2.0 g of the rice sample was weighed into a Kjeldahl flask and one tablet of Kjeldahl catalyst was added. This was followed up with the addition of 25 ml concentrated sulphuric acid. The whole mixture was subjected to heating in the fume cupboard. The mixture was gently heatedat first and the heat intensified with occasional shaking till a green colour was obtained from the solution. The temperature of digester was above 420℃ for about 30min. the mixture was allow to cooled and distilled water were used to washed the black particles at the neck of the flask.The solution was re-heated gently at first until the green colour disappeared. Then, it was allowed to cool. After cooling, the digest was transferred into a 100 ml volumetric flask with several washings and made up to the mark with distilled water and then distilled using Markham distillation apparatus.
Protein Distillation
Before use, the Markham distillation apparatus was steamed through for 15 min after which a 100 ml conical flask containing 20ml of 4% boric acid and two drops of mixed indicator was placed under the condenser outlet such that the condenser tip was under the liquid. About 10ml of the digest was pipetted into the body of the apparatus via a small funnel aperture, and 10ml of 40% NaOH was added to the solution.The distillation starts and heat supply was regulated to avoid sucking back. When all available distillate was collected or enough ammonium sulphate was collected in the 20ml of boric acid, the distillation was stopped. The receiving flask was removed.
Titration
The solution in the receiving flask was titrated with 0.01M hydrochloric acid, the end point was obtained when the colour of the distillate change from green to pink. Similarly, a blank was used alongside the sample.
Crude protein is a measure of nitrogen in the sample. It was calculated by multiplying the total nitrogen by a constant, 5.95 [14]. this is based on the assumption that, protein contain about 16%N which include both true protein and non-protein, nitrogen and does not make a distinction between available or unavailable protein [11]. The crude protein on wet basis was calculated using
Where
TVs and TVb are the Titre value of sample and blank, Na is the normality or concentration of acid, V1 is the Volume of water used for distilling the digest (100ml), V2 is the Volume of aliquot (10ml) and G is the Original weight of sample used
Determination of Carbohydrate
The total percentage carbohydrate content in the rice sample was determined by difference method of James, [12]. This was adopted where the total proportion of carbohydrate in the rice sample was obtained by calculation using the percentage dry method. The value obtained is the percentage carbohydrate constituent of the sample.
Thus
CHO (%) = 100 – (%Crude fibre + %Crude Protein + %Crude Lipid + %ash).
Determination of Phytochemical Analysis in Rice
This analysis was carried out using ethanol extract of Oryza sativa. The sample was extracted using ethanol by soaking 20g of the powdered sample in 200ml of ethanol for 12hrs, the extract was then filtered using filter paper. The extract was then concentrated and stored in airtight container.A portion of the concentrated extract was used for the qualitative and quantitative analysis using standard methods as described by Sofowora [15] and Trease and Evans [16].
Test for Flavonoid
The determination of flavonoids in the rice sample was carry out by acid hydrolysis and spectrophotometric method. Processed rice sample (0.5g) was mixed with 5ml of dilute hydrochloric acid and boiled for 30min. The boiled sample was allowed to cool, filter, 1ml of the filtrate was added to 5ml of ethyl acetate and 5ml of 1% ammonia solution. The reading was taken at absorbance 520nm [16].
Test for Oxalate
Deionized water was heated at temperature of 29oC and the sample was soaked for a minute. The extract (5ml) was added to 1ml of 5M NaOH and 1ml of 5% CaCl2 and three drops of phenolphthalein were added, it was allowed to stand for 3hrs and centrifuged at 300rpm for 15mins. The supernatant was discarded and precipitate washed with hot water. Titration was carried out, 2ml of 3M H2SO4 was pipetted into a conical flask and precipitate dissolved by warming in a water bath at 80oC. The content of each tube was titrated with freshly prepared 0.01M KMnO4. The titration was carried out at ordinary temperature until a first colour change was observed. It was allowed to stand until the colour changes to colourless. The solution was warmed at 70oC and titration carried out until a pink colour persisted for at least 30secs [15].
Test for Phenols
The quantity of phenol was determined using spectrophotometric method. The rice sample was boiled with 50ml of diethyl ether or petroleum ether for 15min. The boiled sample (5ml) was then pipetted into 50ml volumetric flask and 10ml of distilled water was added. After addition of distilled water, 2ml of ammonium hydroxide solution and 5ml of conc. Pentanol was added to the mixture. It was made up to mark and left for 30mins for colour development and measured at 505nm wavelength using a spectrophotometric method [16].
Test for Alkaloids
The rice sample (0.5g) was dissolved in 96% ethanol-20% H2SO4 (1:1) and to 1ml of the filtrate was added 5ml of 60% H2SO4 and allowed to stand for 5mins. Then, 5ml of 0.5% formaldehyde was added and allowed to stand for 3hr, the reading was taken at absorbance of 565nm [16].
Mineral Composition
Mineral composition of two local varieties of rice samples was determined using yhe methods of The AOAC [13].
Gross Energy Composition
Gross energy composition of two local varieties of rice samples was calculated using the method of AOAC [13]:
Fatx9+carbohydrate x 4+protein x 4 kcal/100 g
Statistical Analysis
Three replicates were analyzed per sample and the data generated were subjected to statistical analysis using student T-test. Statistical Package for Social Sciences (SPSS) software version 23 was used and group means were compared for significance at p≤0.05. Data were presented as mean± standard deviation.
RESULTS AND DISCUSSION
Carbohydrate
Significant differences (p<0.05) were observed in the values of the proximate composition with exception of ash which had no significant differences between the treatments. These local rice varieties (Jambawo and Faro) contained high levels of carbohydrates respectively (83.04% and 87.48%). However, these values are higher than the values (75.37 to 76.37%) stated by Edeogu et al. [17] who worked on some staple food crops in Ebonyi state analyzing their proximate compositions, but are within the range of values (76.92 to 86.03%) obtained by Oko and Ugwu [9] who analyzed the proximate and mineral compositions of five major rice varieties in Abakaliki, south-eastern Nigeria. The values of carbohydrate obtained in this study are bit lower than the values gotten by Eggum et al. [18]. Faro rice contains high carbohydrate level than Jambawo, this high carbohydrate content may be due to its low moisture content which is a factor that affects the milling quality, couple with other environmental factors. The high percentage in carbohydrate contents of the rice varieties show that rice is a good source of energy.
Moisture Content
The moisture content of a sample is defined as the total water content of that sampleThe low percentage in moisture content of rice samples in this study, shows that rice is properly dried to safe level in which storage can be embarked, Ebuehi and Oyewole [19] reported that the moisture content of rice affected its storage. It follows that Faro rice variety with 12.41% would have a longer shelf life compared to Jambawo rice having 13.27% due to lower moisture content. However, these values are higher than the range of values (3.67%-8.0%) reported by Oko et al. [6] who comparatively analyzed the chemical nutrient of selected local and newly introduced rice varieties in Ebonyi State, Nigeria. This may be attributed to the level of drying of rice sample.
Ash
The ash fraction contains all the mineral elements present in the food sample. However the ash content obtained was between 1.04 and 1.20%. These findings are in agreement with the report of Oko et al. [6]. This analysis provided an insight into the mineral content in these rice varieties (Table 1)
Table 1: Proximate Analysis on Dry Matter Basis of Two varieties of local Rice
Proximate analysis on Dry basis
Samples
Moisture
Content (%)
Ash (%)
Crude lipid (%)
Crude fibre (%)
Crude protein (%)
Nitrogen Free Extract (NFE)
(%)
Jambawo Rice
Faro
13.27±0.02a
12.41±0.16b
1.20±0.05a
1.04±0.12a
9.08±0.00a
8.17±0.02b
0.56±0.02a
0.30±0.02b
6.12±0.01a
3.02±0.01b
83.04±0.03b
87.48±0.13a
Data are shown as mean ± standard deviation (n=3). Mean values with different alphabet showed significant difference at p<0.05
Crude Protein
Results revealed that, Jambawo contains the highest protein value (6.12%), this is in line with Ebuehi and Oyewole [19] findings. The protein levels of the two varieties of rice investigated in this study also aligned within the range 1.58 to 6.22% obtained by Oko and Ugwu [9], which was found to be lower than the range obtained by Edeogu et al. [17]. This observation could be attributed to prolonged parboiling rice which had been found to lower the protein content of rice, coupled with some other environmental and edaphic factors [9].
Crude Fibre
The percentage crude fibre contents were 0.56% and 0.30% for Jambawo and Faro respectively. These values are lower than the range of 1.5 to 2.0% gotten by Oko and Ugwu [9], and that of Edeogu et al. [17] which had values ranging between 1.93% and 4.3%. These observations could be due to milling and environmental conditions. This is because milling of rice generally decrease its fibre content, coupled with other environmental conditions.
Crude lipid
The percentage lipid content of samples in this study are within the range 8.17 and 9.08%. These values are higher than the range obtained by Edeogu et al. [17] and that reported by Willis et al. [20] and Juliano [18]. This difference may be attributed to the degree of milling, since milling of rice removes the outer layer of the grain where most of the fats are concentrated (Table 2-3).
Table 2: Qualitative Analysis (Screening) of Phytochemicals in Rice Sample
Phytochemicals parameters
Samples
Jambawo
Faro
Tannin
-
+
Steriods
+
-
Triterpenoid
-
-
Glycoside
-
-
Anthraquinone
-
-
Saponin
-
-
Phenol
-
+
Alkaloid
+
+
Cardenolides
-
-
Terpenoid
+
+
Flavonoid
-
+
Cardiac glycoside
+
+
Phlobatanin
-
-
Resins
+
+
Balsams
-
-
Volatile oil
+
+
Legend: + indicates Present, – indicates absent
Table 3: Quantitative Analysis of Phytochemicals in Rice
Samples
Alkaloid (%)
Flavonoid (%)
Phenol (%)
Oxalate (%)
Jambawo Rice
Faro
35.83±0.02b
52.46±0.07a
0.01±0.01b
53.24±0.02a
0.01± 0.01b
49.61±0.02a
1.17±0.02a
1.05±0.01b
Data are shown as mean ± standard deviation (n=3). Mean values with different alphabet showed significant difference at p<0.05
Phytochemicals
Phytochemistry in the strict sense of the word is the study of phyto-chemicals. In a narrow sense, the term is used to describe the large number of secondary metabolic compounds from plants [21]. Many of these are known to provide protection against insect attacks and plant diseases as seen in BT toxin (Baccillus thurengensis) that paralyze insects that feed on the plant. They also exhibit a number of protective functions in human existence [22].
The concentration of alkaloids in Table 4 is 35.83% for Jambawo sample while that of Faro is 52.46% but both are significantly different at p<0.05. The concentration of flavonoids is significantly higher (p<0.05) in Faro 53.24% compared with Jambawo.
Table 4: Mineral Concentration of Rice Samples
Rice Samples
Zn (mg/kg)
Cu (mg/kg)
Mn (mg/kg)
Fe (mg/kg)
Pb(mg/kg)
Cd (mg/kg)
Jambawo
16.99±0.02a
3.38±0.01b
17.43±0.01b
23.41±0.01a
Nil
Nil
Faro
12.74±0.07b
5.87±0.01a
17.68±0.03a
23.16±0.10a
Nil
Nil
Data are shown as mean ± standard deviation (n=3). Mean values with different alphabet showed significant difference at p<0.05
The percentage of oxalate obtained was slightly below what was reported by Umar et al. who worked on wild rice. This may be due to the fact that nutritional values of rice varies with different varieties, soil fertility, fertilizer application and other environmental conditions. Alkaloids are famous analgesics [23] and have been utilized in a variety of ways in the treatment of diseases and during surgery due to their medicinal and pharmacological efficacy. The concentration of flavonoids is significantly higher (p<0.05) in Faro 53.24%compared with Jambawo. Their phenol and oxalate content are also significantly different.
Minerals
These findings indicated that varying amounts of minerals were present in the rice samples; this observation is similar to the work carried out by Bor et al. [24]. Iron was one of the major mineral constituents of rice obtained. The highest iron content was found in Jambawo to be 23.41 mg/kg followed by Faro with 23.16mg/kg, the Fe content of these samples are not significantly different (p>0.05), whereas, there were significant differences (p<0.05) in Magnesium, zinc, and copper content of the two local varieties of rice [9]. Rivero et al. [25] reported that minerals and vitamins are lost during milling because a greater amount of rice bran are removed from grain. Cadmium (Cd) and Lead (Pb) which are heavy metals were not found in the local rice analyzed, since the presence of these metals are injurious to health, therefore these results suggest that these rice are safe for consumption.
Energy
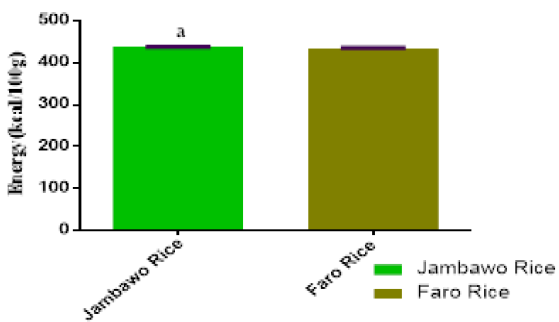
The highest energy content was 438.38 Kcal/100g (1841.2KJ/100g) for Jambawo and second 435.51 Kcal/100g (1829.1KJ/100g) for Faro are significantly different at p< 0.05 as shown in Figure 1. The energy content obtained as 438.38 Kcal/100g (1841.2KJ/100g) and 435.51 Kcal/100g (1829.1KJ/100g). These values are higher than the range of values reported by Oko et al. [6] who had values ranging between 262.94 Kcal/100g to 398.42 Kcal/100g. These may be attributed to the high carbohydrate content in the rice samples analyzed in this study.
Figure 1: Energy Composition of Two Varities of local Rice
CONCLUSION
The results obtained in this study revealed the qualities of the two local varieties of rice, which showed that Jambawo is more nutritious than Faro. The findings can be exploited by consumers and farmers in making choices based on the innovative information. This could translate to more consumption and cultivation of Jambawo variety than Faro varietal rice. The antinutritional factor (oxalate) present in rice are in minute quantity, hence will not be harmful or hazardous. The levels of oxalate are low in the two local varieties of rice analysed, as such, they cannot interfere with potentially useful nutrients embedded in these varieties of rice. showed that Jambawo is more nutritious than Faro and this findings can be exploited by consumers and farmers in making choices based on the innovative information revealed.
REFERENCE
Vaughan, D.A. et al. “Diversity in the Oryza genus.” Current Opinion in Plant Biology, vol. 6, 2003, pp. 139–146.
Singh, B.N. et al. “Rice growing environments and biophysical constraints in different agro-ecological zones in Nigeria.” Journal of Meteorology, vol. 1, 1997, pp. 35–37.
Aadil, A. et al. “Effect of processing on nutritional value of rice (Oryza sativa).” World Journal of Medical Sciences, vol. 6, no. 2, 2011, pp. 68–73.
FAOSTAT. FAOSTAT Statistical Database. Food and Agriculture Organization, 2012.
Roy, P. et al. “Processing conditions, rice properties, health and environment.” International Journal of Environmental Research and Public Health, vol. 8, 2011, pp. 1957–1976.
Oko, A.O. et al. “Comparative analysis of the chemical nutrient composition of selected local and newly introduced rice varieties grown in Ebonyi State of Nigeria.” International Journal of Agriculture and Forestry, vol. 2, no. 2, 2012, pp. 16–23. DOI: 10.5923/j.ijaf.20120202.04.
Yousaf, M. Study on some physicochemical characteristics affecting cooking and eating qualities of some Pakistani rice varieties. M.Sc. Thesis, University of Agriculture Faisalabad, 1992.
Probart, C.K. et al. “Diet and athletic performance.” Medical and Clinical Journal of North America, vol. 5, 1993, pp. 77–757.
Oko, A.O. and S.I. Ugwu. “The proximate and mineral compositions of five major rice varieties in Abakaliki, South-Eastern Nigeria.” International Journal of Plant Physiology and Biochemistry, vol. 3, no. 2, 2011, pp. 25–27.
Arowora, K.A. et al. “Chemical composition of polished rice (Royal Stallion) and local varietal rice (Sipi) sold in Taraba State.” Uniosun Journal of Sciences, vol. 2, no. 1, 2017, pp. 54–59.
Udo, E.J. and J.A. Oguwele. Laboratory Manual for the Analysis of Soil, Plants and Water Samples. 3rd ed., University of Ilorin, 1986, pp. 131–152.
James, C.S. Analytical Chemistry of Food. Chapman and Hall, 1995, pp. 64–65.
AOAC. Official Methods of Analysis. 17th ed., Association of Official Analytical Chemists, 2000.
Merrill, A.L. and B.K. Watt. Energy Value of Foods: Basis and Derivation. Agriculture Handbook No. 74, USDA, 1973.
Sofowora, A. Medicinal Plants and Traditional Medicine in Africa. 2nd ed., Spectrum Books, 1993, pp. 134–156.
Trease, G.E. and W.C. Evans. Pharmacognosy. 15th ed., Saunders Publishers, 2002, pp. 42–44, 221–229, 246–249, 304–306, 331–332, 391–393.
Edeogu, C.O. et al. “Proximate compositions of staple food crops in Ebonyi State, South Eastern Nigeria.” International Journal of Biotechnology and Biochemistry, vol. 1, 2007, pp. 1–8.
Eggum, B.O. et al. “Protein and energy utilization of rice milling fractions by rats.” Plant Foods for Human Nutrition, vol. 31, 1982, pp. 371–376.
Ebuehi, O.A. and A.C. Oyewole. “Effect of cooking and soaking on physical characteristics, nutrient composition and sensory evaluation of indigenous and foreign rice varieties in Nigeria.” African Journal of Biotechnology, vol. 6, no. 8, 2007, pp. 1016–1020.
Willis, R.B.H. et al. “Composition of Australian foods: Rice.” Food Technology in Australia, vol. 34, 1982, pp. 66–68.
Adodo, A. Natural Power: A Christian Approach to Herbal Medicine. 4th ed., Don Bosco Training Centre, 2002.
Iwu, M.M. Handbook of African Medicinal Plants. CRC Press, 1993, pp. 255–257.
Mothes, U.N. “Analysis of fruits and leaves for determination of nutrients.” Journal of Biological and Food Sciences, vol. 10, 1996, pp. 83–86.
Bor, S.L. et al. “Rice bran: Chemistry and technology.” Rice Utilization, edited by Bor S.L. and Van Nostrand Reinhold, Van Nostrand Reinhold, 1991, pp. 313–363.
Rivero, H. et al. “Concentration of As, Ca, Cd, Cr, Cu, Fe, Hg, K, Mg, Mo, Na, N, Pb and Zn in Uruguayan rice, determined by AAS.” Atomic Spectroscopy, vol. 27, no. 2, 2007, pp. 48–55.
Recommended Articles
Research Article
Serum IL-22, miRNA-146a Expression and Total Antioxidant Status as Integrated Biomarkers in Rheumatoid Arthritis
Khalid R. Kareem
Published: 13/08/2026
Download PDF
Research Article
Electrochemical Comparative Studies On The Redox Behavior Of Cu(II) And Cr(II) Before And After Interactions With Ciprofloxacin In Solutions
H. M. Naseem Akhtar,
M. Q. Ehsan
Published: 10/08/2021
Download PDF
Research Article
A Rare Case Report of Waugh Syndrome in an Eight Months Old Male
Pielly Hanna,
...
Bassem Abou Merhi
Published: 10/03/2021
Download PDF
Research Article
Study on Prevalence and Etiology of Early Neonatal Deaths in Jasin district, Melaka from 2014-2017
Sujat a Khobragade,
...
Yadneshwar Khobragade
Published: 30/05/2021
Download PDF
PO Box 101, Nakuru
Kenya.
Email: office@iarconsortium.org
Editorial Office:
J.L Bhavan, Near Radison Blu Hotel,
Jalukbari, Guwahati-India
Arowora, K. A., None, C. I., Kukoyi, A. J. & Ugwuoke, K. C. (2021). Comparative study on the Chemical composition of two local varieties of rice in Wukari, Taraba State. International Academic Journal of Applied Bio-Medical Sciences, 2(1), 1-6.
MLA
Arowora, K. A, et al. "Comparative study on the Chemical composition of two local varieties of rice in Wukari, Taraba State." International Academic Journal of Applied Bio-Medical Sciences 2.1 (2021): 1-6.
Chicago
Arowora, K. A, C. Imo , A. J. Kukoyi and K. C. Ugwuoke. "Comparative study on the Chemical composition of two local varieties of rice in Wukari, Taraba State." International Academic Journal of Applied Bio-Medical Sciences 2, no. 1 (2021): 1-6.
Harvard
Arowora, K. A., None, C. I., Kukoyi, A. J. and Ugwuoke, K. C. (2021) 'Comparative study on the Chemical composition of two local varieties of rice in Wukari, Taraba State' International Academic Journal of Applied Bio-Medical Sciences 2(1), pp. 1-6.
Vancouver
Arowora KA, C. Imo CI, Kukoyi AJ, Ugwuoke KC. Comparative study on the Chemical composition of two local varieties of rice in Wukari, Taraba State. International Academic Journal of Applied Bio-Medical Sciences. 2021 Jan;2(1):1-6.


 Download PDF
 Download XML