This study investigated the effect of population quality on service industry growth from a micro perspective. The results show that China’s service industry reaches the turning point at which its accelerated growth begins in 2011 and along with technological progress and increase in per-capita income, high population quality is playing an increasingly important role in this accelerated growth. Furthermore, population quality affects service industry growth through at least four channels: (1) the comparative advantage effect (personal consumption turns to the types of services in which the high-quality population has a comparative productivity advantage, therefore progressively more services are no longer self-provided, but are rather produced by the high-quality population in the market); (2) the opportunity cost effect (for the production of any specific service, the high-quality population is confronted with higher opportunity costs, so they choose to purchase external services instead; with the increase in skill premium and proportion of high-quality population, there is a rise in the proportion of service consumption in the whole society); (3) the mental preference effect (the high-quality population has a higher preference for consumption and production of service products; the overall improvement in population quality pushes society to develop an increasing inclination for consumption and production of service products, thus raising the proportion of service consumption); (4) the relative price effect (the rise in relative wages of the high-quality population forces the relative prices of service and material products up, thus increasing the nominal proportion of the service industry measured in terms of present value). The findings of this study provide important theoretical evidence for determining China’s current stage of economic development. While the Chinese economy has reached the Lewis turning point, such findings provide policy suggestions for the high-quality development of the Chinese economy and transformation of China from a service industry giant into a service industry power.
Keywords
Lewis Turning Point
Population Quality
Skill Premium
Economy Servicizing
INTRODUCTION
Whether by international standards or Chinese standards, China’s working-age population continues to decrease, whereas the total dependency ratio of the population continues to increase, implying that China’s economic growth has reached the Lewis turning point [1]. According to the equation of service industry growth [2] and considering that China’s service industry is still dominated by the traditional service industry [3], it can be inferred from China’s reaching the Lewis turning point that the growth of China’s service industry may be constrained by the shortage of labor [4]. However, this is not so. In terms of the current year’s prices, the proportion of the service industry’s value added to the Gross Domestic Product (GDP) has risen from 44.16% (2011) to 52.20% (2017), 11.5 percentage points higher than that of the secondary industry. Evidently, the service industry has become the main impetus of China’s economic growth. In other words, since the 12th Five-Year Plan period (2011-2015) China’s service industry growth is not constrained by the so-called ceiling effect of labor supply, but speeds up.
What are the reasons for China’s accelerated service industry growth? Regarding this question, there is a divergence of opinion in academia. Some scholars maintain that China’s service industry growth is owing to the higher rate of increase in service prices [5] and to the advance in statistical techniques [6] (In the three economic censuses of China performed in 2004, 2009 and 2014, the proportion of value-added service industry was raised by 8.8, 1.7 and 0.8 percent points, respectively). Certain scholars ascribe the rapid growth of China’s service industry to Baumol’s cost disease [7]. Others argue that because of the government-implemented supply-side structural reform, resource factors are released from the traditional sectors with an overcapacity, thus providing sufficient labor, funds and technologies for increasing the supply capacity of the service industry [8].
On the contrary, still others argue that the total factor productivity of China’s service industry has tended to overtake that of the secondary industry in recent years [9]; in addition, modern technologies (particularly, network technologies) are changing the fundamental characteristics of the service industry, the traditional hypothesis of the low productivity of the service industry is no longer true and the accelerated growth of China’s service industry is largely owing to its own development [10]. A large body of literature on the cause of the accelerated growth of China’s service industry provides useful perspectives for understanding China’s service industry and economic development. However, we conclude that China’s service industry growth in recent years is overall real, based on the following facts: (1) in the process of Chinese economy servicizing, the difference in productivity between the service industry and non-service industries is tending to converge [11]; (2) the accelerated growth of China’s service industry brings about substantive changes in the allocation of labor resources between different industries. In the three economic censuses, the revisions of the service industry value added are reduced continuously, indicating a weakening in the effect of statistical technique advance on the data of service industry growth. China’s supply side structural reform only began in the 13th Five-year Plan period (2016-2020), so it cannot account for the growth of China’s service industry prior to 2016. With extensive use of modern communications and information technologies in China, the critical hypotheses on low productivity of the service industry are no longer true; however, it is too early to conclude accordingly that the cost disease of China’s service industry has been cured by the innovation in production technologies. Evidently, the accelerated growth of China’s service industry needs to be explained in other ways.
A detailed investigation of changes in Chinese economic phenomena reveals that along with the accelerated growth of the service industry, China transformed from a population quantity dividend era to a population quality dividend era around 2011. Hence, this study concentrated on the following questions: (1) is there an internal relation between service industry growth and population quality? (2) Can the accelerated growth of China’s service industry be explained from the perspectives of differences in microeconomic behaviors between high-quality population and low-quality population? (3) Depending on the influencing mechanism, can the direct effect of population quality on service industry growth be subdivided? (4) Population quality can affect service industry growth directly; however, can service industry growth be affected by external factors (e.g., income level and technological progress) through the agency of population quality? Is there an internal relation between this and the accelerated growth of China’s service industry?
This study investigated the effect of population quality differences in a two-sector economy on the accelerated growth of the service industry from a micro perspective. It found that the accelerated growth of China’s service industry concurs with the rapid rise in the quantity of Chinese high-quality population and their skill premium and there is a remarkable consistency in the growing trends of the three factors. Among the populations of varying quality, there are differences in consumption and production behaviors; in the final analysis, such behavioral differences affect the change in industrial structure. Undoubtedly, this has a far-reaching influence on the development of the service economy. This study may make four theoretical contributions: First, it is the first to investigate and determine the turning point at which China’s service industry embraces accelerated growth, thus providing theoretical evidence for determining China’s current stage of economic development. Second, the investigation of the cause of the service industry growth is not built on the hypothesis of traditional service economy theory that the productivity of service industry is low, thus leading the studies of service economy. Third, it combines the analysis of supply and demand; this study investigated the differences in productivity and consumption structure between high- and low-quality populations from the perspectives of supply and demand, respectively. In addition, the two investigations were complementary to each other, thus gaining an insight into the cause of service industry growth. Fourth, this study focused on the consumption and output of services rather than original labor allocation, which is different from the practice in early classical documents on service economy. Focusing on service output and consumption experience rather than production input, this approach reveals that the output and consumption of the service industry are different from those of agricultural and manufacturing industries and is consistent with the reality that China is currently undergoing a shift in social principal contradiction and calls for high-quality economic development.
The rest of this paper is organized as follows: Sections II and III measure the turning point at which China’s service industry embraces accelerated growth and give a statistical description of that growth, improvement in population quality and skill premium. Section IV analyzes the statistical correlation in the trends among accelerated growth of the service industry, rise in the proportion of high-quality population and skill premium. From the perspectives of direct effect and mediating effect, Sections V and VI respectively analyze the realistic relation between population quality and the accelerated growth of the service industry. Section VI presents conclusions and policy suggestions and analyzes the limitations of this study.
The Turning Point at which the Growth of China’s Service Industry Accelerates
The service industry is an entry point of industrial restructuring and the emphasis of its important role in Chinese socioeconomic development is unprecedented, whether in academia or during policy making. At important moments and on public occasions, Chinese officials at different levels reiterate that the development of the service industry is a highlight of and gives a new impetus to the New Normal of the Chinese economy. After the service industry became the largest in the Chinese economy, a few scholars and officials even assert that the Chinese economy has entered an era of servicizing. The key question lies in when the servicizing of the Chinese economy accelerates.
Statistical Evidence for the Accelerated Growth of China’s Service Industry
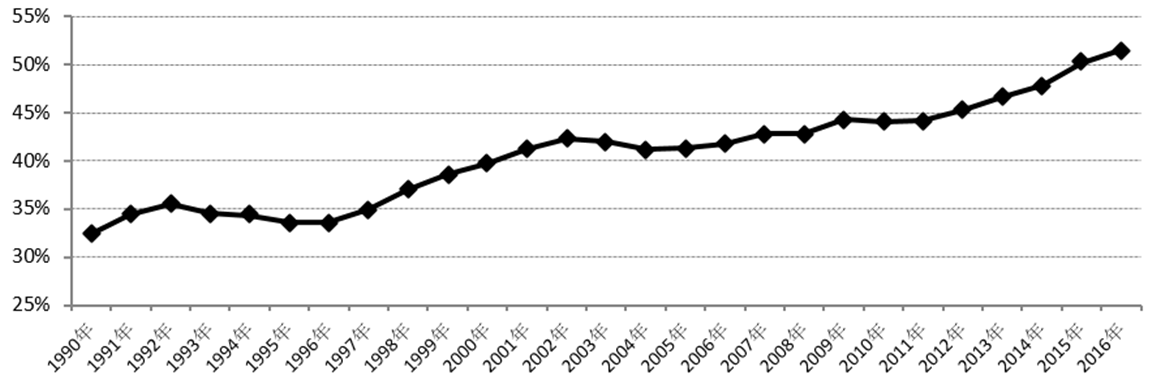
In terms of the current year’s prices, the value added of China’s service industry begins its accelerated growth in 2011. As shown in Figure 1, the development of China’s service industry in the 21st century is divided into three stages: (1) 2001 to 2007; (2) 2008 to 2010; (3) 2011 to the present. The first stage (2001 to 2007) begins with the accession of China to the World Trade Organization at the end of 2001 and ends before the outbreak of the most recent global financial crisis. In the context of the high degree of development of advanced producer services in developed countries and non-integration of production in the manufacturing industry, China joined the global value chain, developed low-end manufacturing industries through original equipment manufacturers and implemented an export-oriented development strategy. While the manufacturing industry is globalized, the service industry is localized; therefore, the due endogenous positive interaction between the secondary and tertiary industries is artificially severed. As a result, China’s industrialization model has an inhibitory effect on the development of service industry [12,13]. Therefore, it is easy to find from the statistical graph that the proportion of value added of China’s service industry (measured in terms of present value) grows at an approximate level and very slowly during the years of 2001 to 2007. At the second stage (2008 to 2010), China implemented the 4-trillion yuan investment program to meet the global financial crisis; in essence, China still pursued an extensive industrialization development strategy. During this period, the proportion of China’s value-added service industry increases slightly statistically. At the third stage (2011 to the present), with the rise in per-capita income level and technological progress, China’s economic restructuring was performed effectively and the service industry embraced accelerated growth. During the years from 2011 to 2016, the proportion of the service industry’s value added (measured in terms of present value) is respectively 44.16, 45.31, 46.70, 47.84, 50.24 and 51.56%, with an average annual growth rate of 3.14%.
Figure 1: Proportion of Value Added of Tertiary Industry (by Current Year's Prices)
Data Source: China Statistical Yearbook 2017
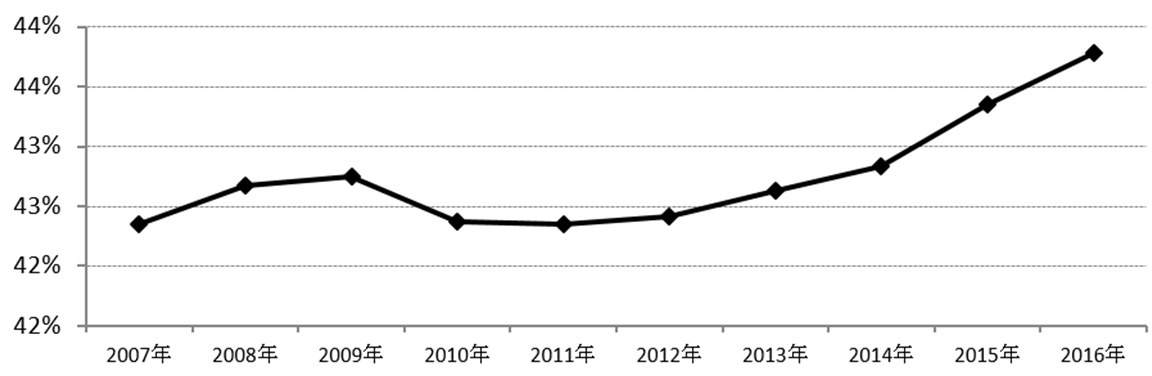
Around 2012, the proportion of China’s service industry (measured in terms of constant prices) also grows at an accelerated pace. The commonly mentioned economic growth rate refers to the real economic growth rate, which is measured in terms of constant prices or comparable prices. Hence, the rise in the proportion of nominal value added of China’s service industry cannot represent the servicizing trend of the Chinese economic structure entirely, nor can it reveal that China’s service demand is automatically activated with the rise in per-capita income level. In terms of comparable prices, the servicizing trend of the Chinese economy is not necessarily consistent with its nominal growing trend. Figure 2 shows the variation in the proportion of China’s service industry measured in terms of 2010’s constant prices. Before 2010, the proportion of China’s service industry measured in terms of constant prices increases first and then decreases but varies slightly on the whole. Around 2012, however, the proportion of China’s service industry measured in terms of constant prices shares the same trend with that measured in terms of current year’s prices, presenting an accelerated growing trend.
Figure 2: Proportion of Value Added of Tertiary Industry (by Constant Prices of 2010)
Data Source: Calculated According to "33: GDP Measured by Constant Prices" in China Statistical Yearbook 2017
In summary, the variation in the nominal proportion of the service industry shows that it embraces accelerated growth approximately around 2010 or 2011. The variation in the proportion of the service industry measured in terms of constant prices shows that it embraces accelerated growth approximately around 2011 or 2012. Namely, the statistical variation in nominal or real proportion of value added of China’s service industry can merely reveal that China’s service industry reaches the turning point at which its growth accelerates approximately during the years of 2010 to 2012, but it is impossible to determine the specific year.
Determining the Turning Point of the Growth Rate of China’s Service Industry
To determine the specific turning point at which China’s service industry embraces accelerated growth, we built an individual fixed effect model based on provincial-level panel data from 2002 to 2016. Then, we attempted to determine the specific turning point using an econometric method. The specific model is as follows:
sᵢ,ₜ = αᵢ + β ln yᵢ,ₜ + eᵢ,ₜ (*)
In this model, S denotes the proportion of the value-added service industry to regional GDP; yi,t denotes the per-capita income of Province i in the t-th year; αᵢ denotes the fixed effect of Province i; β denotes the degree to which the per-capita income level affects the proportion of the value-added service industry. According to the significance level and magnitude of β, we judged the per-capita income level when the accelerated growth of China’s service industry began, thus determining the year in which China’s per-capita income level reached the threshold value. This specific year was the turning point: the beginning of the accelerated growth of China’s service industry.
As mentioned above, the turning point is approximately positioned during the years of 2010 to 2012. We selected 2011 to try because of the following reasons: First, the Chinese economy underwent an obvious slowdown in 2011. Second, whether by international standards or Chinese standards, the first Lewis point, which is typically characterized by a decrease in working-age population and an increase in the total dependency ratio of population, occurred in 2011. Third, the service industry became China’s largest industry and surpassed agriculture in 2011. In 2011, the proportion of employment in the service industry is 6.2 percentage points higher than that in the secondary industry and 0.9 percentage points higher than that in the primary industry. In subsequent years, the proportion of employment in the service industry continues to increase; specifically, in 2016, it is 14.7 percentage points higher than that in the secondary industry and 15.8 percentage points higher than that in the primary industry. Fourth, it was in 2011 that foreign investment, as a bellwether of China’s market and investment preference, reached a turning point. In 2011, the foreign investment actually utilized by the manufacturing industry was $ 55.7 billion and that actually utilized by the service industry was $ 58.3 billion. In terms of actually utilized foreign investment, the service industry surpassed the manufacturing industry for the first time. In subsequent years, the proportion of foreign investment actually utilized by the service industry continues to increase, whereas that actually utilized by the manufacturing industry decreases at a uniform rate.
China’s 2011 per-capita GDP was ¥ 36,403. Using the per-capita income of ¥ 36,403 as the yardstick, the sample data of 31 provincial-level administrative regions (excluding Taiwan, Hong Kong and Macau) were divided into high-income and low-income samples. Then, a regression analysis was conducted using an appropriate model (*). The upper half of Table 1 gives the descriptive statistics of s (proportion of the value-added service industry) and y (per-capita income) in the high-income sample and low-income sample. Models 1 and 2 in Table 2 respectively reflect the results of regression analysis on the high-income and low-income samples using Model (*).
Table 1: Descriptive Statistics of Variables
Low-income sample
s
Sample size
Mean
Standard deviation
Minimum
Maximum
312
0.4
0.058
0.283
0.691
y
312
19,000
9,322
3,257
36,000
High-income sample
s
153
0.471
0.108
0.347
0.802
y
153
57000
20000
37000
120000
Sample before 2011
s
186
0.442
0.093
0.297
0.802
y
186
48000
22000
16000
120000
Sample after 2011
s
310
0.41
0.078
0.283
0.761
y
310
22,000
16,000
3,257
85,000
Calculated using the Stata14
Table 2: Turning Point at which China’s Service Industry Growth Accelerates
lny
Model 1: High-income sample
Model 2: Low-income sample
Model 3: Sample in and after 2011
Model 4: Sample before 2011
s
s
s
s
0.1291***
-0.0065**
0.1706***
-0.0158***
_cons
[15.23]
[-2.24]
[11.10]
[-5.33]
-0.9370***
0.4632***
-1.3824***
0.5639***
N
[-10.14]
[16.40]
[-8.41]
[19.61]
153
312
186
279
The values contained in [ ] are the t values of estimated coefficients; *, ** and *** respectively indicate that estimated coefficients are significant within the 10, 5 and 1% intervals
Among the regression analysis results of the high-income sample, the â value is 0.129, which is significant within the 1% confidence interval. Namely, for the high-income sample in which the per-capita income of regional residents reaches ¥ 36,403, a 1% rise in per-capita income brings about a rise of 0.0013 in the proportion of value added of regional service industry. Among the low-income sample’s regression analysis results, the â value is -0.007, which is significant only within the 10% confidence interval. Namely, for the low-income sample in which the per-capita income of regional residents is less than ¥ 36,403, a rise in per-capita income brings about a slight decline in the proportion of value added of regional service industry. However, the correlation between them is not significant.
The sample data were divided using 2011 as the reference point. The lower half of Table 1 gives the descriptive statistics of s and y in the sample before 2011 and in the sample in and after 2011. Models 3 and 4 in Table 2 respectively reflect the results of regression analysis on the sample before 2011 and the sample in and after 2011 using Model (*). Among the results of regression analysis on the sample in and after 2011, the â value is 0.171, which is significant within the 1% confidence interval. Namely, a 1% rise in per-capita income brings about a rise of 0.0017 in the proportion of value added to the regional service industry. Among the results of the regression analysis on the sample before 2011, the â value is -0.016, which is significant within the 1% confidence interval. Namely, during the years before 2011, a rise in per-capita income brings about a slight decline in the proportion of value added to the regional service industry.
Evidently, whether by per-capita income or reference time, empirical results reveal that 2011 is the turning point at which China’s service industry growth accelerates.
Improvement in China’s Population Quality and Variation in Skill Premium
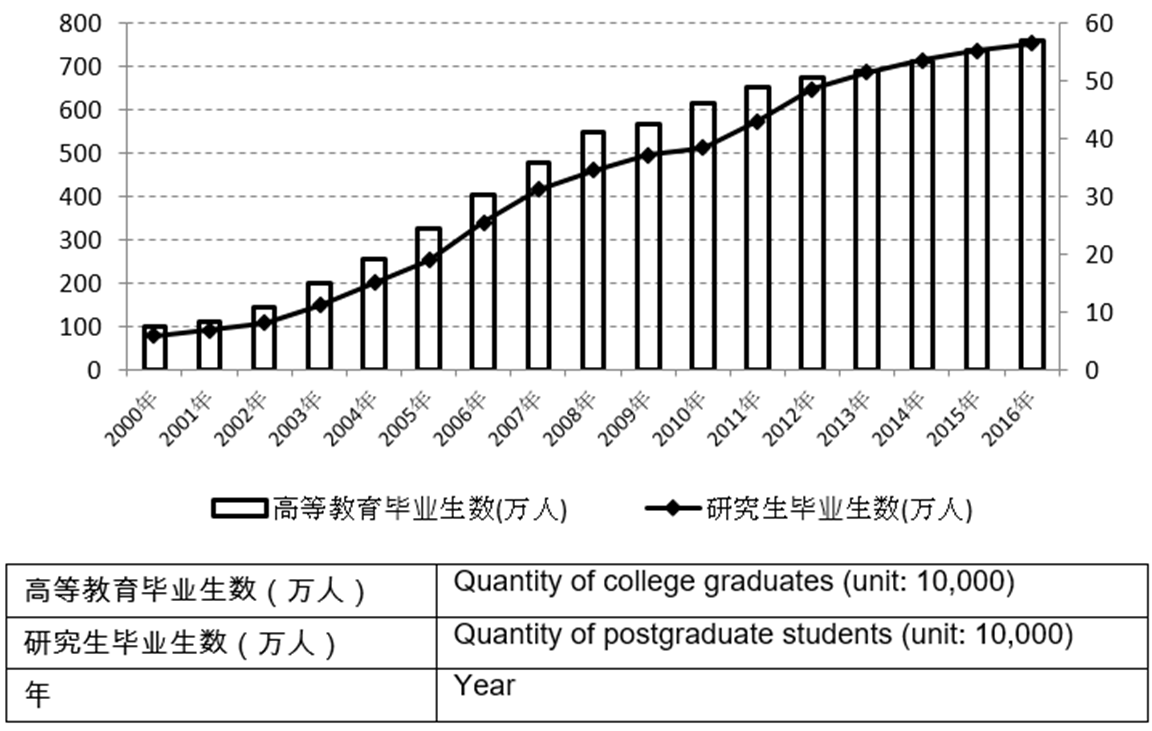
In recent years, the increase in the supply of China’s high-quality population has accelerated. On one hand, China reached the Lewis turning point (Sampled statistics as from 2005 show that the proportion of Chinese population aged 15 to 39 reached a peak in 2011 (approximately 40%) and then began to decline significantly; in addition, China's overall dependency ratio of population (ratio of non-working age population to working-age population) continued to decline, reaching the bottom in 2011 and then began to increase) around 2011 and the migration of rural population to towns slowed down. On the other hand, over the last decade, China has accumulatively educated nearly 60 million college graduates and 4.5 million postgraduate students and introduced nearly 50,000 high-caliber overseas Chinese students and at least 6,000 high-caliber overseas experts as per The Recruitment Program of Global Experts. As a result, there is rapid growth in both China’s high-quality population and its proportion in total Chinese population (as shown in Figure 3). In other words, we may easily ignore the following fact: after China reached the turning point of population quantity (i.e., the commonly mentioned “population dividend“) in 2011, China’s dividend of population quality (also known as “engineer dividend”) was unleashed at an accelerated pace. Hence, China entered a new era in which the dividend of population quality was unleashed and its science and technology were catching up with and even surpassed those of advanced countries. In recent years, the rapid increase in high-quality population has manifested in not only absolute quantity, but also relative proportion. Based on a new historical level, the overall education degree of the Chinese population continues to rise rapidly. Since the expansion of college enrolment in 1999, the proportion of the Chinese population with a junior college or higher level of education (including the junior college level, Bachelor’s degree and Master’s degree) has risen continuously from 3.81% (2000) to 12.94% (2016), increasing by a factor of 3.4 within 17 years. In particular, this figure continued to rise rapidly during the four years (specifically, 13.33% in 2015) after reaching 10.06% in 2011.
Figure 3: Quantity of Chinese Graduates with Different Educational Degrees from 2000 to 2016
Data Source: National Bureau of Statistics
In recent years, the rapid rise in high-quality population is accompanied by the continuous rise in skill premium. Based on the micro data of the China Health and Nutrition Survey (CHNS), Jiang [14] calculates China’s skill premium level from 1989 to 2011. Calculation results show that China’s skill premium level continues to rise during the 22 years of 1989-2011 (excluding 2009). The temporary decline in skill premium level in 2009 is associated with the great effect of the Global Financial Crisis 2008 on China’s employment. However, China’s skill premium level begins to rise again after the financial crisis is mitigated. The CHNS only provides data from 1989 to 2011 and China’s related statistics lack the data on average wage measured in terms of educational degree. Hence, there are no reliable sources of data about China’s skill premium level in and after 2012 yet. However, we have every reason to believe that China’s skill premium level will continue to rise after 2011 and even rise at an accelerated pace. As the Chinese economy enters the New Normal stage, the pattern of economic development is gradually transforming from extensive growth to high-quality growth and economic development relies increasingly on high-quality population, thus raising the skill premium level even further. The rapid rise in China’s skill premium level from 2011 to 2016 manifests vividly in the average wage differences between subdivided sectors. According to the statistics of the National Bureau of Statistics, the ratio of the average wage between the three sectors with a high proportion of employment of high-quality population (i.e., information transmission, computer service and software; education; and scientific research and technological service) and a sector with a low proportion of employment of low-quality proportion (i.e., hospitality and catering) increases respectively from 2.58:1, 1.57:1 and 2.21:1 (in 2011) to 2.82:1, 1.72:1 and 2.23:1 (in 2016). Moreover, a survey from 2011 to 2016 conducted by MyCOS Institute reveals that although both junior college graduates and college graduates with a Bachelor’s degree are high-quality population, the rise in the monthly salary of the former is obviously lower than that of the latter after three years of graduation. This is because of the obvious difference in skill levels between them.
Statistical Correlation between the Improvement in Population Quality and Service Industry Growth
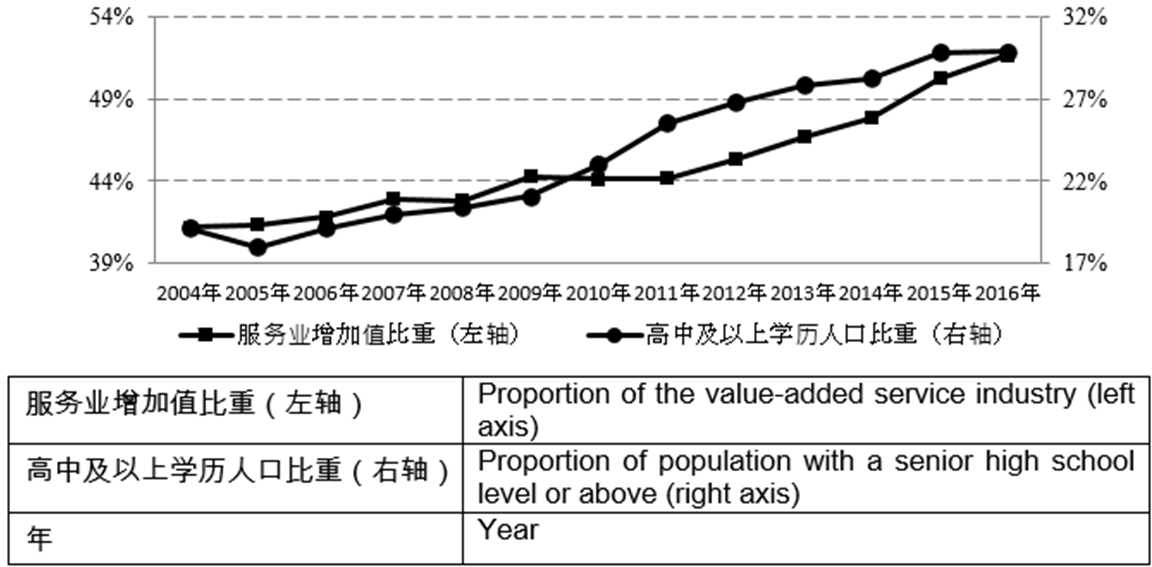
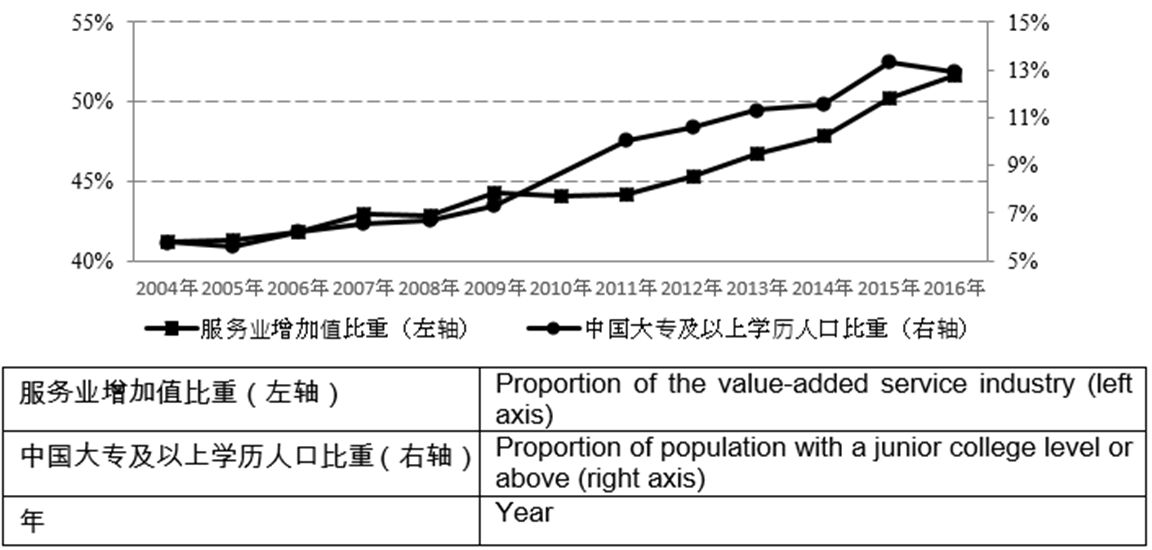
Statistical Correlation between the Proportion of High-Quality Population and Service Industry Growth: Population quality is a relative concept. For the purpose of accuracy, the quality level of the Chinese population is respectively measured in terms of the proportion of the population with a senior high school level or above and the proportion of the population with a Bachelor’s degree or above. Figure 4 shows the growing trend in the proportion of China’s value-added service industry and in the proportion of China’s high-quality population during the same period. During the 12 years (2004-2016), both the proportion of population with a senior high school level or above and the proportion of population with a Bachelor’s degree or above share a remarkably consistent growing trend with the proportion of value added of China’s service industry. In particular, the consistency is more obvious if we consider the lagged effect (assume that the lag period is less than one year) of population quality on service industry growth.
Figure 4: The Statistical Correlation between the Proportion of High-Quality Population and the Proportion of the Service Industry
Data Source: China Statistical Yearbook (2005-2017)
As shown in Figure 4, the proportion of China’s value-added service industry increases at an accelerated pace from 2015 to 2016; during this period, the proportion of population with a senior high school level or above increases moderately and the proportion of population with a Bachelor’s degree or above even declines slightly. This seems to be a contradictory phenomenon. Given the lagged effect, the variation trend in the proportion of the value-added service industry from 2015 to 2016 is supposed to be consistent with that of the proportion of high-quality population from 2014 to 2015. Figure 4 shows that they are exactly consistent, namely, increasing at an accelerated pace. Likewise, the moderate rise in the proportion of high-quality population from 2015 to 2016 is consistent with the gradual rise in proportion of the value-added service industry from 2016-2017; specifically, the proportion of the value-added service industry increases by only 0.07 percentage points in 2017. Overall, during the years of 2011 to 2016, the proportion of high-quality population shares a remarkably consistent growing trend with the proportion of the value-added service industry; specifically, both of them increase at an accelerated pace.
Statistical Correlation between Skill Premium Level and Service Industry Growth
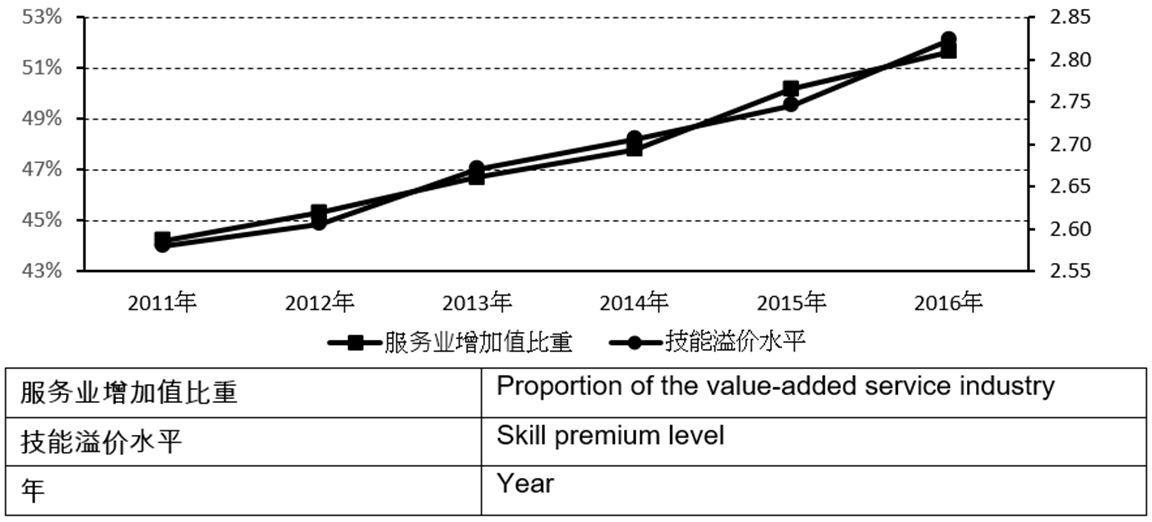
Considering the availability of data, we used a measuring method [15,16] for reference. Using the ratio of average wage between a sector with a high proportion of employment of high-quality population (i.e., information transmission, computer service and software) and a sector with a low proportion of employment of high-quality proportion as the proxy variable of skill premium, we measured the change in China’s skill premium level after 2011. As shown in Figure 5, during the years of 2011 to 2016, both China’s skill premium level and proportion of China’s value-added service industry increase at an accelerated pace and they share an almost completely consistent variation trend.
Figure 5: The Statistical Correlation between the Skill Premium Level and the Proportion of China’s Service Industry
Data Source: National Bureau of Statistics
Direct Effect of Population Quality on Service Industry Growth
Overall, population quality has two direct effects on service industry growth. First, populations of varying quality differ remarkably in terms of the comparative advantage in productivity, opportunity cost of self-sufficiency and mental preference for service products; therefore, populations of varying quality have behavioral differences in production and consumption of material products and service products, thus affecting the real proportion of the value-added service industry. Second, the continuous rise in relative wages (i.e., skill premium) of high-quality population against low-quality population can affect the relative prices of service precuts against material products, thus affecting the nominal proportion of the value-added service industry.
The Effect on the Real Proportion of the Service Industry through the Comparative Advantage in Productivity
Compared with the low-quality population, the high-quality population has two comparative advantages: First, the high-quality population has a comparative advantage in the productivity of complex products and the comparative advantage is more significant with the increase in the complexity of services (In other words, high-quality population and low-quality population are slightly different in terms of the productivity of low-end products, but significantly different in terms of the productivity of high-end products. The higher the product complexity is, the more significant the productivity difference is). Second when the complexity of services reaches a certain level, the low-quality population can hardly produce such services because of their limited competences and the comparative advantage of high-quality population in the productivity of services tends to be infinitely great.
The real proportion of the service industry is mainly affected by the comparative advantage of high-quality population in productivity in two aspects: The marketization of household services [17] and the extreme expansion of the scope of service consumption. The first aspect implies that for the purpose of cost effectiveness, economic individuals usually choose to purchase in the market complex services that they are able to produce but have no comparative advantage in. In the market, the same services can be produced by population of higher quality; with higher productivity, such population of higher quality can produce homogeneous services at a lower cost.
The second aspect implies that because of limited competences, low-quality population can merely purchase high-end services, which cannot be produced by themselves but can be produced by a population of higher quality. Because of the comparative advantage of high-quality population in the productivity of complex services, economic individuals choose to purchase services that they have no production advantage in and are not able to produce. This constitutes a real connection between population quality and service industry growth.
With the remarkable development of the Chinese industrial economy, people can purchase all manner of consumable material products, ranging from low-end soy sauce and pushpins to high-end Apaid and smart sound boxes. Because of the underdevelopment of China’s service industry, many types of services are still at a non-market-produced self-sufficiency stage. Material products are usually produced and acquired in the market, whereas service products can be produced and acquired in the market and through families. Therefore, the marketization of household services and the expansion of the scope of service consumption will remarkably increase the proportion of value-added services in the total GDP.
The Effect on the Real Proportion of the Service Industry from the Opportunity Cost of Self-Sufficiency
For service products with specific complexity in the market, the high-quality population has a higher productivity than the low-quality population. For service products produced in households (or self-provided service products), however, the difference in productivity between them is not significant whether or not high-quality population or low-quality population usually produce them. The comparative advantage of high-quality population in productivity is only manifested in the production of high-complexity service products. In terms of productivity of low-complexity service products, there is no significant difference between high- and low-quality populations.
Everyone’s time endowment is limited. An increase in the time of household production implies a sacrifice in the time of market production. The opportunity cost of household production is equal to the time of market production sacrificed for household production multiplied by the hourly wage of market production. For specific service products, if the opportunity cost of household production is higher than the satisfaction from household production, people prefer market consumption rather than self-supply. The difference in productivity of household production is very trivial between high-quality population and low-quality population and in the labor market the high-quality population enjoy a higher hourly wage than the low-quality population. Therefore, for household production, the high-quality population will assume a far higher opportunity cost than low-quality population. As a result, for any specific household service product, there is almost no difference in the satisfaction between high-quality population and low-quality population, but the high-quality population will assume a higher opportunity cost. Hence, the high-quality population will choose to purchase more types of service products in the market rather than producing them in their households. The higher the quality of the population is, the more types of service products they will purchase in the market.
The Effect on the Real Proportion of the Service Industry from the Relative Preference for Service Products
In this study, “relative preference for service products” is defined as the ratio of mental preference for service products to that for material products. The populations of varying quality differ remarkably in terms of the relative preference for service products, thus affecting the proportion of the value-added service industry directly.
First, the high-quality population can afford to consume certain services that the low-quality population cannot and spend a higher proportion of personal income on services. This is primarily associated with their relatively higher income. Even if the high-quality population shares the same income level and other material conditions with the low-quality population, they can obviously afford to consume more types of services than the low-quality population. This is largely associated with the cognitive difference arising from factors like cultural literacy and learning ability. Second, if basic material needs are satisfied, the high-quality population will spend more time otherwise occupied by self-sufficient production on the market production of service products than the low-quality population. Compared with the low-quality population, the high-quality population will face a far greater difference between the satisfaction from the market-produced services and satisfaction from the self-sufficient production within the same time. This is closely related to the sense of self-fulfillment and sense of social identity.
Compared with the low-quality population, the high-quality population has a higher psychological demand for service products and thus has a higher relative preference for service products. With the improvement in overall population quality, the whole society has a higher production and consumption propensity for service products than for material products, thus promoting the rise in the real proportion of the service industry.
The Effect on the Nominal Proportion of the Service Industry from the Relative Price Effect of Skill Premium
The relative wage of the high-quality population against the low-quality population (i.e., skill premium) can affect the relative price of service products against material products, thus affecting the nominal proportion of the service industry.
When enterprises determine wage levels completely according to the productivity difference between the populations of varying quality, the wage ratio between the high- and low-quality populations is equal to the productivity ratio between them. In this case, there is no skill premium. When the wage ratio between high- and low-quality populations is higher than the productivity ratio between them, skill premium is formed. Under the condition of skill premium, enterprises will attract progressively more high-quality population to produce such products. This implies that high-complexity products in the market will largely be produced by the high-quality population.
The production attributes of service products are different from those of material products; this is primarily manifested by the spatiotemporal consistency between the production and consumption of service products. Compared with material products, it is far more difficult to produce service products using machines. There is a remarkable difference in the difficulty of production by machines instead of high-quality population between high-complexity material products and service products. As a result, the quantity of high-end material products produced by the high-quality population is obviously smaller than the quantity of high-end service products produced by them.
In the market, the quantity of high-end material products produced by the high-quality population is obviously smaller than the quantity of high-end service products produced by them. Hence, with the rise in skill premium, an increasing number of high-complexity products are produced by high-quality population in the market. Furthermore, the quantity of material products produced by high-quality population is rapidly exceeded by the quantity of service products produced by high-quality population. As a result, the average labor cost of all material products in the market is continuously exceeded by that of all service products in the market and thus the service products in the market are of higher relative prices, overall. Finally, the higher relative prices of service products can raise the proportion of services measured in terms of present value, namely, promoting the nominal increase in the proportion of the service industry.
External Accelerator of the Effect of Population Quality on Service Industry Growth
Population quality can affect service industry growth on its own. Through the mediating effect of population quality, other external factors (e.g., income increase and technological progress) can also promote accelerated growth of the service industry. In other words, other external factors can serve as external accelerators while population quality affects service industry growth directly.
First, this study discusses how technological progress affects service industry growth through the agency of population quality. In this study, technological progress is measured in terms of the growth rate of total factor productivity. According to the Brief Introduction to China’s TPI released by Shenzhen TechGlory Intellectual Property Data Technology Co., Ltd., China’s rate of technological progress begins to decline around the Global Financial Crisis 2008 and the downtrend reverses around 2011. From 2012 to 2017, China’s technological progress rate embraces a slightly accelerated growth (For details, visit http://www.sohu.com/a/211585308_572528). On one hand, technological progress facilitates consumption upgrade and expands the scope of services available to people. Such emerging types of services can hardly be self-provided by the masses under the constraint of their comparative advantage (e.g., skill levels), but need to be provided by specialized institutions or organizations (a set of high-quality population) in the market. On the other hand, exogenous technological progress brings about a change in the production structure of services; specifically, among the services consumed by people in the market, more of them will be produced by the high-quality population, whereas less of them will be produced by the low-quality population. In the final analysis, this change in the production structure of services will affect the nominal proportion of services measured in terms of present value through transmission mechanisms like wage-price and even the wage-price spiral.
Second, this study discusses how income levels affect service industry growth through the agency of population quality. According to the WDI data of the World Bank, China’s per-capita GDP reaches $ 4,560 in 2010, indicating that China has formally become an above-average-income country.
In the subsequent six years, China’s per-capita income continued to increase rapidly; from 2011 to 2017, China’s per-capita GDP increased from $ 5,577 to $ 9,281, recording an average annual growth rate of 8.86%. Judging by the experience of developed countries, a per-capita GDP of more than $ 3,000 represents an important turning point at which service consumption begins to grow at an accelerated pace [18]. According to this standard, China should experience accelerated growth of service consumption after 2008. However, the urban-rural dual structure and large wealth gap reduce China’s overall marginal propensity for service consumption. The golden period of service consumption does not arrive until recent years. Under the constraint of comparative advantage, high-complexity services are usually produced by high-quality population in the market. While the realizable consumption demand is constantly expanded to more complex and advanced service products, there is an increasing demand for high-quality population in the market. In the short term, the supply of high-quality population will remain relatively stable. The increasing demand for high-quality population will raise their relative wage against that of the low-quality population, thus raising the skill premium further. This is proved by the fact that China’s skill premium level increases rapidly after 2011. In the long term, under the influence of supply-demand relationship, the increasing demand for high-quality population will ultimately boost the actual supply of high-quality population. As shown in Figure 6, the proportion of the Chinese population with a junior college level or above reaches a historical record of 10.06% in 2011 and then continues to rise (e.g., to 13.33% in 2015). Overall, the income level will strengthen or extend the effect of population quality on service industry growth in different ways (e.g., affecting consumption upgrade, changing the labor structure and raising the skill premium level).
Figure 6: Variation in China's Per-Capita Income Level and Proportion of High-Quality Population from 2000 to 2016
Data Source: The data on per-capita GDP were cited from the WDI database of the World Bank and the data on educational degree were cited from China Statistical Yearbook for the corresponding years
CONCLUSION
This study investigated the statistical manifestation of and realistic correlation among China’s population quality, skill premium and service industry growth. Accordingly, this study finds that the rapid growth of proportion of China’s service industry value-added is concurrent with the rapid improvement in population quality and continuous rise in skill premium and there is a remarkable consistency in the growing trend among them. The realistic correlation between population quality and service industry growth is manifested in two aspects: First, population quality has a direct effect on service industry growth; second, population quality plays a mediating role when external factors (e.g., technological progress and income increase) affect service industry growth. In particular, the mechanism of the direct effect of population quality on service industry growth can be decomposed into four effects (i.e., comparative advantage effect, opportunity cost effect, mental preference effect and relative price effect) of high-quality population. Specifically, the first three effects increase the real proportion of the service industry and the fourth effect increases the nominal proportion of the service industry.
The 19th National Congress of the Communist Party of China drew a conclusion on the change in China’s social principal contradiction and resolved to address the new contradiction by deepening the supply side structural reform. This makes it necessary for China to turn to the development of the service economy. Although China’s service industry has grown at an accelerated pace in recent years, the servitization of China’s economy is only at an initial stage and level. Therefore, it is necessary to speed up the development of the service industry and improve its development quality. In the context of the New Normal, this is an important pathway to transform the pattern of economic development, attain economic restructuring and ensure stable employment. It is also a crucial step in building a high-quality modernized economic development system. In this sense, the unique view of this study on the cause of the accelerated growth of China’s service industry is of great enlightening significance to the policy orientation of development of the service industry. In the new era of socialism with Chinese characteristics, it is imperative to carry out the human-oriented concept of development. Specifically, appropriate measures (e.g., improving the quality of labor and promoting the accelerated unleashing of population quality dividend) must be taken to optimize the industrial structure, promote industrial upgrade and transform China from a service industry giant to a service industry power.
Improving the quality of labor and increasing the proportion of high-quality labor are of great importance to amplifying and strengthening the three effects (e.g., the mental preference, comparative advantage and opportunity cost effects) of high-quality labor. Hence, it is necessary to take three measures. First, it is necessary to correctly understand the connotations of labor quality and how to improve it. Labor quality includes the material productivity and humanistic literacy of labor. Improvement in the humanistic literacy can boost labor’s cognitive ability and spiritual level, thus strengthening the consumption and production propensity of the whole society for service products and increasing the real proportion of the service industry. Second, it is necessary to raise the popularizing rate of higher education and attach importance to higher vocational education. Although the proportion of China’s high-quality population has increased rapidly since the expansion of college enrolment in 1999, the proportion of the Chinese population with a junior college level or above is only 12.94% by the end of 2016 (This is calculated according to the “composition of Chinese population aged 6 or above by educational degree” in China Statistical Yearbook 2017). By contrast, in the US, which has a highly developed service industry, this figure was higher than 40% as early as in 2012 (Data source: Education at a Glance 2012 released by the OECD). In addition, it is necessary to attach importance to higher vocational education, which provides an important pathway to cultivate skilled and technical talents and closely links higher education with working skills. Third, it is necessary to introduce the concept of “human capital” to industrial development policies and promote accelerated development of the service industry. Because of the special nature of services, human capital plays a critical role in the development of the service industry. Hence, it is necessary to deepen the understanding of human capital, introduce the concept of “human capital” to industrial development policies and allow an accelerated human capital depreciation policy in the human-capital-intensive service industry, thus accelerating the recouping of investment in human capital.
Considering the space constraint of this paper, a separate paper will be written to further investigate the mechanism on how high population quality promotes service industry growth, as well as testing the mediating role of high population quality in promoting service industry growth using modern measuring techniques. In addition, this study has two limitations. First, it failed to quantitatively analyze the four direct effects of population quality on service industry growth based on statistical data, thus judging the difference in proportion and magnitude between the real growth and nominal growth of China’s service industry. This is because of two reasons: (1) There is a dearth of statistical data about micro behaviors in China, the related data are difficult to acquire and there is a dramatic divergence of opinion in academia regarding the measuring indices of related variables; (2) the four effects of population quality are closely connected and even concurrent with each other, so it is very difficult to quantitatively discriminate them from each other clearly. Therefore, the quantitative analysis of the four effects is yet to be further studied. Second, the mediating effect of population quality is not measured quantitatively. After all, it is difficult to cover all factors that affect service industry growth through the agency of population quality.
REFERENCE
Cai, F. “After the population dividend disappears.” Western Forum, no. 12, 2010, pp. 17–19.
Baumol, W.J. “Macroeconomics of unbalanced growth: The anatomy of the urban crises.” American Economic Review, vol. 57, no. 3, 1967, pp. 415–426.
Xiao, W. et al. “A paradox in the development of china’s service industry: Study of the two-stage development pattern.” Economist, no. 7, 2012, pp. 88–95.
Zhang, Y.Y. et al. “Elasticity of substitution, labor flow and ceiling effect in china’s service industry: Study based on an unbalanced growth model.” Finance and Trade Economics, no. 3, 2012, pp. 103–111.
Li, G. et al. “Direction and path of china’s industrial upgrade: Is the proportion of China’s secondary industry to GDP extremely high?” China Industrial Economics, no. 10, 2011, pp. 16–26.
Han, C.L. et al. “China’s service industry growth and retest of the baumol–fuchs hypothesis: Empirical study based on inter-provincial panel data.” Journal of Harbin University of Commerce (Social Sciences), no. 2, 2019, pp. 76–88.
Cheng, D.Z. “Is there a cost disease in China’s service industry?” Finance and Trade Economics, no. 12, 2008, pp. 109–115, 141.
Zhang, Y.Y. et al. “Development of service industry and analysis of structural slowdown: How to build a modernized economic system with high-quality development.” Economic Perspectives, no. 2, 2018, pp. 23–35.
Pang, R.Z. et al. “Is the productivity of service industry indeed low?” Economic Research Journal, vol. 49, no. 12, 2014, pp. 86–99.
Jiang, X.J. “Resource reorganization and service industry growth in a highly connected society.” Economic Research Journal, vol. 52, no. 3, 2017, pp. 4–17.
Zhang, Y.Y. et al. “Has Chinese economy entered the stage of structural slowdown?” Economist, no. 5, 2017, pp. 44–49.
Zhang, Y.Y. et al. “Cause of economy servicizing in developed countries and development of China’s Service Industry.” Finance and Economics, no. 10, 2012, pp. 92–99.
Zhang, Y.Y. “Paradox in mutual promotion of China’s industries: From the perspective of separation between domestic correlation and overall correlation.” China Industrial Economics, no. 10, 2014, pp. 46–58.
Jiang, X. Study of Evolution and Influencing Factors of China’s Skill Premium. Central University of Finance and Economics, 2015. Dissertation.
Song, D.L. et al. “Is there skill-biased technical change: Empirical evidence from China.” Economic Research Journal, vol. 45, no. 5, 2010, pp. 68–81.
Lu, X.Q. et al. “Biased technical change, skill structure and premium reversion: Empirical study based on China’s provincial panel data.” China Industrial Economics, no. 10, 2013, pp. 18–30.
Buera, F.J. et al. “The rise of the service economy.” American Economic Review, vol. 102, no. 6, 2012, pp. 2540–2569.
Zhang, Y.X. et al. “International experience and enlightenment of structural upgrade of service consumption.” Chongqing Social Science, no. 11, 2011, pp. 54–64.
Recommended Articles
Research Article
Developing Social Media Marketing Visual Contents to Increase Engagement Rate (A Case Study of Healthy Tails Animal Clinic in Malang City)
Aditya Nirwana,
...
Felicia Joscelind Verrel
Published: 20/11/2022
Download PDF
Research Article
Longitudinal Research into the History of Debts
Kathleen Okafor
Published: 20/03/2022
Download PDF
Research Article
Responsibility Accounting in Food Enterprises – A Case Study at Kinh do Holdings Company Limited
Thi Ngoc Lan,
...
Ta Thi Thuy Hang
Published: 08/07/2023
Download PDF
Research Article
The Determinants of the Financial Behaviour of SMEs: Empirical Evidence from an Emerging Economy
Santiago Hernandez,
...
Remo Roscigno
Published: 20/03/2022
Download PDF
PO Box 101, Nakuru
Kenya.
Email: office@iarconsortium.org
Editorial Office:
J.L Bhavan, Near Radison Blu Hotel,
Jalukbari, Guwahati-India
Zong, W., Zhang, Y. & Dong, Q. (2021). Population Quality, Skill Premium and Service Industry Growth. IAR Journal of Business Management, 2(2), 1-11.
MLA
Zong, Wen, Yueyou Zhang and Qichang Dong. "Population Quality, Skill Premium and Service Industry Growth." IAR Journal of Business Management 2.2 (2021): 1-11.
Chicago
Zong, Wen, Yueyou Zhang and Qichang Dong. "Population Quality, Skill Premium and Service Industry Growth." IAR Journal of Business Management 2, no. 2 (2021): 1-11.
Harvard
Zong, W., Zhang, Y. and Dong, Q. (2021) 'Population Quality, Skill Premium and Service Industry Growth' IAR Journal of Business Management 2(2), pp. 1-11.
Vancouver
Zong W, Zhang Y, Dong Q. Population Quality, Skill Premium and Service Industry Growth. IAR Journal of Business Management. 2021 Jul;2(2):1-11.



 Download PDF
 Download XML