Background: The present study was done to correlate between S. PSA levels and SUV max on 68Ga PSMA PET/CT in Prostate Cancer Patients. Materials and Methods: Forty-four patients with suspected PCa on clinical assessment and/or raised serum PSA levels (>4ng/ml) were prospectively recruited. Patient who underwent prostatic biopsy prior to 68Ga-PSMA PET/CT and mp MRI, deranged renal function tests or coagulogram and refused consent were excluded. Forty-four patients underwent 68Ga-PSMA PET/CT and 33 patients underwent biopsy. Any focal tracer uptake on 68Ga-PSMA PET/CT was regarded as pathological. Histopathology was taken as gold standard. Results: Mean age of patients was 66.61±9.3 years. Malignancy was detected in 16/33 (48.5%) patients who underwent biopsy. In 17/33 (51.5%), no evidence of malignancy was noted. The median and IQR (interquartile range) of S. PSA levels in this group of 33 patients was 13.4±13.9ng/ml. The median and IQR of the SUVmax was 7.5 and 12.85. On statistically evaluation, no significant correlation was observed between S. PSA and SUVmax (r = 0.316, p = 0.073). Conclusions: The present study concluded that there was no significant correlation was observed between S. PSA and SUVmax in prostate cancer patients.
Keywords
Correlation
S. PSA Levels
SUVmax
68Ga PSMA PET/CT
Prostate Cancer Patients
INTRODUCTION
68Ga PSMA PET/CT is a relatively new hybrid functional imaging modality which has been extensively used in PCa in the last decade. The basis of 68Ga PSMA PET/CT is targeting of PSMA receptors which are over expressed (100-1000x) in PCa as compared to normal prostate cells. Initial studies on bio distribution of 68Ga PSMA PET/CT reported tracer uptake (PSMA expression) in normal prostate as measured by SUVmax [1-4].
The reported SUVmax values in a normal prostate ranged from 2.5-8.8. 68Ga PSMA PET/CT has shown encouraging results in staging, restaging, response assessment and evaluation of biochemical recurrence in PCa [5-7].
Higher serum Prostate Specific Antigen (PSA) levels are indicative of high suspicion of PCa. Screening using serum PSA levels helps in early detection of PCa but it can be false positive in prostatitis and non-cancer related benign prostatic hypertrophy. Reported sensitivity and specificity of serum PSA is 86% and 33%, respectively [8,9].
The measurement of SUVmax values of lesions in 68Ga-PSMA PET/CT provides information of proliferative cellular activity and cellularity in the tumor, as well as a reflection of the general tumor response to treatment. The SUVmax evaluated by PET/CT may reflect the clinical condition in patients with prostate carcinoma and possibly correlate with PSA levels [10].
Aims and Objectives
To correlate between S. PSA levels and SUVmax on 68Ga PSMA PET/CT in Prostate Cancer Patients
MATERIALS AND METHODS
Study Design
Prospective pilot study.
Place of Study
This study has been conducted at the Department of Nuclear Medicine, PGIMER Chandigarh in collaboration with the Department Urology, Radiodiagnosis and Histopathology, PGIMER, Chandigarh.
Period of Study
The study was done during the period between January, 2018 and June, 2019.
Inclusion Criteria
Patients having suspicion of carcinoma prostate on clinical assessment and/or raised serum PSA levels(>4ng/ml)
Patient not suffering from bleeding diathesis or renal failure
Patient consent to participate in the study
Exclusion Criteria
Patient with prior diagnosed PCa or who underwent prostatic biopsy priorto68Ga-PSMA PET/CT and mpMRI
Patients with deranged renal function tests orcoagulogram
Patient refused to participate in the study
Study Population
A total of 44patients suspected for PCa on the basis of clinical assessment and/or raised PSA were recruited for the study.
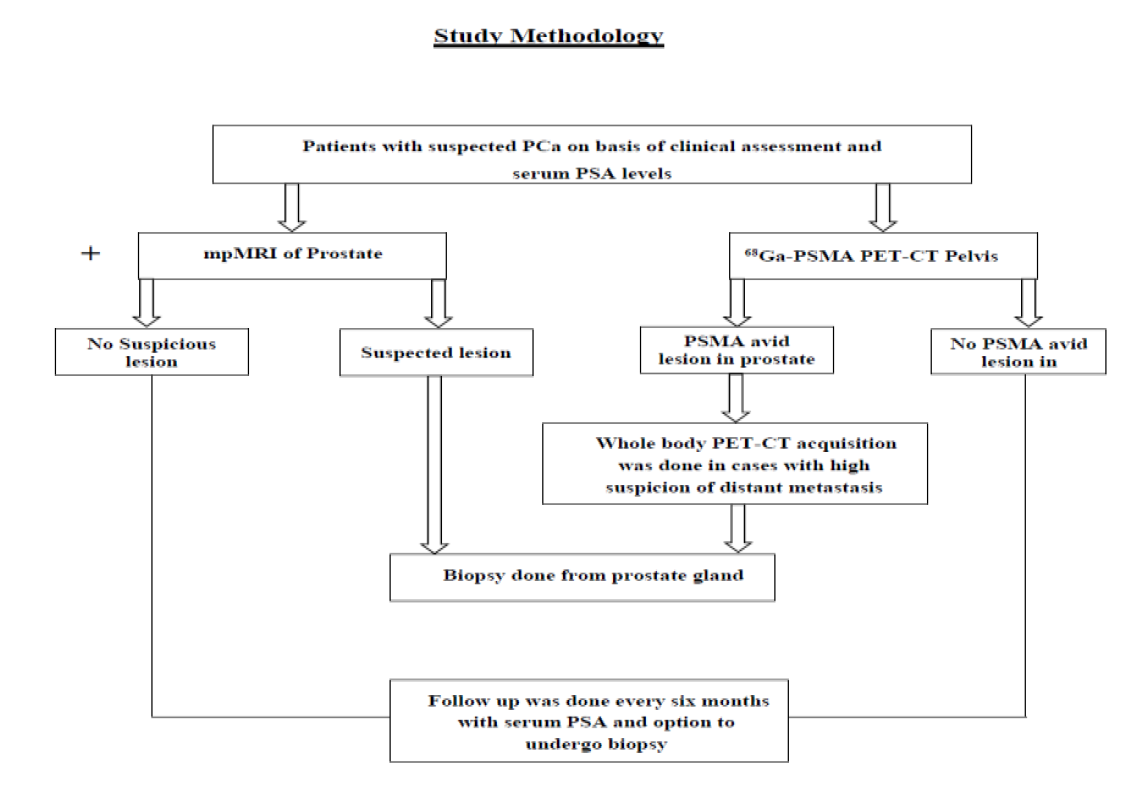
Patients suspected for prostate adenocarcinoma and/or serum PSA levels >4ng/mL and willing to participate in the study were recruited. Study was approved by Institutional Ethics Committee, PGIMER Chandigarh. Written informed consent was obtained. After clinical assessment, mpMRI and68Ga-PSMA PET/CT were done. Biopsy was done in cases with high clinical suspicion of PCa.
Figure 1: Study Methodology
Statistical Analysis
Qualitative variables are described using number and percentages. Normally distributed continuous quantitative data is described using mean and standard deviation. Skewed quantitative data is described using median and interquartile range. The normality of data will be checked by measures of Kolmogorov-Smirnov tests of normality. To see correlation between different variables, Pearson or Spearman correlation coefficient was calculated, depending on data being analyzed. The statistical analysis was conducted using the IBM SPSS STATISTICS (version 23.0).
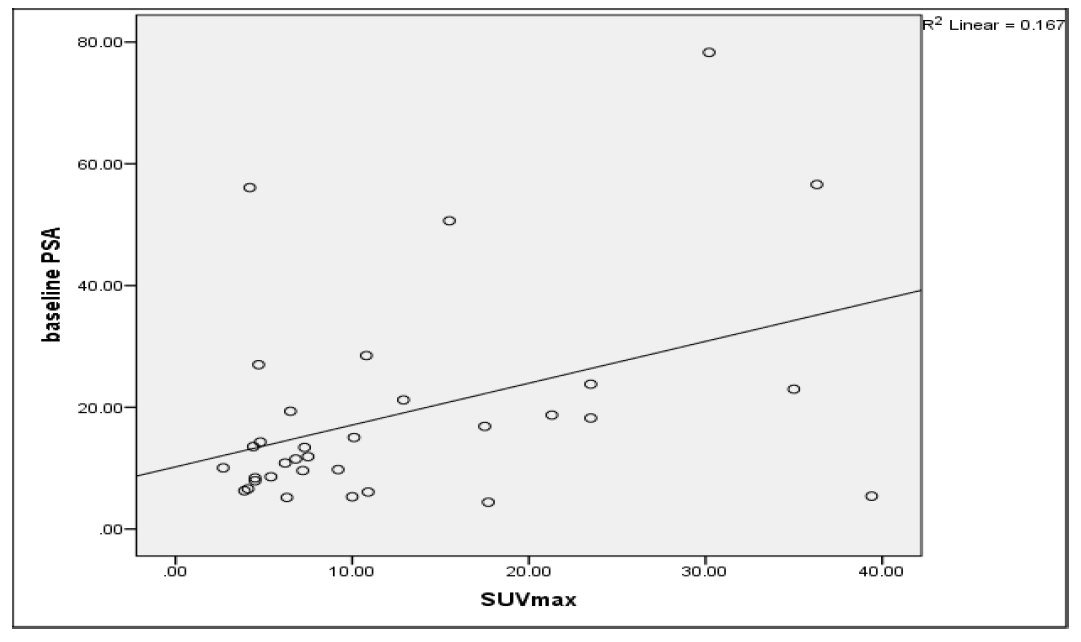
Figure 2: Scatter plot between SUVmax (standardized uptake value maximum, x-axis) and PSA (serum prostate specific antigen, y axis)
RESULTS
In this prospective study, a total of 44 patients suspected to have PCa were recruited on the basis of clinical assessment and serum PSA levels. Out of the total 44 patients, 33 patients with complaints of LUTS or raised serum PSA levels underwent biopsy. All these patients were also subjected to 68Ga-PSMA PET/CT acquisition and SUVmaxof the lesions were measured for quantitation.
The median and IQR (interquartile range) of S. PSA levels in this group of 33 patients was 13.4±13.9ng/mL. The median and IQR of the SUVmax was 7.5 and 12.85. On statistically evaluation, no significant correlation was observed between S. PSA and SUVmax (r = 0.316, p = 0.073). Figure 2 shows the scatter plot of PSA levels and SUVmax values.
DISCUSSION
The higher the SUVmax levels, the greater the likelihood of neoplastic disease. Therefore, if a high PSA value predicts a higher SUVmax, it is good to know which patients are more likely to have metastases and which patients benefit from a 68Ga-PSMA PET/CT scan.
In our study, on statistically evaluation, no significant correlation was observed between S. PSA and SUVmax (r = 0.316, p = 0.073). but opposite to our study, a positive correlation was shown between the PSA blood levels and SUVmax values of 68Ga-PSMA PET/CT in prostate carcinoma lesions (r = 0.47; p = 0.01) in the study done by Erika S. Fajardo-Ordóñez et al. [10].
CONCLUSION
The present study concluded that there was no significant correlation was observed between S. PSA and SUVmax in prostate cancer patients.
REFERENCES
Von Eyben, F.E. et al. “68Ga-Labeled prostate-specific membrane antigen ligand positron emission tomography/computed tomography for prostate cancer: A systematic review and meta-analysis.” European Urology Focus, vol. 4, no. 5, 2018, pp. 686–693.
Zhang, J. et al. “Diagnostic performance of 68Ga-PSMA PET/CT in the detection of prostate cancer prior to initial biopsy: Comparison with cancer-predicting nomograms.” European Journal of Nuclear Medicine and Molecular Imaging, vol. 46, no. 4, 2019, pp. 908–920.
Bray, F. et al. “Global cancer statistics 2018: GLOBOCAN estimates of incidence and mortality worldwide for 36 cancers in 185 countries.” CA: A Cancer Journal for Clinicians, vol. 68, no. 6, 2018, pp. 394–424.
Alizadeh, M. and S. Alizadeh. “Survey of clinical and pathological characteristics and outcomes of patients with prostate cancer.” Global Journal of Health Science, vol. 6, no. 7, 2014, pp. 49–57.
Bancroft, E.K. et al. “Targeted prostate cancer screening in BRCA1 and BRCA2 mutation carriers: Results from the initial screening round of the IMPACT study.” European Urology, vol. 66, no. 3, 2014, pp. 489–499.
Uprimny, C. et al. “68Ga-PSMA-11 PET/CT in primary staging of prostate cancer: PSA and Gleason score predict the intensity of tracer accumulation in the primary tumor.” European Journal of Nuclear Medicine and Molecular Imaging, vol. 44, no. 6, 2017, pp. 941–949.
Demirci, E. et al. “Normal distribution pattern and physiological variants of 68Ga-PSMA-11 PET/CT Imaging.” Nuclear Medicine Communications, vol. 37, no. 11, 2016, pp. 1169–1179.
Bax, C. et al. “Innovative Diagnostic Methods for Early Prostate Cancer Detection through Urine Analysis: A Review.” Cancers, vol. 10, no. 4, 2018, p. 123.
Hoffman, R.M. et al. “Prostate-Specific antigen testing accuracy in community practice.” BMC Family Practice, vol. 3, no. 1, 2002, p. 19.
Fajardo-Ordóñez, E.S. et al. “Correlación entre los Niveles de Antígeno Prostático Específico y los Valores de SUVmáx en Pacientes con Cáncer de Próstata Evaluados con 68Ga-PSMA PET/CT.” Revista de Medicina del Instituto Mexicano del Seguro Social, vol. 19, no. 4, 2020, pp. 286–296.
Recommended Articles
Research Article
A Descriptive Cross-Sectional Study to Evaluate the Knowledge about Symptoms and Risk Factors for Heart Attack (Myocardial Infarction) Among the General Population of New Delhi
Aastha Sehgal,
...
Avneet Kaur
Published: 06/05/2023
Download PDF
Research Article
Evidence Guided, Experience Based and Patient Compatible 3-Step Protocol for Managing Moderate to Severe Category of COVID19 Infections
Farah Husain,
...
Kirti N Saxena
Published: 05/01/2021
Download PDF
Research Article
Knowledge About Risk and Preventive Factors for Osteoarthritis Knee among Ortho OPD Patients in Regional Hospital, Keylong in District Lahaul and Spiti of Himachal Pradesh
Ajay Thakur,
Jaspal Chaudhary
Published: 20/06/2022
Download PDF
Research Article
A Randomized Controlled Trial Comparing the Effect of Oral Preemptive Pregabalin Compared to IV Lignocaine in Attenuating Hemodynamic Response to Laryngoscopy
P. Aashik,
...
B.N. Reddy
Published: 17/05/2023
Download PDF
PO Box 101, Nakuru
Kenya.
Email: office@iarconsortium.org
Editorial Office:
J.L Bhavan, Near Radison Blu Hotel,
Jalukbari, Guwahati-India
Sharma, V., Guleria, K. S. D. S. & Chadha, R. (2022). Correlation Between S. PSA Levels and SUV max on 68Ga PSMA PET/CT in Prostate Cancer Patients. IAR Journal of Anaesthesiology and Critical Care, 3(2), 1-3.
MLA
Sharma, Viper, Kunwar S. D. S. Guleria and Rishabh Chadha. "Correlation Between S. PSA Levels and SUV max on 68Ga PSMA PET/CT in Prostate Cancer Patients." IAR Journal of Anaesthesiology and Critical Care 3.2 (2022): 1-3.
Chicago
Sharma, Viper, Kunwar S. D. S. Guleria and Rishabh Chadha. "Correlation Between S. PSA Levels and SUV max on 68Ga PSMA PET/CT in Prostate Cancer Patients." IAR Journal of Anaesthesiology and Critical Care 3, no. 2 (2022): 1-3.
Harvard
Sharma, V., Guleria, K. S. D. S. and Chadha, R. (2022) 'Correlation Between S. PSA Levels and SUV max on 68Ga PSMA PET/CT in Prostate Cancer Patients' IAR Journal of Anaesthesiology and Critical Care 3(2), pp. 1-3.
Vancouver
Sharma V, Guleria KSDS, Chadha R. Correlation Between S. PSA Levels and SUV max on 68Ga PSMA PET/CT in Prostate Cancer Patients. IAR Journal of Anaesthesiology and Critical Care. 2022 Jul;3(2):1-3.


 Download PDF
 Download XML