+91 6002993949
submission@iarconsortium.org
Open Access
ISSN (Print) : 2709-3301
ISSN (Online) : 2709-331X
Oil waste has been noted to be pollutant in the Belawan Fisheries Port of Indonesia. This research was conducted in the administrative area of the Nusantara Belawan Fisheries Port as a place to dock and get out or enter fishing boats from and to the sea. Seeking the effect of oil waste and other physical-chemical parameters of water on the diversity of plankton in the waters of the Nusantara Belawan Fisheries Port in two ways: First, the data were analyzed partially using simple regression analysis. Second, data are analyzed simultaneously by using multiple regression analysis stages. Data obtained showed that the water brightness gives a positive effect on planktonic diversity at the Fishing Port reached 84.70%. Dissolved oxygen gives a positive effect on planktonic diversity at the Fishing Port 91, 56%. Oil waste level on the water gives a negative effect on the planktonic diversity at the Fishing Port reached 94.61%. The result of simultaneously data analysis of parameters such as water brightness, dissolved oxygen, and oil waste level on the water give a negative effect on planktonic diversity at the Fishing Port about 97.89%.
The utilization of natural resources and living environment must be managed in prudential and integrated ways. It is under the outline of state policy 1993 which states that natural resources on land, sea, and air are managed and utilized while maintaining the sustainability of adequate environmental functions to give benefits for the greatest prosperity of the people, both the present and future generations. according to law no. 32 in 2009 about the protection and management of the living environment, living environment is the unity of places within the things, power, condition, and living things, including human and its behaviours, which influences nature itself, sustainable life, and human's welfare and also other living things [1].
Many human's activities in sea transportation, agriculture, and also industry recently are performed in the coastal area. Ecologically, the activities can create damages to natural resources and the environment which decrease the quality of the environment of the coastal area if it is not under control. The coastal region has a function as a provider of natural resources, providers of life support services, providers of convenience services and as recipients of waste from development activities found in the upper land (land area) such as settlement activities of trade, fisheries, and industrial activities. Natural resources found in coastal areas are the estuary ecosystem, mangrove ecosystems, coral reef ecosystems, seagrass ecosystems and ecosystems of small islands; which has ecological and economic functions for the sustainability of coastal areas in the future [2].
Each activity creates different benefits seen from the economical aspect. Its effect on the environment will also be different because of the different inputs given. Activities and treatments for momentary interest often create negative effects on the condition of natural resources and the environment, especially for a long-term period. The activities can create changes in the component parameter of the coastal area which can change the future of the ecological order of the coastal ecosystem. Geographically, the Ocean Fishing Port of Belawan is located in Bagan Deli Belawan District, Second Level of Municipality of Medan. The distance is about 24 km from Medan City (located in the north of Medan City) and dealing with the Strait of Malacca which is one of the world's busiest shipping routes.
Indonesia has followed the rules and policies in the Law and also MARPOL 73/78 to prevent sea pollution caused by the activities through the Decree of the Minister of Transportation No. 86/1990 which states that every ship operated on the sea must be equipped with a tool to prevent pollution such as Oil Water Separator (OWS) for those with at least or more than 100 Groose in its weight [3].
However, the government policy CQ. Directorate General of Sea Transportation obligates that every ship with a weight of at least or more than 100 Groose or uses a machine with at least 200 PaardKracht (PK) and provides waste containers must have an Exemption Certificate. The certificate is given based on technical considerations. For example, the implementation of preventive tools for pollution cannot be implemented due to the less room in the ship because the ship was made before the policy implemented.
Although the function of the conservation of the sea environment is needed, the condition of the environment has started partially polluted. It can be seen from the decrease of the fish caught by fishermen and shrimp ponds. The decreases are caused by the death of fish and shrimp seeds and the migration of the seeds and fish or shrimp to other places. It will also threaten the mangrove forest along the coastal area of the Port of Belawan. (Fisheries Service). The causes of the damage to the sea environment are predicted because of the pollution of oil waste of the activity of fisherman's ships which are not obligated to provide the preventive tools of oil waste pollution. According to Fardiaz, oil waste on the water comes from many sources such as the cleaning and washing process of the ships or vessels on the sea, the combustion of the residual oil spill, oil drilling near or offshore, and leakage of the ship or vessels, etc [3].
Meanwhile, the negative effect raised from oil waste according to Wardhana, is that the oily layer in the sea will interfere with the living organisms in the sea [4]. Oxygen diffusion from the air into the sea and also the sunrise will be blocked by the oily layer which harms the biotic component of the water ecosystem. Based on the description above, research needs to be performed to know the effect of oil waste from ships on planktonic diversity at Ocean Fishing Port of Belawan, North Sumatra Province.
This research is done in the administration area of Ocean Fishing Port of Belawan as a place for ships anchored and sailed:
Each observation station determined is stated to be three sample point areas, both vertically (0 metres in depth) and horizontally (the limitation of light penetration in each sample point in depth) by using Belt Transek/Line Strip Method, whereas the sample point areas are made and positioned in line with the coastal line. In every sample point, plankton samplings were done at 2 depths, 0 metres (water surface) and depth of the limitation of light penetration in each sample point, using a bottle water sample to make the data of plankton more representative. The water sample taken is about 5 litres. The water then is filtered using net plankton no. 25 and placed in bottles with volume ± 20 ml. Because the sample obtained is not directly observed, the sample is preserved using formalin 4% about 6 drops in each bottle.
Furthermore, the observation to measure the biological parameter of plankton (phytoplankton and zooplankton) is done at the biological laboratory of FMIPA USU. The analysis activities in the laboratory consist of sample observation using a microscope and identification. The water sample to be observed must be shaken first until homogenous, then taken using a pipette and dropped on the Haemocytometer surface and the covered using cover glass. After being observed, plankton obtained are counted in a zigzag way, then identified using Edmonsond's formula [5] and Pennak R.W’s [6]. The identified planktons are counted its abundance using the
Table 1: Parameters, Methods, Tools and Location of Analysis
Parameter | Method and Measuring Instrument | Location |
Physics: Temperature Brightness ( Suspended solids |
Potentiometer, Thermometer Visual (secchi chip) Elektronic scales |
Insitu Insitu Labor |
Chemical: Salinity pH Dissolved oxygen BOD COD Nitrite Nitrate Ortho Phosphate Oil |
Salinometer Potentiometer (pH meter), Indicate paper Potentiometer (DO Meter) Potentiometer Titrimetriy, Potassium bichromate Nessler, Spectrophotometer Colouring (Bricine), Spectrophotometer Coloration (SnCl2), Spectrophotometer Oil Analyzer |
Insitu Insitu Labor Labor Labor Labor Labor Labor Labor |
Biology: Plankton Diversity | Haemocitometer, microscope Microscopy, identification | Labor |
planktonic abundance formula as stated in data analysis. The measured parameter and method or measurement tool used and also the location is stated in the Table 1.
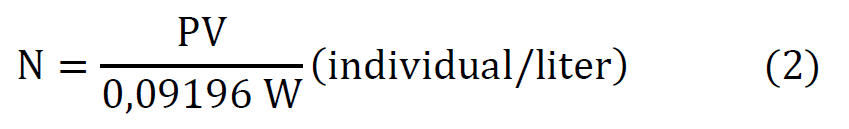
To analyze the abundance of plankton, the number of identified plankton per litre is counted using Haemocytometer and modification formula by Isnansetyo and Kurniastuty [7]:
Which:
N : number of plankton per litre
T : cross-sectional area of Haemocytometer (mm2)
L : one-field view area.
P : number of plankter chopped
p : number of fields observed
V : volume of plankton concentration in the bucket (ml)
v : volume of concentrate under the cover glass.
W : volume of media water filtered using plankton net (L)
Because most of the formula elements have been known by Haemocytometer, which is T = 196 mm2 and v = 0,0196 ml (19,6 mm3) and one-field view area of Haemocytometer equals with the result of the multiplication between one-field view area (L) and the number of plankters chopped (P), the formula becomes:
Furthermore, the calculation result of Relative Density (RD) of Krebs's [8], below can be used to know the existence of plankton in every observation station at Ocean Fishing Port of Belawan, North Sumatra Province.

Relative Frequency (RF) of Michael below is used to know the plankton in every observation station in the area.
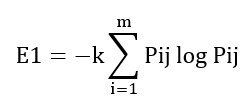
Michael groups the percentage of frequency into 5 classes: class A = 1 – 20%, class B = 21 – 40%, class C = 41 – 60%, class D = 61 – 80%, and class E = 81 – 100% [9]. Class A to D are the uniform distribution (heterogeneous) and class E is not uniform distribution (homogenous). Shounon Wiener Index (H) in Krebs below is used to know the diversity level of plankton in every observation station at the Fishing Port.
Which:
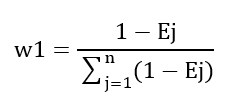
Uniformity Index (E) by Krebs analysis below is used to know the uniformity of the number of individual plankton for every genus in every observation station in the area.
The value of the Uniformity index is between 0 and 1. The lower the value E, the lower uniformity of a population, which means that the distribution of several individuals for every genus is not equal and also there is a trend of a genus dominating the population. On the contrary, the higher the value E, the uniformity of population will be shown, which is the number of individual for every genus prevalent or equal [10]. Moreover, under the hypothesis formula in this research, the data needed to test the truth of the hypothesis is the data of measurement result from physical and chemical parameters of water including ship's oil waste content, temperature, brightness, suspended solids, salinity, pH, dissolved oxygen, BOD, COD, Nitrite, Nitrate, and O-phosphate on the water which become independent variables. Meanwhile, the data of the diversity index of plankton becomes a dependent variable.
The Result of Measurement of Physical and Chemical Parameters of Water at Ocean Fishing Port of Belawan, North Sumatra Province
The measurement result of a physical and chemical parameter of water measured from the three observation stations for two periods, falling tide and rising tide periods, can be seen in Table 2.
Table 2. Results of Measurement of Physical and Chemical Water Parameters in the Belawan Archipelago Fisheries Port Area
No | Parameter | Falling Tide | Rising Tide | ||||
St. 1 | St. 2 | St. 3 | St. 1 | St. 2 | St. 3 | ||
| Physics: |
|
|
|
|
|
|
1. | Temperature (ºC) | 29 | 31 | 30 | 28,5 | 30 | 28 |
2. | Brightness (Cm) | 70 | 42 | 90 | 79 | 50 | 102 |
3. | TSS (mg/I) | 98 | 161,5 | 97,5 | 92,5 | 157,5 | 132,5 |
| Chemical: |
|
|
|
|
|
|
4. | Salinity (%ο) | 25 | 23 | 23,5 | 26 | 24 | 24 |
5. | pH | 7,10 | 6,85 | 6,78 | 7,00 | 7,30 | 7,55 |
6. | DO (mg/I) | 6,4 | 4,4 | 7,5 | 7,0 | 6,2 | 7,5 |
7. | BOD (mg/I) | 2,0 | 10,1 | 30,10 | 3,5 | 4,9 | 2,8 |
8. | COD (mg/I) | 140 | 326 | 167 | 198 | 396 | 198 |
9. | Nitrite (mg/I) | tt | Tt | 0,05 | 0,74 | 0,94 | 1,22 |
10. | Nitrate (mg/I) | 0,05 | 0,15 | 0,25 | 0,84 | 0,32 | 1,45 |
11. | O-phosphat (mg/I) | 0,50 | 2,70 | 2,60 | 19,99 | 18,21 | 19,99 |
12. | Petroleum (mg/I) | 5,95 | 9,74 | 4,01 | 5,82 | 6,05 | 4,30 |
Information: St. 1 = Ship Line Station, St. 2 = Dock Station, St. 3 = Near the Mangrove Forest Station
The Environmental Condition of Physical and Chemical of Water at Ocean Fishing Port of Belawan, North Sumatra Province
The physical and chemical condition of water can illustrate the level and quality of the water environment at a certain period. Environmental Quality Standard can be a reference to know the condition of the water at each observation station. It can be seen in Table 3.
Table 3: The Condition of Physical and Chemical Water Environment at Ocean Fishing Port of Belawan, North Sumatra Province
No | Parameter | Falling Tide | Rising Tide | Quality Standard | Note | |||||
St. 1 | St. 2 | St. 3 | St. 1 | St. 2 | St. 3 | Permitted | Desired | |||
| Physics: |
|
|
|
|
|
|
|
|
|
1. | Temperature (ºC) | 29 | 31 | 30 | 28,5 | 30 | 28 | Natural | Natural |
|
2. | Brightness (m) | 70 | 42 | 90 | 79 | 50 | 102 | ≥3 | ≥5 |
|
3. | T S S (mg/I) | 98 | 161,5 | 97,5 | 92,5 | 157,5 | 132,5 | ≤80 | ≤25 |
|
| Chemistry: |
|
|
|
|
|
|
|
|
|
4. | Salinity (%ο) | 25 | 23 | 23,5 | 26 | 24 | 24 | Natural | Natural |
|
5. | pH | 7,10 | 6,85 | 6,78 | 7,00 | 7,30 | 7,55 | 6 - 9 | 6,5 – 8.5 |
|
6. | DO (mg/I) | 6,4 | 4,4 | 7,5 | 7,0 | 6,2 | 7,5 | >4 |
|
|
7. | BOD (mg/I) | 2,0 | 10,1 | 30,10 | 3,5 | 4,9 | 2,8 | ≤45 | ≤25 |
|
8. | COD (mg/I) | 140 | 326 | 167 | 198 | 396 | 198 | ≤80 | ≤40 |
|
9. | Nitrite (mg/I) | tt | tt | 0,05 | 0,74 | 0,94 | 1,22 | Nihil | Nihil |
|
10. | Nitrata (mg/I) | 0,05 | 0,15 | 0,25 | 0,84 | 0,32 | 1,45 | - | - | Not mentioned |
11. | O-Phosphate (mg/I) | 0,50 | 2,70 | 2,60 | 19,99 | 18,21 | 19,99 | - | - | Not mentioned |
12. | Crude oil (mg/I) | 5,95 | 9,74 | 4,01 | 5,82 | 6,05 | 4,30 | ≤5 | Nihil |
|
Based on the measurement result of 12 physical and chemical parameters of water at Ocean Fishing Port of Belawan, North Sumatra Province, it is found that generally the condition of the water at the Fishing Port has been polluted by waste, primarily oil waste from ships. So, the water is not appropriate anymore to be exploited as a place for aquaculture (marine biota) although the water physically is shallow because the measurement results of the brightness, DO, COD, Nitrite and Crude Oil parameters are not appropriate with Environmental Quality Standard.
The Composition and Number of Individual Plankton
Based on the observation toward plankton done at the Fishing Port on each sample point in every observation station at the falling tide period, the composition and number of individual plankton based on class found can be seen in Table 4.
Table 4 above shows that the composition and the number of individual plankton on the falling tide period at the ship station are 6 classes: 4 classes for phytoplankton and 2 classes for zooplankton. They consist of Bacillariophyceae class as many as 8.160 individuals per litre, Chlorophyceae class 6.732, Cyanophyceae class 408, Xanthophyceae class 204, Euglenaphyceae class 204, and Entomostraca class 204. At the station near the dock lie four classes of plankton consisting of 2 classes of phytoplankton and 2 classes of zooplankton containing Bacillariophyceae class as many as 2040 individuals per litre, Chlorophyceae class 6528, Euglenaphyceae class 612, and Mastigophora class 204.
Table 4:Composition And Number Of Individual Plankton (Per Liter) Based On Class At Each Sample Point Of Each Station In The Tidal Period In The Ppn – Belawan Aquatic Area.
No | Class | Ship Line Station | Sum | Dock Station | Sum | Near the Mangrove Forest Station | Sum | ||||||
Ts. I | Ts. II | Ts. III | Ts. I | Ts. II | Ts. III | Ts. I | Ts. II | Ts. III | |||||
1. 2. 3. 4.
5. 6. 7. | Phytoplankton Bacillariophyceae Chlorophyceae Cyanophyceae Xanthophyceae Zooplankton Euglenaphyceae Entomostraca Mastigophora |
|
|
|
|
|
|
|
|
|
|
|
|
3264 | 2040 | 2856 | 8160 | 408 | 408 | 1224 | 2040 | 816 | 1428 | 2040 | 4284 | ||
1632 | 2244 | 2856 | 6732 | 1428 | 2040 | 3060 | 6528 | 1428 | 1632 | 2448 | 5508 | ||
- | 408 | - | 408 | - | - | - | - | 408 | 204 | 612 | 1224 | ||
204 | - | - | 204 | - | - | - | - | - | 204 | 204 | 408 | ||
| |||||||||||||
204 | - | - | 204 | - | 612 | - | 612 | - | - | - | - | ||
204 | - | - | 204 | - | - | - |
| 204 | - |
| 204 | ||
- | - | - | - | 204 | - | - | 204 | - | - | - | - | ||
Number of individuals | 5508 | 4692 | 5712 | 15912 | 2040 | 3060 | 4284 | 9384 | 2856 | 3468 | 5304 | 11628 | |
Class number | 5 | 3 | 2 | 6 | 3 | 3 | 2 | 4 | 4 | 4 | 4 | 5 | |
Information: Ts. I = Sample point I, Ts. II = Sample point II, Ts. III = Sample point III
At the station near the mangrove forest, there are five classes of plankton which consist of 4 classes of phytoplankton and 1 class for zooplankton. It is found abundances for Bacillariophyceae class as many as 428 individuals per litre, Chlorophyceae class 5508, Cyanophyceae class 1224, Xanthophyceae class 408 and Entomostrace class 204. In this period, the highest composition and number of individual plankton are found at the station near the mangrove forest and the lowest is at the station near the dock. Overall, the planktons consist of 7 classes of 11.628 individuals per litre. Moreover, the composition and number of individual plankton based on class found at the rising tide period can be seen in Table 5.
Table 5. Composition And Number Of Individual Plankton (Per Liter) Based On Class At Each Sample Point Of Each Station In The Rising Tide Period In The Ppn – Belawan Aquatic Area.
No | Class | Ship Line Station | Sum | Dock Station | Sum | Near the Mangrove Forest Station | Sum | ||||||
Ts. I | Ts. II | Ts. III | Ts. I | Ts. II | Ts. III | Ts. I | Ts. II | Ts. III | |||||
| Phytoplankton |
|
|
|
|
|
|
|
|
|
|
|
|
1. | Bacillariophyceae | 1224 | 1428 | 2244 | 4896 | 1020 | 408 | 1836 | 3264 | 1020 | 2244 | 1836 | 5100 |
2. | Chlorophyceae | 1632 | 2448 | 2652 | 6732 | 2040 | 2856 | 1836 | 6732 | 1428 | 1428 | 4081 | 6937 |
3. | Cyanophyceae | 204 | - | - | 204 | - | - | - | - | - | - | - | - |
4. | Xanthophyceae | 204 | 204 | 408 | 816 | 408 | 408 | 1020 | 1836 | 408 | 204 | 204 | 816 |
5. | Ciliophora Zooplankton | - | - | - | - | 204 | - | 612 | 816 | - | 612 | - | 612 |
6. | Euglenaphyceae | - | - | 204 | 204 | - | 204 | - | 204 | 1632 | 1836 | 1020 | 4488 |
7. | Entomostraca | - | - | - | - | - | - | 204 | 204 | - | 204 | - | 204 |
8. | Rotary | 204 | 204 | 204 | 612 | - | - | 204 | 204 | - | - | - | - |
9. | Mastigophora | - | - | - | - | - | - | - | - | 612 | - | - | 612 |
10. | Rhizopoda | - | - | 204 | 204 | - | - | - | - | - | - | - | - |
Number of individuals | 3468 | 4284 | 5916 | 13668 | 3672 | 3876 | 5712 | 13260 | 5100 | 6528 | 7141 | 18769 | |
Class number | 5 | 4 | 6 | 7 | 4 | 4 | 6 | 7 | 5 | 6 | 4 | 7 | |
In table 5, it can be seen that 7 classes of plankton consist of 4 classes of phytoplankton and 3 classes of zooplankton found at the rising tide period at the ship line station. Those classes are Bacillariophyceae class with abundance as many as 4896 individuals per litre, Cyanophyceae 204, Xanthophyceae 816, Euglenophyceae 204, Rotaria 612, and Rhizopoda 204. At the station near the dock, there are 7 classes of plankton found, consisting of 4 classes of phytoplankton and 3 classes of zooplankton at the rising tide period. Those classes are Bacillariophyceae with abundance as many as 3264 individuals per litre, Chlorophyceae class 6732, Xanthophyceae 1836, Ciliophora 816, Euglenophyceae 204, Entomostrace 204, and Rotaria 204.
Meanwhile, there are 7 classes of plankton consisting of 4 classes of phytoplankton and 3 classes of zooplankton found at the station near the mangrove forest during the rising tide period. Those classes are Bacillariophyceae with abundances as many as 5100 individuals per litre, Chlorophyceae 6937, Xanthophyceae 816, Ciliophora 612, Euglenophyceae 4488, Entomostraca 204, and Mastigophora 612. It means that the station near mangrove forest has the highest composition and number of an individual which is 7 classes with 18769 individuals per litre. Meanwhile, the station near the dock is the lowest, having 7 classes with 13260 individuals per litre. The dominant class is Chlorophyceae. The composition and number of individual plankton found overall are 10 classes with 45697 individual per litre.
On the falling tide period, the composition and number of plankton genus found at the station at ship line are 18 genera with 15912 individuals per litre each of which originated from sample point I as many as 10 genera with 5508, sample point II 9 genera with 4692, and sample point III 8 genera with 5712. Coscinodiscus is the genus that has the highest number of individuals of the tree observation sample points with 5712 individuals per litre, followed by Netrium with 5100.
Relative Density (RD) and Relative Frequency (RF) of Plankton
The Result of Relative Density (RD) and Relative Frequency (RF) of each genus found that RD values at the station at ship line which are more than 10% are at Cosninodiscus genus 35.8974% and Netrium 32.0513%. Other genera have RD values among 1.2821% to 6.4103%. It means that the genus with the highest appearance at the station is Coscinodiscus. On the station near the dock, RD values which are more than 10% are Netrium genus with 60.8696% and Coscinodiscus 17.3913%. Other genera have RD values among 2.1739% to 4.3478%. It means that the highest appearance found is the Netrium genus.
Relative Density (RD) values above 10% found at the station near mangrove forest are Netrium genus with 35.0877%, Diatom 15.7895%, and Navicula 10.5263%. Other genera have RD values among 1.7544% to 3.5088%. Nitrium is the genus with the highest appearance found in this station. Relative Frequency (RF) values of plankton found at the three stations on the falling tide period range from 33.3333% to 100%. Plankton with the highest RF values found at the station at ship line is 3 genera, Coscinodiscus, Ephitemia, and Netrium with 100% of each, while 15 other genera range from33.3333% to 66.6666%. Planktons found at the station near the dock which has the highest relative frequency are 2 genera, Coscinodiscus and Netrium with 100% of each, while 8 other genera are among 33.3333% to 66.6666%. Planktons which are found at the station near mangrove forest with the highest relative frequency are 3 genera, Netrium, Ephitemia, and Diatom with 100% of each. Meanwhile, 17 other genera are among 33.3333% to 66.6666%.
RD values above 10% of the genus found at the station on the shipping line are Netrium 37.3134% and Coscinodiscus 29.8507%. Other genera have RD values among 1.4925% to 4.4.776%. So, the genus with the highest appearance at this station is Netrium. RD values above 10% of the genus found at the station near the dock are Netrium 38.4615%, Coscinodiscus 16.9231%, and Botrydiopsis 13.8662%. Other genera have RD values among 1.5385% to 9.2308%. So, the genus with the highest appearance at this station is Netrium.
RD value above 10% of genera found at the station near mangrove forest is Netrium 26.0909%, Euglena 20.6511%, and Coscinodiscus 10.8689%. Other genera have RD value among 1.0869% to 4.3476%. So, Netrium is the genus with the highest appearance in this station. The relative frequency (RF) value of plankton found at the three observation stations on the rising tide period ranges from 33.3333% to 100%. Two genera as planktons with the highest appearance, Coscinodiscus and Netrium with 100% of each are found at the station on the shipping line, while 15 other genera have value among 33.3333% to 66.6666%. Four genera of plankton with the highest relative frequency are found at the station near the dock. Those are Coscinodiscus, Netrium, Botrydiopsis, and Mougeotia genera with 100% of each, while 8 other genera have value among 33.333% to 66.6666%. Four genera of plankton with the highest relative frequency, Clamydomonas, Netrium, Coscinodiscus, and Euglena with 100% of each are found at the station near mangrove forest, while 15 genera have a value ranging from 33.3333% to 66.6666%.
Based on the RF values of plankton above found at every observation station, both on a falling tide and rising tide periods at Ocean Fishing Port of Belawan, North Sumatra Province, there is ununiform dissemination of plankton (heterogeneous). Know whether plankton is uniform or ununiform is determined by the percentage of the most number of the genus in every frequency. For this reason, Michael [9] categorizes the percentage of frequency into 5 classes: A = 1 – 20%, B = 21 – 40%, C = 41 – 60%, D = 61 – 80% dan class E = 81 – 100%. Class A to D is categorized as having ununiform dissemination (heterogeneous), while class E uniform. The result of frequency percentage above shows that the number of most genera are in class B to D. It means that plankton dissemination at the area is not uniform (heterogeneous).
Diversity Index (H’) and Uniformity (E) Values of Plankton at Ocean Fishing Port of Belawan, North Sumatra Province
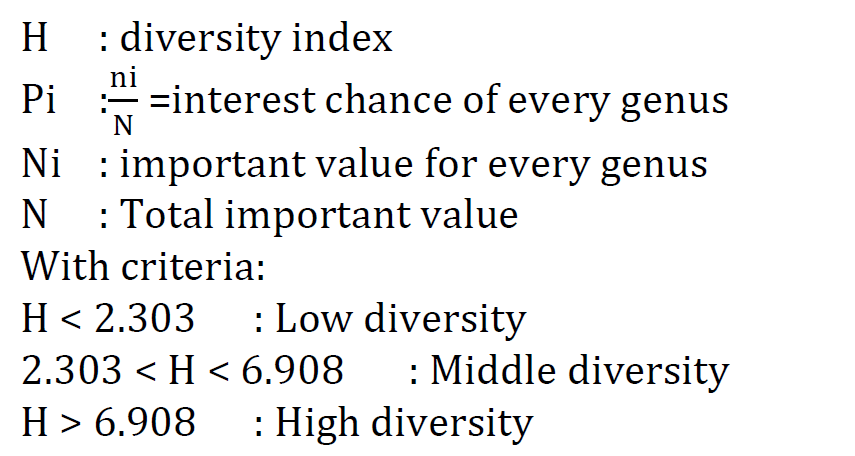
The analysis results of planktonic diversity at three observation stations for two periods, rising tide and falling tide periods obtain the Diversity Index (H') of Plankton. The results of the planktonic diversity index at the falling tide period are around 1.3777 (at the station near the dock) to 2.2616 (at the station near mangrove forest) and around 1.8906 (at the station near the dock) to 2.4215 (at the station near mangrove forest) at rising tide period. In general, it can be seen that the planktonic diversity indexes are categorized in low level, except those that are at the station near mangrove forest at rising tide period which categorized in moderate level. This is in line with Wilm which states that species richness of a community is stated low if it has H' < 2.303, moderate if H' is around 2.303 – 6.908.
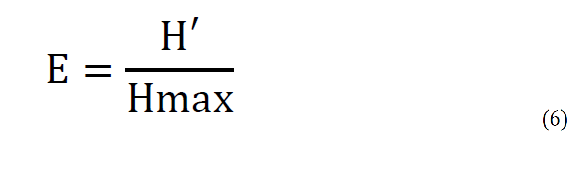
Likewise, planktonic diversity indexes, in general, are categorized in low to moderate levels. It is shown by the planktonic diversity index value around .4961 – 0.8193. Low diversity index shows that every community compiler genus spreads unequal or has unequal abundance proportion of planktonic genus. In other words, the planktonic community compiler at the location of research is still in an unstable condition. Besides, there is a trend dominated by other genera such as Coscinodiscus, Netrium, Ephitemia, and Euglena at every observation station. Based on the explanation above, in general, it can be seen that every observation station which has low H' causes low E as well. So, when H' is low, the number of individual of each genus varies (heterogeneous). Every diversity and uniformity indexes relate to each other and affect determining the level of constancy of a community. This is supported by Odum who states that in an ecosystem with low species uniformity and experiences outside interferences, the population tends to be managed by physical components such as weather, water flow, pollution, etc.
The lowest diversity index of plankton is always at the station near the dock while the highest is always at the station near the mangrove forest of the three observation stations, both at the falling tide period and at the rising tide period. It is possibly caused by the difference of oil waste levels on the water produced by ships activity where the station near the dock is the central or the place of ships operating especially the ships of fishermen which throw the waste around the docks by which the water around the station is polluted. Visually, the water surface around the station near the dock is covered by oil waste so that it prevents light penetration which finally gives a negative effect to the marine biota diversity especially plankton.
Furthermore, based on the measurement result of physical and chemical of water at three observation stations, both at falling tide period and rising tide period, the highest oil level on the water is found at the station near the dock and the lowest at the station near a mangrove forest. It can be seen that there is a converse relation of oil level on the water with the parameters such as the brightness level, oxygen level dissolved and diversity level of plankton. It means that if the oil level on the water is high, it will affect the decrease of brightness level and dissolved oxygen in the water. So, in the end, it will affect the decrease of the diversity level of plankton. Figure 3 shows the chart of the fluctuation of water physical-chemical factors.
Inline, Wardhana [11] states that water pollution by oil can affect the organism living in the water which is caused by
The indicators are:
Pollution Level | Diversity Indexes |
Unpolluted Slightly polluted Moderately Polluted Densely Polluted | > 2,0 2,0 - 1,6 1,5 - 1,0 < 1,0 |
Based on the indicators above, the observation station which is unpolluted is the station near mangrove forest and the stations which are slightly polluted are the stations in ships line both at falling tide period and rising tide period, and the station near the dock at rising tide period. Station near the dock at the falling tide period has moderately polluted.
The Effect of Physical-Chemical Factors of Water on the Plankton at Ocean Fishing Port of Belawan, North Sumatra Province
Data collection and data merger of physical-chemical parameters of water as the independent variable and planktonic diversity as the dependent variable which has been measured both at falling tide period and rising tide period are done before testing the hypothesis. Furthermore, the collected data is analyzed statistically in two ways, partially or individually using simple regression and simultaneously or together using multiple gradual regressions. Data is analyzed partially using simple regression between each physical-chemical factor of water consists of temperature, brightness, suspended solids, salinity, pH, dissolved oxygen, BOD, COD, Nitrite, Nitrate, O-Phospate, and Oil parameters toward planktonic diversity at Ocean Fishing Port of Belawan, North Sumatra Province.
If it is seen from the analysis result of each parameter, data analysis partially or individually using simple regression on the weather, suspended solids, salinity, pH, BOD, COD, Nitrite, Nitrate, and O-Phospate shows Fcount<Ftable, meaning that it does not affect on the planktonic diversity with the trust level of 95%. It can be seen on the statistical analysis result which each of F count obtained 4.7312; 1.1472; 0.1349; 1.1318; 0.1332; 1.6502; 1.2254 and 0.5967, while in the list with the trust level of 95% and df (1.4) obtained F table(0,05) (1,4) = 7.71. The three other parameters, brightness, dissolved oxygen and oil affect the planktonic diversity.
Brightness is obtained from the analysis result of F count = 22.4776 in the F distribution list with the trust level of 95% with df (1.4) obtained Evidently, F count is higher than F table (Fcount>Ftable). It shows that the variable of brightness has a role in predicting the .
For dissolved oxygen, it is obtained the analysis result of F count = 43.4135. In the F distribution list with the trust level of 95% and df (1.4) it is obtained F table(0,05) (1,4) = 7.71. F count is higher than Ftable (Fcount>Ftable). It means that dissolved oxygen as an independent variable gives a positive effect on the planktonic diversity in the area. The size of the effect is shown by the determination coefficient value of R2 (R square) – 0.9156. So, the size of the effect of dissolved oxygen on the planktonic diversity is 91.56%. For Oil, based on the data analysis result about the effect of ship oil waste on the planktonic diversity, it is obtained F count = 58.6501. In the F distribution list with trust level 95% and df (1.4), it is obtained F table(0,05) (1,4) = 7.71. F count is higher than Ftable (Fcount>Ftable). It means that the Null Hypothesis (Ho) is rejected and the alternative hypothesis (Ha) accepted. It shows that oil waste as an independent variable gives an effect on the planktonic diversity in the area. The size of the effect can be seen from the size of determination coefficient value of R2 (R square) = 0.9361. Based on the determination coefficient, it is obtained that ship oil waste gives a negative effect on the planktonic diversity by 93.61%.
Choosing the parameter which has the best regression or gives a real effect of the analysis result done partially can be done to know how far the simultaneous effect of some physical-chemical parameters of water as an independent variable on the planktonic diversity as the dependent variable. Those parameters are brightness, dissolved oxygen, and ship oil waste level on the water. Moreover, the three parameters are analyzed to know how far its effect on the planktonic diversity at the area by using Stepwise Multiple Regression. Based on the data analysis result simultaneously, it can be formulated that the linear function of the analysis result is Y = 3,9878 – 0,2088 M – 0,2074 O + 0,0080 K.
Based on the data analysis, it can be seen that simultaneously observed variables obtain that F count = 30,9460. In the F distribution list with the trust level of 95% and df (3.2), it is obtained that F table (0,05) (3,2) = 19,16. F count is higher than Ftable (Fcount>Ftable). It shows that simultaneously brightness, dissolved oxygen, and ship oil waste as independent variables give effect on the planktonic diversity as a dependent variable at the area. The size of the effect is shown by the size of determination coefficient value of R2 (R square) = 0.9789. Based on the determination coefficient, it is obtained that the three parameters simultaneously give a negative and real effect on planktonic diversity by 97.89% meanwhile, the rest is described by the other variables.
In general, the Index value of planktonic diversity of each observation station is categorized into low to moderate which is around 1.3777 to 2.4215. At Both the falling tide period and rising tide period, the highest planktonic diversity is always found at the station near the mangrove forest (2.2616 and 2.4215) and the lowest at the station near the dock (1.3777 and 1.8906). Based on the Relative Frequency (RF), Diversity Index (H'), and plankton uniformity (E), the dissemination of plankton genus found in the area is relatively not equal (heterogeneous). The trend is dominated by Coscinodiscus and Netrium genera. Related to this, based on the indicators of the planktonic diversity index, some areas of the water have been polluted slightly and also moderately.
Based on the result of measurement, the oil waste level on the water in the area is around 4.01 to 9.74 mg/I. At both the falling tide period and rising tide period, the highest level of oil waste on the water is always at the station near the dock (9,74 mg/I dan 6,05 mg/I) and the lowest at the station near mangrove forest (4,01 mg/I dan 4,30 mg/I). The result of data analysis partially or individually shows that temperature, suspended solids, salinity, pH, BOD, COD, nitrite, nitrate, and O-phosphate do not give an effect on planktonic diversity in the area. The result of simultaneously data analysis of parameters such as water brightness, dissolved oxygen, and oil waste level on the water give a negative effect on planktonic diversity at the Fishing Port about 97.89%.
Acknowledgment
At this moment I would like to thank: Universitas Islam Sumatera Utara, particularly the Dean of the Faculty of Teaching and Education and the Head of the Port of Belawan who have permitted the conduct of the study. As well as friends involved in discussions during the process of conducting research.
Jazuli, M. “Dinamika Hokum Lingkungan Hidup dan Sumber Daya Alam dalam Rangka Pembangunan Berkelanjutan.” Jurnal Rechts Vinding Media Pembinaan Hukum Nasional, vol. 4, no. 2, 2015, pp. 181–197.
Asyawati, Y., and A. Lely. “Identifikasi Dampak Perubahan Fungsi Ekosistem Pesisir terhadap Lingkungan di Wilayah Pesisir Kecamatan Muara Gembong.” Jurnal Perencanaan Wilayah dan Kota, vol. 14, no. 1, 2014, pp. 1–13.
Keputusan Menteri Perhubungan No. KM. 86 Tahun 1990 tentang Pemasangan OWS. Kementerian Perhubungan, 1990.
Fardiaz, S. Polusi Air dan Udara. Kanisius, 1992.
Edmonsond, W.T. Freshwater Biology. John Willey and Sons, 1959.
Pennak, R.W. Freshwater Invertebrates of United States. The Ronald Press Company, 1953.
Isnansetyo, A., and Kurniastuty. Teknik Kultur Phytoplankton dan Zooplankton. Kanisius, 1995.
Krebs, C.J. Ecology: The Experimental Analysis of Distribution and Abundance. Harper and Row, 1992.
Michael, P. Metode Ekologi untuk Penyelidikan Lapangan dan Laboratorium. Universitas Indonesia Press, 1995.
Odum, E.P. Fundamentals of Ecology. 3rd ed., W.B. Saunders Company, 1971.
Wardhana, W.A. Dampak Pencemaran Lingkungan. Andi Offset, 1995.
Kuncowati. “Pengaruh Pencemaran Minyak di Laut terhadap Ekosistem Laut.” Jurnal Aplikasi Pelayaran dan Kepelabuhan, vol. 1, no. 1, 2010, pp. 18–22.
Lee, C.D., et al. Benthic Macroinvertebrates and Fish as Biological Indicators of Water Quality with Reference to Community Diversity Index. Asian Institute of Technology, 1978.
