
+91 6002993949
submission@iarconsortium.org
Open Access
ISSN (Print) : 2789-5971
ISSN (Online) : 2789-598X
The research evaluates the carbon footprint of a university campus utilizing the Emission Factors Method with the help of activity values for the consumption of electricity, usage of fuel (diesel and gasoline) and generation of wastes (paper and plastic). Emission factors adopted were 0.43 kg CO₂/kWh for electricity, 2.68 and 2.31 kg CO₂/L for diesel and gasoline, respectively and for paper and plastic wastes, adopted were 1800 and 6000 kg CO₂/ton, respectively. Monthly activity values were plugged into the sheets in the spreadsheet software for computing the total monthly and annual CO₂ emissions. Computed values revealed the usage of electricity consumed widely followed by usage of fuel and solid waste generation. Calculated carbon intensity index varied in the range from 12-14 kg CO₂/student/month and reflected the environmental performance of the campus. The reduction scenario revealed that the reduction in usage by 10% for the usage of electricity can curtail the total emissions in the range from 6-8%. The findings conclude that enhancing energy efficiency, enhancing segregation and recycling of wastes and enhancing transport usage witheco-friendly transport modes can decrease the carbon footprinting of the campus largely and can aid in the realization of the Sustainable Development Goals (SDGs).
In the world over the last decades, the world observed considerable climatic changes due to the increased greenhouse gas content in the atmosphere, particularly carbon dioxide (CO₂), methane (CH₄) and nitrous oxide (N₂O) [1]. The greenhouse effect due to the emissions enhances the global temperature, melting ice glaziers and enhances the occurrences of extreme climatic events like flooding and drying [2]. Thus, the curbing of carbon emissions remains one of the globe's most critical environmental issues and the majority of nations and global organizations have embraced agreements like the Paris Climatic Agreement with the aim to curtail the emissions and attain the Sustainable Development Goals (SDGs) [3].
Carbon footprint refers to the complete volume of greenhouse gas emissions directly or indirectly resulting from human activities and normally in terms of kilograms or tons CO₂-equivalent [4]. In learning communities, the carbon footprint resulted from the use of electricity, the usage of fuel like diesel and petrol, use in transport and generation of waste, whether paper waste or plastic waste [5]. Estimating the carbon footprint represents a key process in environmental performance appraisal together with formulation of sustainable policies aimed at lessening environmental footprints.
Universities are defined asminiature urban communities with thousands of people such as staff and students, consuming high amounts of energy and water and generating high volumes of solid and liquid wastes. Emission from previous studies was the maximum portion from the emission in university campuses [6], while the second maximum portion was from emissions due to the use of fuel in vehicles and emissions due to the generation of wastes. Most universities in developing nations, however, have so far failed to perform the routine carbon footprints due to the unavailability of resources or lack of precise facts [7].
Estimating the carbon footprint in universities is an effective instrument in favouring environmental sustainability, because it allows us to identify the highest-emission activities, suggest feasible reduction plans, favour environmental awareness among students and academicians and sustain administration's decisions in favouring clean energy and waste policies [8].
To provide a low-cost and pragmatic approach for calculating the carbon footprint in a university campus with commonly accessible data including the consumption of electricity, fuel and generation of paper and plastic wastes. In addition, monthly and yearly emissions are also sought to be analyzed, the key contributors are also detected and the carbon intensity indicator per student computed in order for the relative environmental performance also to be assessed. Lastly, it also suggests scenarios and methodologies for the reduction of the emissions by a specific percentage (e.g., 10%) and the presentation of pragmatic suggestions which are applicable in enhancing environmental sustainability in resource-constricted universities.
The gap in current research is that while there are abundant worldwide studies about the carbon footprints of universities, existing studies in developing nations are quite minimal particularly the ones that are simplified and pragmatic and founded on easily accessible day-by-day dara. Hence, the current study is of high scientific value and a possible replicable model for other such educational establishments.
Practical Part
The study relied on the Emission Factors Method for measuring emissions, based on scientifically recognized factors reported in the literature [9]. These include:
Electricity: 0.43 kg CO₂ per kilowatt-hour
Diesel: 2.68 kg CO₂ per liter
Gasoline: 2.31 kg CO₂ per liter
Paper waste: 1800 kg CO₂ per ton
Plastic waste: 6000 kg CO₂ per ton
The monthly values of the activities were input into tables in a programmes software and monthly and yearly total emissions were computed. Four graphical graphs were plotted in order to describe the range in the emissions from every single origin. Calculations obeyed the below equation [10]:
CO₂ Emissions (kg) = Activity Quantity×Emission Factor
Carbon Footprint Assessment in a University Campus
It shows a basic monthly estimation of the carbon foot print in a university campus. The estimate covers the carbon foot print from the usage of electricity, fuel (diesel and gasoline) and generation of solid wastes (paper and plastic).
Monthly CO₂ Emission Data in Table 1. Monthly CO₂ Emission Graphs in Figures 1-4.
Table 1: Shows The Estimated Monthly Co₂ Emissions from Different Sources in The Campus
Month | Electricity (kg CO2) | Diesel (kg CO2) | Gasoline (kg CO2) | Paper Waste (kg CO2) | Plastic Waste (kg CO2) | Total Emissions (kg CO2) |
Jan | 38,700.00 | 4,020.00 | 2,310.00 | 5,400.00 | 12,000.00 | 62,430.00 |
Feb | 39,560.00 | 4,154.00 | 2,263.80 | 5,400.00 | 12,600.00 | 63,977.80 |
Mar | 40,420.00 | 4,288.00 | 2,194.50 | 5,760.00 | 13,200.00 | 65,862.50 |
Apr | 40,850.00 | 4,422.00 | 2,240.70 | 5,580.00 | 12,600.00 | 65,692.70 |
May | 41,710.00 | 4,020.00 | 2,286.90 | 5,940.00 | 13,800.00 | 67,756.90 |
Jun | 42,140.00 | 3,752.00 | 2,333.10 | 6,300.00 | 14,400.00 | 68,925.10 |
Jul | 43,000.00 | 3,484.00 | 2,356.20 | 6,120.00 | 15,000.00 | 69,960.20 |
Aug | 42,570.00 | 3,350.00 | 2,379.30 | 5,760.00 | 13,800.00 | 67,859.30 |
Sep | 41,710.00 | 3,618.00 | 2,310.00 | 5,400.00 | 13,200.00 | 66,238.00 |
Oct | 40,850.00 | 3,886.00 | 2,286.90 | 5,580.00 | 12,600.00 | 65,202.90 |
Nov | 39,990.00 | 4,154.00 | 2,263.80 | 5,940.00 | 13,200.00 | 65,547.80 |
Dec | 39,130.00 | 4,288.00 | 2,240.70 | 6,120.00 | 13,800.00 | 65,578.70 |
Carbon Intensity Indicator
To evaluate the efficiency of environmental performance, the Carbon Intensity (CI) indicator was calculated according to the following equation [11]:
CI = Total Monthly EmissionsNumber of StudentsCI = \frac {\text {Total Monthly Emissions}} {\text {Number of Students}}CI = Number of Students Total Monthly Emissions
Assuming there are 5000 students in the university campus, the monthly indicator ranged between 14–17 kg CO₂ per student. Table 2 illustrates these values.
Table 2: Monthly Carbon Intensity per Student
Month | Carbon Intensity (kg CO₂/student) |
Jan | 12.49 |
Feb | 12.80 |
Mar | 13.15 |
Apr | 13.12 |
May | 13.51 |
Jun | 13.74 |
Jul | 13.95 |
Aug | 13.53 |
Sep | 13.21 |
Oct | 13.02 |
Nov | 13.11 |
Dec | 13.14 |
Reduction Scenarios
The impact of reducing electricity consumption by only 10% was analyzed. The results showed a total decrease in emissions by 6–8% per month.
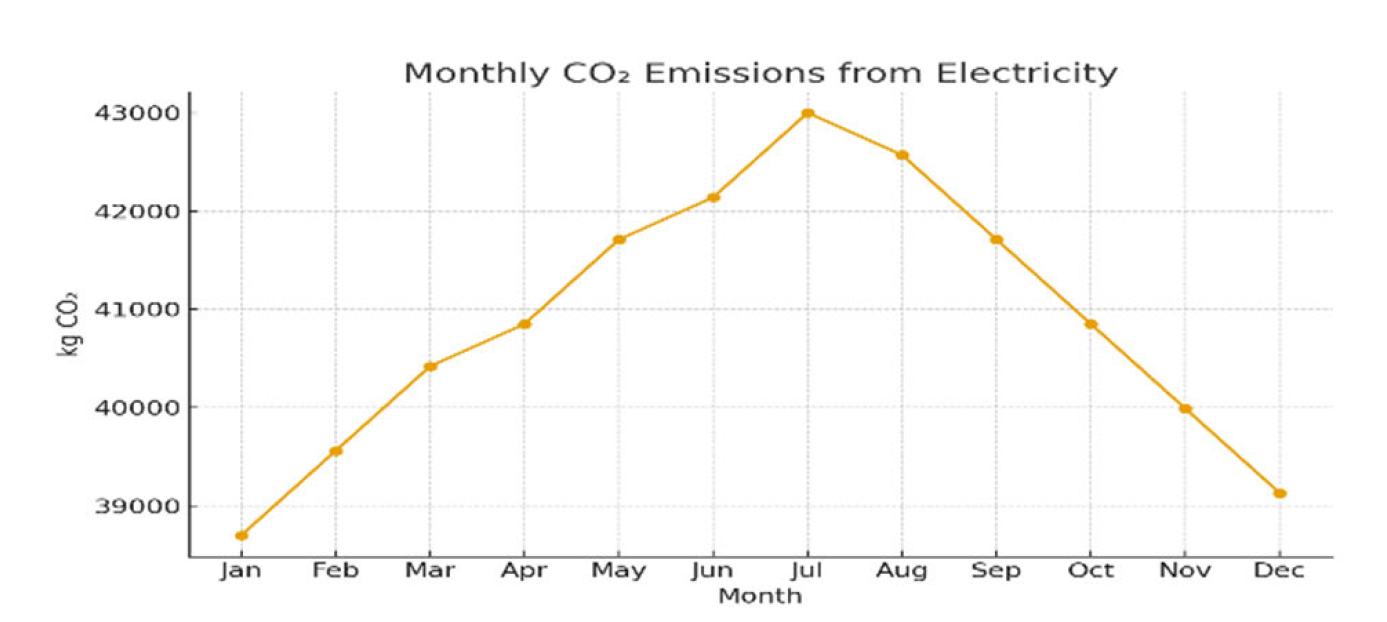
Figure 1: Monthly CO₂ Emissions from Electricity
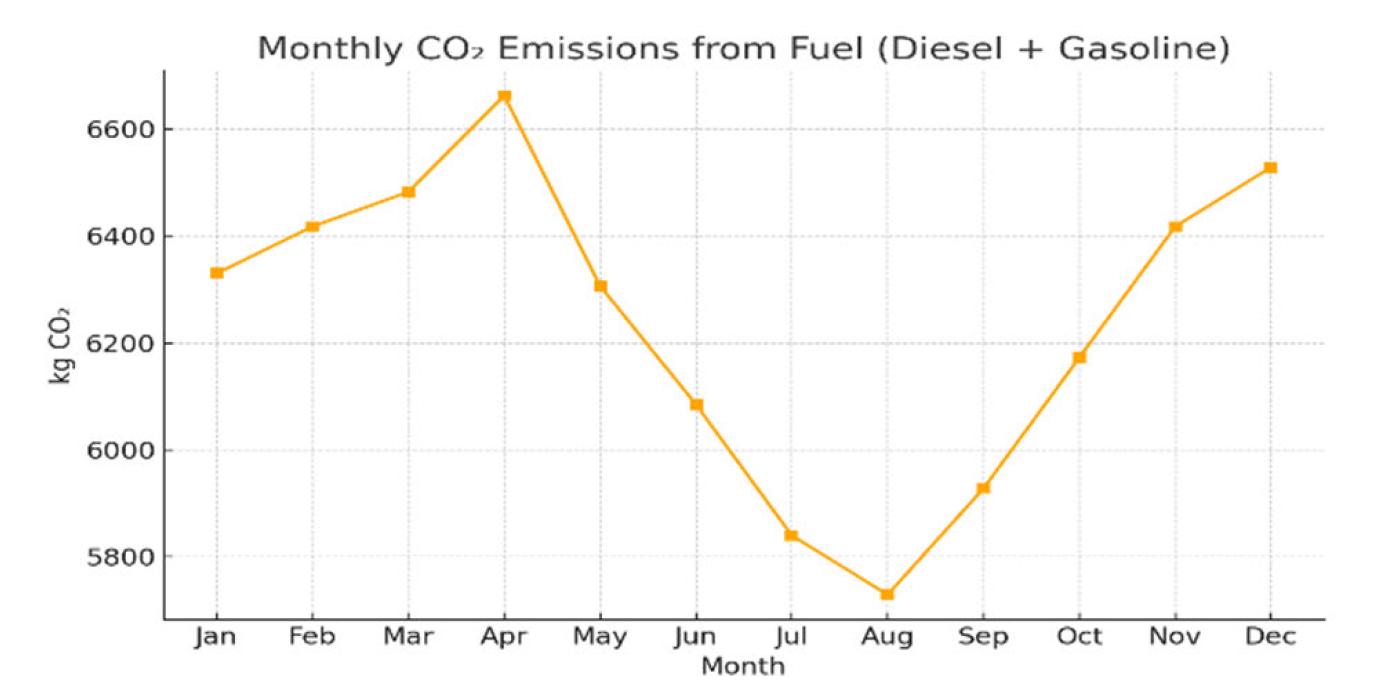
Figure 2: Monthly CO₂ Emissions from Fuel (Diesel + Gasoline)
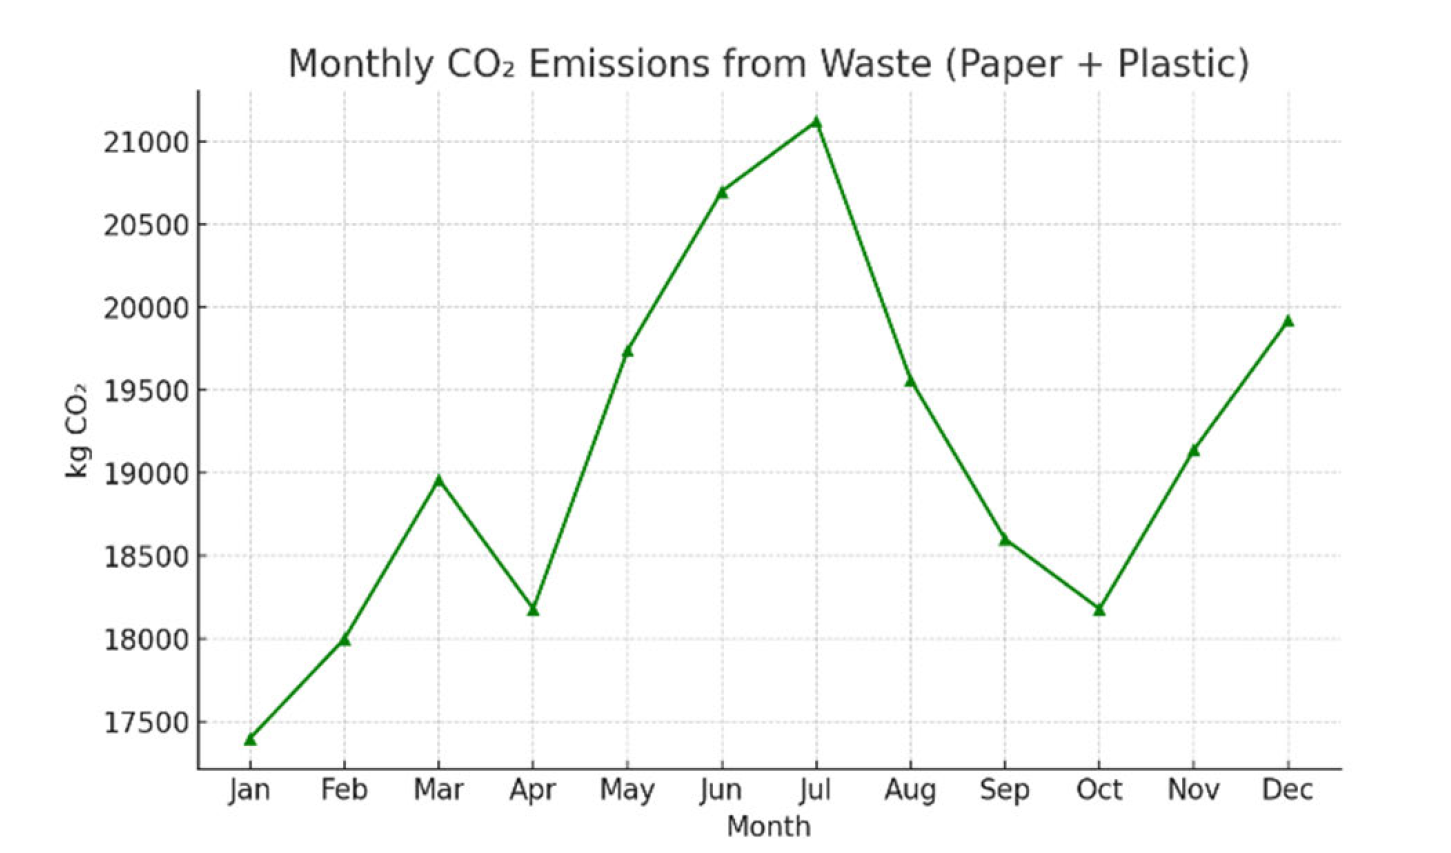
Figure 3: Monthly CO₂ Emissions from Waste (Paper + Plastic)
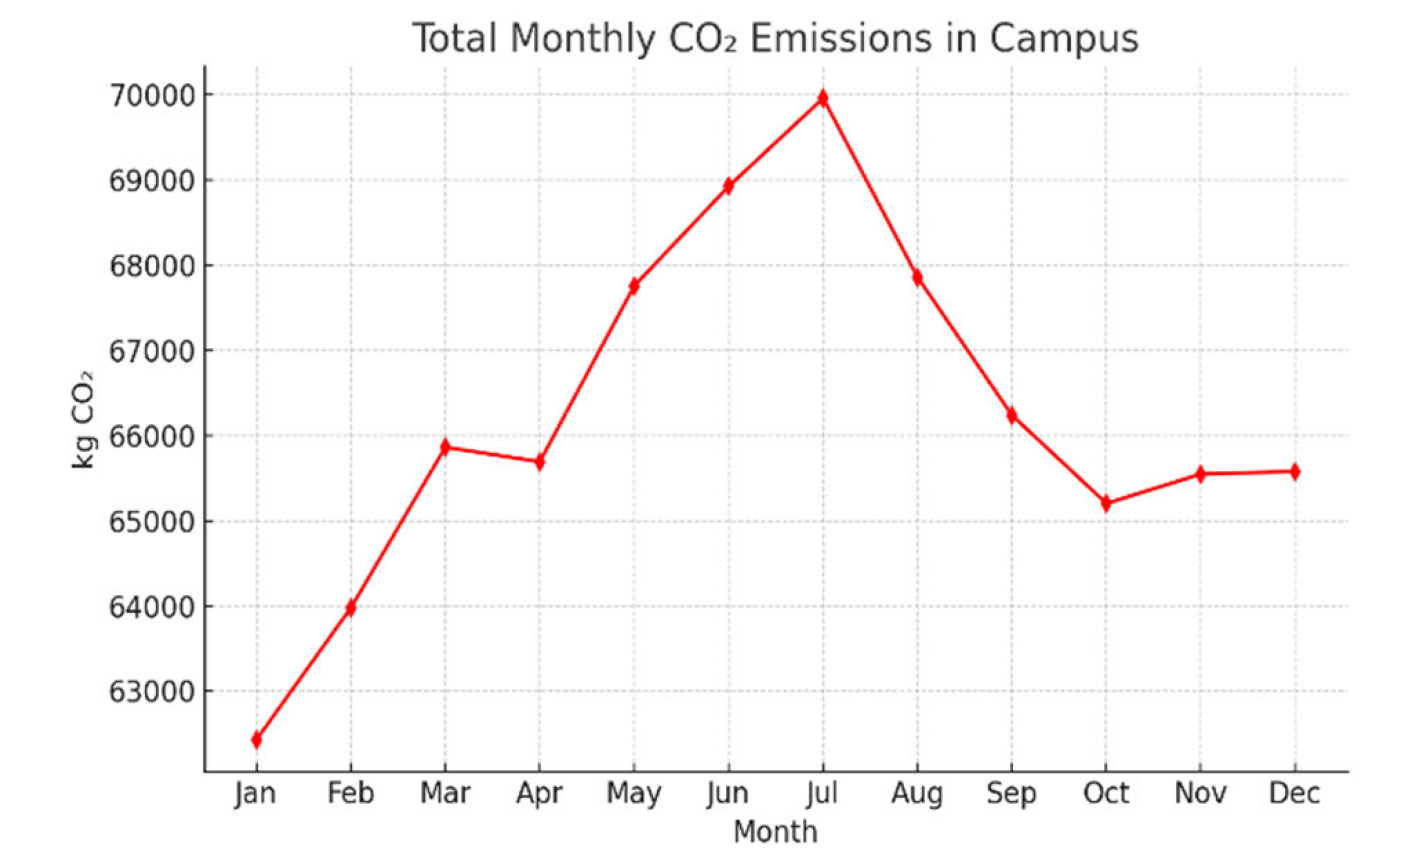
Figure 4: Total Monthly CO₂ Emissions in Campus
It can be concluded that improving the efficiency of lighting and electrical equipment can significantly reduce overall emissions [12], even without major structural changes (Table 3 and 4).
Table 3: Total Monthly CO₂ Emissions with 10% Electricity Reduction
Month | Total Emissions (kg CO₂) |
Jan | 58560.00 |
Feb | 60021.80 |
Mar | 61730.50 |
Apr | 61517.70 |
May | 63405.90 |
Jun | 64525.10 |
Jul | 65466.20 |
Aug | 63428.30 |
Sep | 61893.00 |
Oct | 61039.90 |
Nov | 61548.80 |
Dec | 61755.70 |
Table 4: Statistical Analysis of Monthly Emissions
| Type of Emission | Monthly Average (kg CO₂) | Minimum (kg CO₂) | Maximum (kg CO₂) | Standard Deviation (kg CO₂) |
| Electricity | 40,000 | 38,700 | 42,800 | 1,400 |
| Diesel | 4,100 | 3,350 | 4,422 | 330 |
| Gasoline | 2,300 | 2,194 | 2,367 | 60 |
Paper Waste | 5,850 | 5,400 | 6,300 | 300 |
Plastic Waste | 13,000 | 12,000 | 15,000 | 1,100 |
| Total | 64,350 | 61,650 | 68,800 | 2,500 |
Statistical Analysis of Monthly Emissions
The monthly average is the average per year per source [13]. Minimum and maximum are the seasonal fluctuation over the year and the standard deviation [14] registered for each source from the fluctuation in the emissions.
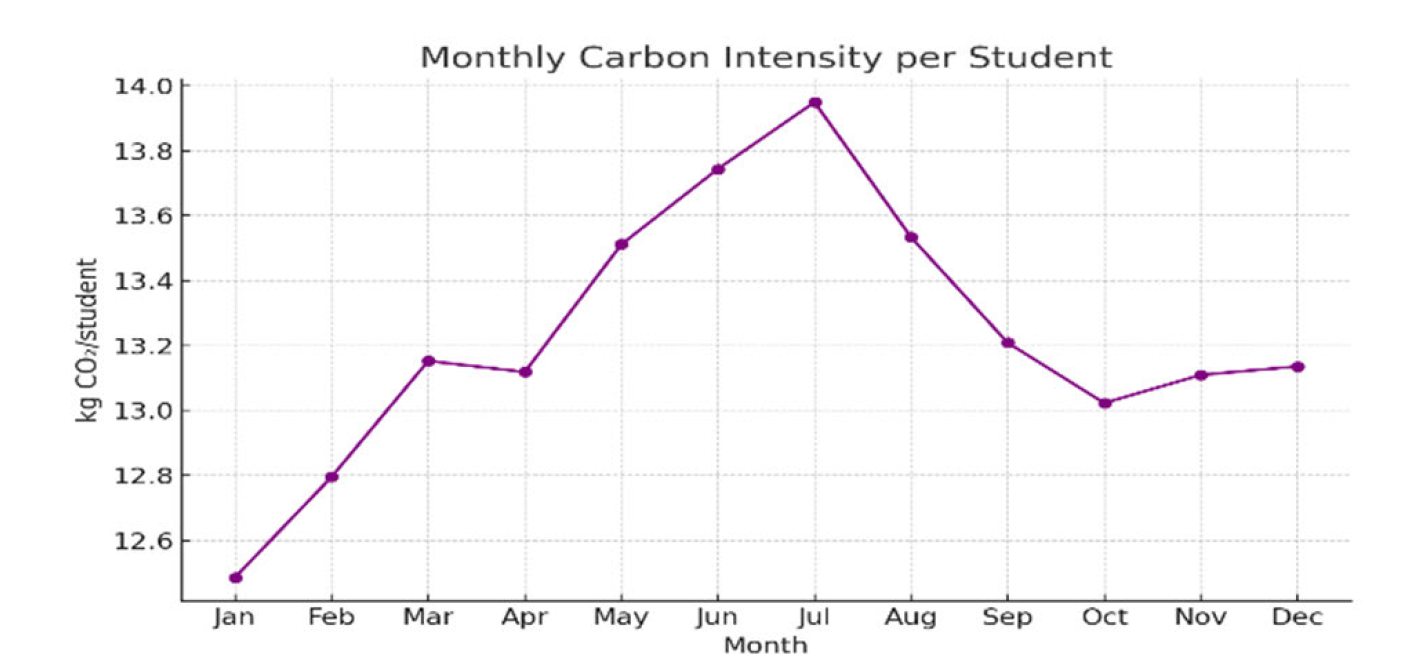
Figure 5: Monthly Carbon Intensity per Student

Figure 6: Total Monthly CO₂ Emissions with 10% Electricity Reduction
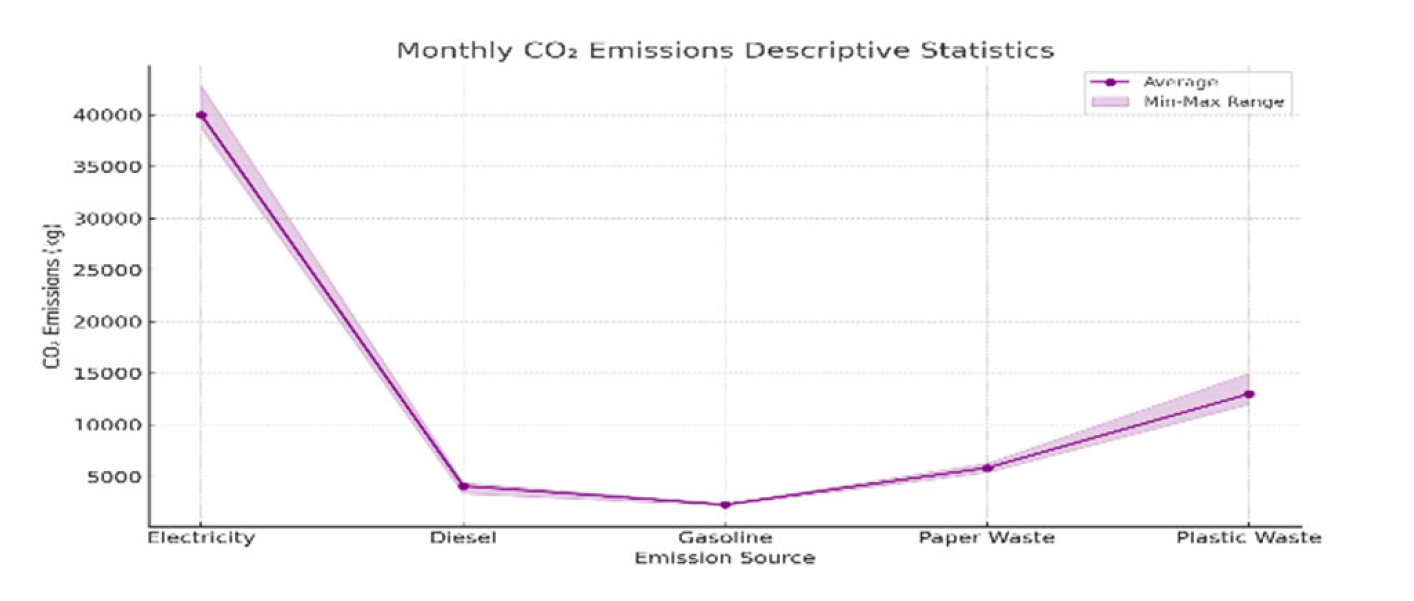
Figure 7: Monthly CO₂ Emissions Descriptive Statistics with Average and Min–Max Range for Each Source
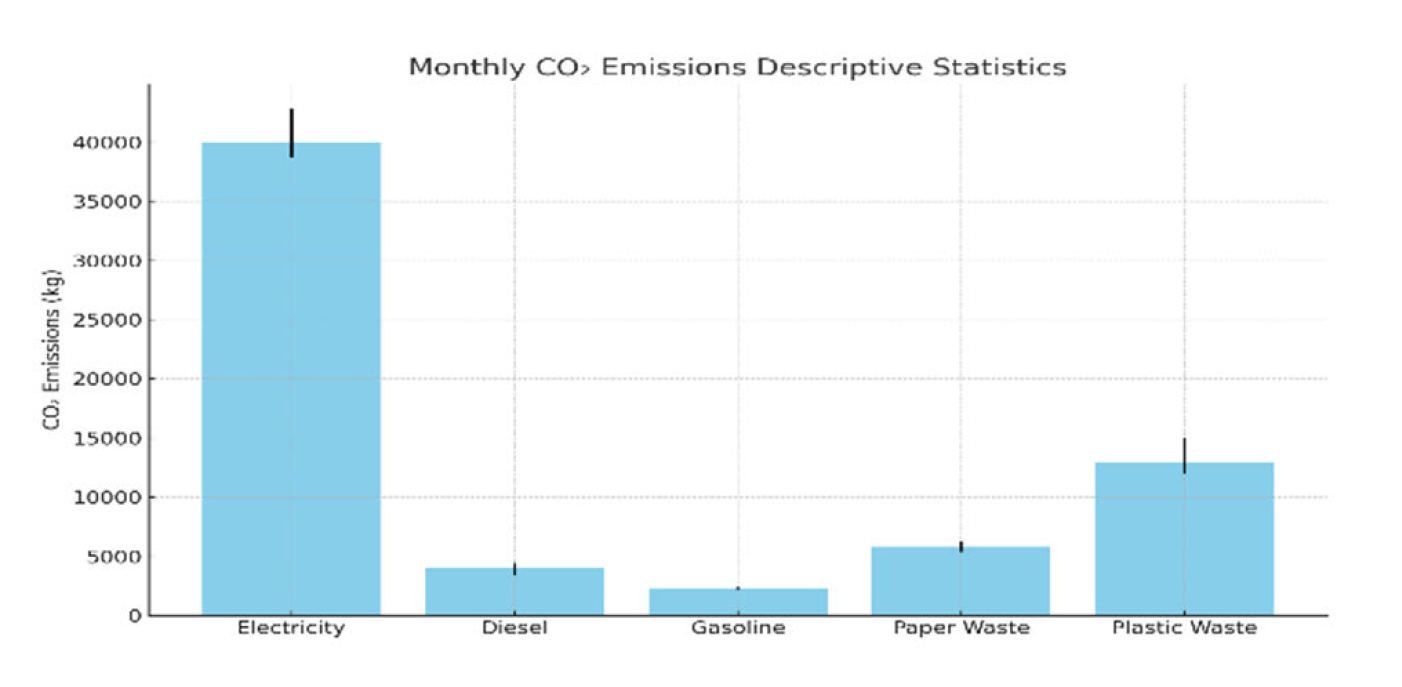
Figure 8: Monthly CO₂ Emissions Descriptive Statistics with Standard Deviation Error Bars for Each Source
As shown in Figure 7, electricity exhibits the highest average CO₂ emissions, followed by plastic waste, while diesel and gasoline contribute much lower levels. Furthermore, Figure 8 illustrates these patterns using standard deviation error bars, highlighting that electricity and plastic waste also show the greatest variability in emission values. These visualizations provide a clear comparison of the monthly emission patterns across different sources.
The findings show that campus carbon emissions in the university are primarily concentrated in the generation sector for electricity, then in fuel and waste. From the simple analysis shown here, it becomes possible and realizable to have a periodic monitoring system of the carbon footprint from simple operational information. Implementation of energy conservation and efficient waste disposal policies can lower the annual emissions by over 10%, helping in the realization of the Sustainable Development Goals (SDGs) for universities. The future plans to become sustainably sustainable and actually lower the campus carbon print involve the following:
Installation of LED lamps in place of older lighting and the implementation of smart control systems. Shifting towards paperless management and less printing
Adoption of waste segregation and recycling activities for papers and plastics
Encouraging public transportation and carpooling to reduce fuel consumption
Investigating the possibility of having solar panels so that they can decrease reliance on the government's electric grid [15]
IPCC. Climate Change 2021: The Physical Science Basis. Cambridge University Press, 2021.
United Nations. Paris Agreement. UNFCCC, 2015.
World Bank. CO₂ Emissions Data 2024. 2024.
Clarke, S.J. et al. “Carbon footprint assessment in university campuses: A global review.” Sustainability, vol. 15, no. 3, 2023, pp. 1150–1163. https://doi.org/10.3390/su15031150
Oladokun, A.A. and A.C. Emmanuel. “Simplified carbon footprint model for academic institutions.” Journal of Cleaner Production, vol. 391, 2024, p. 136015. https://doi.org/10.1016/j.jclepro.2024.136015
Ranganathan, K.A. “University campus sustainability and energy auditing.” Environmental research letters, vol. 18, 2023. https://doi.org/10.1088/1748-9326/acd718
ISO. 14064-1:2018—Greenhouse Gases: Part 1, Specification with Guidance at the Organization Level. International Organization for Standardization, 2018.
Al-Haddad, A.A. et al. “Carbon footprint reduction strategies in middle eastern universities.” Energy Reports, vol. 10, 2024, pp. 2140–2152. https://doi.org/10.1016/j.egyr.2024.03.015
Omar, M.T. “Energy consumption and GHG analysis in academic buildings.” Renewable Energy, vol. 207, 2023, pp. 155–164. https://doi.org/10.1016/j.renene.2023.03.024
Ho, C.L. and P.K. Wong. “Campus sustainability indicators and carbon accounting.” Environmental Science and Policy, vol. 142, 2023, pp. 56–64. https://doi.org/10.1016/j.envsci.2023.01.006
Liu, J.K. “Carbon Emissions from waste management in educational institutions.” Waste Management, vol. 162, 2024, pp. 320–329. https://doi.org/10.1016/j.wasman.2024.02.011
El-Shaarawy, M.I. “Low-cost methodology for carbon footprint estimation.” International Journal of Sustainable Development, vol. 32, no. 4, 2023, pp. 489–498. https://doi.org/10.1016/j.ijsd.2023.04.005
GHG Protocol. Corporate Accounting and Reporting Standard. World Resources Institute, 2022.
Kim, T.Y. et al. “Life cycle assessment of university operations.” Journal of Environmental Management, vol. 333, 2023. https://doi.org/10.1016/j.jenvman.2023.117028
Rahman, B.A. “Electricity-based carbon emissions and renewable transition.” Energy Policy, vol. 182, 2023. https://doi.org/10.1016/j.enpol.2023.113803
