
+91 6002993949
submission@iarconsortium.org
Open Access
ISSN (Print) : 2788-9459
ISSN (Online) : 2788-9467
This research examines the production, evaluation and analysis of ultra-thick laminated Polymer Matrix Composite (PMC) beams, aiming to create high-performance PMC leaf springs for automotive uses. A novel feature of this research is the incorporation of Fiber Bragg Grating (FBG) sensors and thermocouples (TCs) to track residual strain and exothermic reactions in composite structures throughout the curing and post-curing manufacturing processes. Furthermore, the Calibration Coefficients (CCs) are determined using Strain Gauge measurement outcomes from static three-point bending tests. A significant portion of the research is dedicated to developing a well-correlated Finite Element (FE) model that accounts for Large Deflection (LD) effects through Geometrical Nonlinear Analysis (GNA) to comprehend the deformation behavior of ultra-thick composite beam (ComBeam) samples, thereby enhancing the understanding of large deformation behavior and addressing critical research gaps in composite materials. This model will facilitate the evaluation of internal strain distribution, which is validated by correlating data from FBG sensors, Strain Gauges (SGs) and FE analysis. Additionally, this research emphasizes the use of FBG sensors in Structural Health Monitoring (SHM) during fatigue tests under three-point bending, supported by load-deflection sensors: a novel method for composites at this scale. The findings of this study indicate that the fatigue performance of ComBeam samples significantly deteriorated with increasing displacement ranges, even at identical maximum levels, highlighting the potential of FBG sensors to improve SHM capabilities associated with smart maintenance.
The legal, environmental and competition-driven necessities for decreasing CO2 emissions, the transition towards electric vehicles and swift progress in material technology have positioned "light weighting" technology as a central focus within the automotive industry.
PMCs, which have been developed and employed in the defense and aviation sectors, provide a high strength-to-weight ratio, making them a technically important choice for light weighting research in automotive applications. Currently, due to the advancements in technology, PMCs in the automotive field have moved beyond non-structural components and are increasingly being utilized in load-bearing structural elements. A prime example of the use of structural PMCs in the automotive industry is leaf springs [1]. Leaf springs typically feature a variable cross-section. These non-prismatic structures, referred to as fully stressed beams, are optimized for material efficiency [2].
Leaf springs are particularly well-suited for structural composite applications because of their beam design, which is specifically engineered for loading conditions that are restricted to vertical (Z-axis) loading and particular loading specifications. This research aids in the advancement of composite leaf springs for Heavy Commercial Vehicles (HCVs), which have conventionally utilized steel leaf springs that weigh over 200 kg. The use of composite alternatives provides substantial weight savings, improving vehicle damping and driving comfort while also exhibiting high natural frequencies to reduce resonance. Additionally, the incorporation of lighter leaf springs into the suspension system lessens the unsprung mass. This reduction mitigates the effects of vibrations originating from the wheels on the vehicle body and the dynamic load variations on the wheels, ensuring stable tire-road contact [3]. As a result, this enhances both comfort and safety. Although there is limited research on composite leaf springs for HCVs that necessitate thick composite designs ranging from 50 mm to 100 mm due to load demands, extensive investigations have been carried out on Passenger Cars (PCs) and Light Commercial Vehicles (LCVs). These vehicles employ PMC leaf springs with thicknesses of less than 50 mm, which are subjected to lower loads compared to those experienced by HCVs [4-11]. The majority of these studies have concentrated on analyzing the behavior of leaf springs and performing dynamic modeling. Fatigue behavior is a critical focus area for composite leaf springs because of their exposure to continuously fluctuating dynamic loads. Research that simulates real vehicle operation, including impact and vibration testing, is essential for evaluating the material responses under such dynamic circumstances [7,8]. Composite leaf springs are particularly important in the development of structural and dynamic applications for PMCs, primarily due to the challenges associated with fatigue behavior and the intricacies of connection techniques [10,11].
Achieving durable and consistent PMC leaf springs necessitates meticulous execution, oversight and documentation of both the production and validation phases. Key production parameters encompass cure temperature, pressure and duration, whereas validation parameters include strain, force, temperature, damage evolution and identification, as well as component life forecasting. As previously mentioned, this study concentrates on thick PMC beams for the design and fabrication of composite leaf springs, which involves tasks such as establishing suitable manufacturing conditions, detecting and characterizing manufacturing defects and validating products through fatigue testing with appropriate sensor technologies. Finite Element (FE) analysis is conducted to comprehend the essential physics observed during the validation phase.
In addition to the distinctive properties of PMC materials, such as high specific strength and improved damage tolerance under fatigue loading conditions, they can facilitate the development of intelligent composite structures by incorporating embedded sensor systems during the manufacturing process [12,13]. This integration enables the creation of sophisticated composite structures equipped with sensor systems for monitoring the manufacturing process and Structural Health Monitoring (SHM). SHM offers real-time insights into load, pressure and temperature fluctuations in composite structures, utilizing intelligent sensors and data analytics for ongoing monitoring and prompt fault detection. The SHM system swiftly recognizes and reacts to changes, thereby averting failures and prolonging lifespan. Advanced algorithms process data to forecast performance and inform maintenance strategies [14].
A network of small sensors provides comprehensive insights, accurately identifying damage for prompt intervention. The advantages encompass improved safety, cost efficiency, enhanced reliability and decisions driven by data. Structural Health Monitoring (SHM) technologies primarily rely on strain measurements and comprise Electrical Resistance Strain Gauges, Piezoelectric Sensors, Carbon Nanotube and Graphene-Based Sensors, MEMS Strain Gauges, Wireless Passive Radio Frequency Identification (RFID)-based sensors, as well as Thermoelastic Stress and Embedded Capacitive Sensors, in addition to Optical Fiber Sensors [15]. Among these sensing technologies, RFID strain sensing has garnered significant attention due to its capability for long-distance transmission and its semi-active wireless strain sensing features facilitated by dual-interrogation-mode RFID technology. Nevertheless, in contrast to optical fibers, this technology presents certain limitations, including vulnerability to environmental factors (such as moisture and temperature fluctuations) and a restricted range in conductive materials like carbon-fiber composites, particularly in passive and semi-passive systems [16,17].
The FBG sensor represents a type of optical sensor that can be integrated into the PMC structure, allowing it to serve both process monitoring and SHM functions. FBG sensors are known for their high sensitivity and precision in detecting changes in strain and temperature.
FBG sensors can be multiplexed along a single optical fiber, facilitating multiple sensing points with minimal cabling, which enhances efficiency compared to Piezoelectric and Carbon Nanotube Sensors. When embedded in composite materials, FBGs maintain mechanical integrity while also demonstrating durability and longevity, performing better in harsh conditions than many alternatives. They provide real-time data on strain and temperature, which is essential for dynamic monitoring and prompt fault detection, offering greater accuracy than Thermoelastic Stress and Embedded Capacitive Sensors. When incorporated into the manufacturing process, FBGs allow for continuous monitoring from production through to end-use, providing a comprehensive overview of material performance. With low signal attenuation over extended distances, FBGs are particularly well-suited for monitoring large structures, establishing them as a superior option for process monitoring and SHM.
Fundamentally, FBGs are optical fibers that have Bragg gratings inscribed within their core. These gratings are designed to reflect certain wavelengths of light while allowing others to pass through. When the fiber experiences variations in temperature or stress, the spacing of the Bragg gratings alters, resulting in a shift in the reflected wavelength [18]. This shift in wavelength, known as the Bragg wavelength (λB), can be measured with precision, facilitating the accurate detection of variations in temperature and stress as described in Equation (1). In this equation, ∆λB denotes the change in Bragg wavelength, pe represents the photoelastic constant (0.22), α is the thermal expansion coefficient (0.55×10⁻⁶/°C), η is the thermo-optic coefficient (8.6×10⁻⁶/°C) and ∆T and ε signify the changes in temperature and strain, respectively [19].
This research thoroughly investigates the lifecycle of a large-scale laminated ComBeam, encompassing its manufacturing phase through to physical testing, utilizing surface-mounted or embedded sensors such as FBGs, SGs and TCs. Figure 1 illustrates the comprehensive workflow of this study. The primary focus of this research is the durability of thick laminated ComBeams, which are essential for the advancement of composite leaf springs for Heavy Commercial Vehicles (HCVs). In contrast to common research trends that typically focus on smaller, coupon-sized specimens, our study prioritizes full-scale composite structures. By broadening this research to encompass larger structures, we address and clarify size-related factors that significantly affect the mechanical properties of composite materials, as these factors are often neglected in smaller-scale investigations.
Figure 1: Integrated Workflow for the Manufacturing, Testing and SHM of Large-Scale Laminated ComBeams using Advanced Sensor Technologies
This research focuses on the fabrication of laminated composite samples that replicate the actual dimensions of PMC leaf springs in both length and width, while varying the thickness to more accurately simulate real-world applications. This methodology is essential for establishing a foundational understanding of the behavior of thick-laminated ComBeams. The objective of the study is to contribute to basic design principles, thereby improving the performance, durability and safety of contemporary transportation infrastructure through the use of full-sized composite leaf springs. A notable feature of this research is the implementation of FBG sensors for process monitoring and Structural Health Monitoring (SHM). Regarding process monitoring, this study not only observes the curing behavior of a thick composite structure but also thoroughly investigates the development of residual strains resulting from curing a composite structure under a hot compression molding process, utilizing FBG sensors. Moreover, thermocouples (TCs) are employed to record temperature profiles at critical manufacturing stages, offering a detailed understanding of the curing behavior throughout the production process. Beyond the exploration of thick ComBeam manufacturing, this research also examines the mechanical behavior of laminated ComBeams under both static and dynamic loading conditions. This study goes beyond representative samples to encompass full-scale prototypes, which are the most indicative of real-world applications. It is important to emphasize that this work specifically integrates embedded FBG sensors, Strain Gauges (SGs) and load-deflection sensors into the experimental setup created for a three-point bending test, aimed at investigating thick composite laminates. This setup is vital for replicating and comprehending conditions that are analogous to real-life scenarios. Additionally, numerical studies are performed with the goal of providing thorough insights into the structural behavior of these full-sized laminated coupons, with a particular focus on the results of Geometric Nonlinear Analysis (GNA) for thick ComBeams.
This study greatly improves our comprehension of thick laminated ComBeams and highlights the pivotal role that FBG sensors have in progressing materials science. It concentrates on large-scale, full-sized composite structures, providing insights that are directly relevant to the automotive sector and fostering innovative solutions for transportation and associated fields. The research utilizes advanced sensor technology embedded in composite materials, marking a vital advancement towards guaranteeing the optimally designed functionality of diverse structural components in industrial applications.
Material and Manufacturing
It is essential to comprehend the curing behavior of thick ComBeams, whether they possess uniform or varying material thicknesses, during the compression molding process. This understanding is crucial due to the risk of an exothermic reaction and the potential for non-uniform heat transfer within the material system. FBG sensors are particularly effective in monitoring temperature, strain and the distribution of internal stress. These sensors yield significant insights into the intricate physics of the curing process, which encompasses resin gelation, solidification and shrinkage, ultimately resulting in the formation of internal stress [20-23].
In this investigation, FBG sensors and TCs were individually incorporated into distinct samples of thick ComBeams that shared identical dimensions. Single mode polyamide coated FBG sensors, featuring a grating length of 1 mm, were procured from TECHNICA (Atlanta, GA, USA). The ComBeams were fabricated using a glass/epoxy 300 Grams per Square Metre (GSM) prepreg, produced by Kordsa (Istanbul, Türkiye) under the product designation OM11. The OM11 prepreg consists of unidirectional (UD) E-glass fiber combined with a hotmelt epoxy resin system, achieving a fiber weight content of 65%. The non-cured ply thickness of the prepreg was determined to be 0.25 mm. For the manufacturing process, the prepregs, which had a width of 600 mm, were cut into strips measuring 96 mm in width and 1,595 mm in length utilizing a ZUND Digital Cutter (Zünd Systemtechnik AG., Altstätten, Switzerland). The cut prepregs were manually laid into preforming fixtures to prevent any misalignment of fibers along the length of the ComBeams. The total number of laminates utilized was either 260, 280 or 350 per ComBeam. All sensors depicted in Figure 2 were employed for the ComBeam samples containing 350 laminates. FBG sensors were strategically embedded between the designated layers during the placement of the prepreg layers, as illustrated in Figure 2a and 3a.
It is important to highlight that the FBG sensors were exclusively positioned on the right side of the beam, based on the assumption that when the beam is loaded, it undergoes identical strain levels on both the right and left sides relative to the vertical center line that bisects the beam. The sensors FBG 1 and FBG 4 were installed outside the central clamping area, while FBG 2 and FBG 5 were situated close to the support points. These boundary placements, which are particularly significant under bending loads, are elaborated in Section 2.3. Furthermore, sensor FBG 3 was located on the neutral axis of the beam, equidistant from the other two sensor pairs. The sensors FBG 1 and FBG 2 were affixed to the 340th layer, whereas FBG 4 and FBG 5 were embedded in the 100th layer, as determined by the sensor entry slot of the mold, as depicted in Figure 4b. The thermocouples (K-type (NiCr/NiAl), sourced from ORDEL (Ankara, Türkiye)) were integrated into the central section of the ComBeams, a crucial area for monitoring exothermic reactions and the formation of a thermal gradient during the curing process, as shown in Figure 2c and 3b. The cure kinetics of the OM11 resin system were thoroughly examined using High Pressure Dynamics Scanning Calorimetry (HP-DSC) analysis (Mettler Toledo (Melbourne, Melbourne) HP DSC 2+ system), where the resin samples were heated from 25 to 130°C at a rate of 3°C per minute. The samples were maintained isothermally at 130°C for 30 minutes to replicate the manufacturing conditions of ComBeams. This procedure was conducted at various pressure levels: 1, 2, 4 and 6 MPa.
The beams were manufactured utilizing a compression molding technique with an oil-heated press, as illustrated in Figure 4a. Initially, the mold's surface was prepared with Axel Xtend-838 mold cleaner (Axel Plastics Research Laboratories, Inc., Monroe, CT, USA). Subsequently, pre-stacked prepreg strips were positioned in the lower mold cavity, as depicted in Figure 4b. The mold was specifically engineered to facilitate the exit of the FBG sensors and TCs without incurring damage, as shown in Figure 4c. The manufacturing process commenced with preheating the empty mold to 120°C, followed by the placement of the prepreg stacks into the lower mold cavity, closing the upper mold and consolidating the part under a molding pressure of 125 bars (2000 kN). After the molding process, the ComBeams were demolded and subjected to post-curing in an oven at 110°C for 10 hours to relieve residual stress within the structure. This research resulted in the production of eight ComBeams in three different thicknesses, as detailed in Table 1. Samples 1-4 were created to optimize production and assess the stiffness and fatigue characteristics without the inclusion of sensors. Samples 5 and 6 incorporated embedded FBG sensors to monitor temperature and strain during both production and testing phases. These samples were also utilized to investigate the varying effects of press force on the curing characteristics of the samples. Samples 7 and 8 examined the exothermic reactions occurring during manufacturing through their embedded TCs.
Continuous monitoring of thermal and strain variations was conducted throughout the hot compression molding process, as illustrated in Figure 5a, along with the subsequent post-curing phase. Data from the embedded-FBG sensors were collected at a high sampling frequency of 100 Hz utilizing the four-channel Micron Optics sm130 optical sensor interrogator, as shown in Figure 5b. The FBG sensor measurements were facilitated by Micron Optics Enlight 1.18.8.0 software (Luna Innovations Inc., Roanoke, VA, USA). The Ipetronik (Baden, Germany) MThermo 16 data acquisition device (DAQ), depicted in Figure 5c, recorded temperature measurements at a frequency of 1 Hz from the embedded thermocouples during the manufacturing process and was operated with the dedicated Ipetronik 2017 software. Additionally, data processing was executed using nCode GlyphWorks 2022 analytical software.
Figure 2(a-c): Side View and Cross-Sectional Representation of a Laminated ComBeams with Varied Sensor Layout: (a) Embedded FBG Sensors with Protective Metal Pipes Near the Tip, (b) Surface-Mounted SGs and (c) TCs Embedded Through the Center Section

Figure 3(a-b): Sensor Integration Studies in ComBeam Fabrication: (a) TECHNICA Polyimide Optical Fibers Shown with Local Metal Pipe Protection at the Ends of the Laminated ComBeam, Including a Close-up of an FBG Sensor Point and (b) K-type TC Cables Embedded Within the Laminated ComBeams, with a Focus on a TC Sensor Point Positioned at the Center
Figure 4(a-c): (a) Hydraulic Press Used in ComBeam Manufacturing, (b) Design of Thick Laminated ComBeam and Oil-Heated Steel Molds and (c) Mold End Adapted for Sensor Cable Retrieval and Preformed ComBeam with Integrated FBG Sensors, Each with Local Metal Pipes to Protect Against Mold Movement
Three-Point Bending Tests
In the domain of PMC, it is crucial to conduct a comprehensive evaluation of mechanical properties across various static and dynamic conditions. A significant volume of research has been undertaken in this area to explore the structural characteristics and performance of PMCs by utilizing FBG sensors, which include strain measurement, detection of residual strain and monitoring and identification of damage [24-31]. Pereira et al. [30] illustrated the efficacy of FBG sensors in measuring strain within unidirectional fiber reinforced systems. The strategic placement of these sensors along the fiber direction within the matrix has been instrumental in confirming the relationship between the measured strain and the readings from the FBG sensors. Furthermore, numerous studies in the literature have highlighted the ability of FBG sensors to identify defects in PMC materials by observing alterations in dynamic strain signals, a method elaborated in references [18,31,32].

Figure 5(a-c): Manufacturing Process and Data Acquisition Systems: (a) Hot Compression Molding with Stacked Prepreg Strips, (b) Micron Optics sm130 Retrieving Strain and Temperature Data from FBG Sensors and (c) Ipetronik M-Thermo 16 Measuring Temperature from Embedded TCs
Table 1: An Overview of Fabricated Laminated ComBeam Samples: Number of Prepreg Layers and Geometric Specifications (Length, Width and Thickness)
| Sample Name | Total Number of Prepreg Layers | Dimensions (Length x Width x Thickness) (mm) |
| ComBeam 1 | 260 | 1600 x 100 x 52 |
| ComBeam 2 | 260 | 1600 x 100 x 52 |
| ComBeam 3 | 280 | 1600 x 100 x 56 |
| ComBeam 4 | 350 | 1600 x 100x70 |
| ComBeam 5 | 350 | 1600 x 100 x 70 |
| ComBeam 6 | 350 | 1600 x 100 x 70 |
| ComBeam 7 | 350 | 1600 x 100 x 70 |
| ComBeam 8 | 350 | 1600 x 100 x 70 |
Our research adds to the current state-of-the-art techniques by utilizing embedded FBG sensors, in conjunction with other sensors such as strain gauges and load-deflection sensors, within a specialized testing configuration tailored for thick composite materials. Specifically, our investigation employs these integrated sensors in both static and dynamic testing scenarios to evaluate the response of PMCs to varying loads.
The stiffness of PMC coupons was assessed through the implementation of a three-point bending test, adhering to the standards set by the American Society for Testing and Materials (ASTM) D790 [33]. The coupon samples, measuring 100 mm in length, 15.26 mm in width and 5.20 mm in thickness (comprising 26 layers of unidirectional prepreg), were tested using an Instron 5982 universal testing machine (Instron, Norwood, MA, USA) as illustrated in Figure 6. The testing arrangement featured an 80 mm support span, with an applied force of 2763 N, which corresponds to 80% of the ultimate tensile strength of 300 GSM OM11 Prepreg, at a constant frequency of 1 Hz.
This system replicates the operational conditions of leaf springs in heavy commercial vehicles (HCVs), incorporating a 250 kN capacity MTS servo hydraulic actuator (MTS Systems Corp., Eden Prairie, MN, USA) mounted on seismic test plates. The testing procedure entailed controlled displacements to accurately assess force and displacement, reflecting the actual conditions of the environment (Figure 7).
In static stiffness tests, samples experienced a displacement of 75 mm at a frequency of 0.2 Hz utilizing a hydraulic actuator. Alongside stiffness measurements, the FBG sensors were calibrated against the SG results during these static evaluations. This calibration was essential for guaranteeing the precision of strain measurements and validating the FBG sensor data, thus providing a dependable assessment of the stiffness of the ComBeam.
For the dynamic fatigue tests, ComBeam 5 was subjected to cyclic displacements varying from 35 mm to 70 mm at a frequency of 1 Hz, while ComBeam 6 was evaluated at 0.5 Hz with displacements ranging from 5 mm to 70 mm. These tests investigate the impact of increased displacement on the material's fatigue life.
Structural Health Monitoring (SHM) was implemented using FBG sensors and linear SGs during three-point bending tests. Specifically, ComBeam samples 5 and 6 were equipped with L2A series linear SGs from Micro Measurements (Raleigh, NC, USA). The experimental configuration included a high-precision data acquisition system that integrated the FBG sensors with Micron Optics sm130 optical sensor interrogators operating at 25 Hz for accurate strain measurement. Furthermore, load cell outputs and hydraulic actuator movements were recorded at 50 Hz using an MTS Flex 100 Controller, further augmented by Siemens LMS SCADAS mobile DAQ systems (Siemens Digital Industries Software, Plano, TX, USA) for comprehensive data collection from the SGs. Thermocouples (TCs) were also positioned on the surface of ComBeam samples to monitor thermal effects during fatigue testing, which is vital for comprehending temperature-related changes that could influence the FBG sensor results. The nCode GlyphWorks 2023 software was employed to process all collected data, including λB, strain, load and displacement.
Figure 6: Coupon sample in a three-point bending test on the Instron 5982 test system aligned with ASTM D790 standards [33]
Figure 7(a-b): (a) Schematic representation of the three-point bending test system for thick composite laminated beams with and (b) photograph of the test system with integrated data collection systems
Figure 8(a-b): FE models correlating with physical test conditions. Points A and B represent the support areas, while point C indicates the location where the force is applied, (a) Depicts a coupon sample in accordance with ASTM D790 standards [33] and (b) shows a real-sized ComBeam, both designed to mirror the experimental setup for accurate simulation of the physical tests
Finite Element Analysis of the Laminated Composite Beams
A comprehensive FEA of composite structures was performed, encompassing both coupon samples and real scale laminated ComBeams. The Ansys 2023 software was used to develop the FE models. These models were constructed to accurately reflect the experimental conditions of the physical tests, as illustrated in Figure 8.
In the Finite Element Method (FEM), shell models are created utilizing material properties derived from standard coupon tests performed under ambient conditions, as outlined in Table 2. These properties are incorporated into the FE model, which is based on a cured ply thickness of 0.2 mm. It is assumed that the layers are perfectly bonded within the FEM framework. The stiffness analysis includes scenarios both with and without Geometric Nonlinearity Analysis (GNA), which is essential for comprehending structural behaviors under substantial loads and improving the precision of predictions that extend beyond fundamental linear elasticity assumptions [34].
Figure 9(a-b): FE model setup for ComBeam samples, (a) Demonstrates the boundary conditions aligned with physical test constraints with support points and (b) Showcases the model’s precision meshing using 5 mm×5 mm sized SHELL281 type Quad 8 elements
Table 2: Material Properties of 300 GSM OM11 Prepreg Obtained from Coupon Samples
Material Type | Material Property | Experimental Result | Material Property | Experimental Result |
Prepreg | Ex (GPa) | 43.3 | (σx)T (MPa) | 881.35 |
Ey (GPa) | 10.91 | (σy)T (MPa) | 51.54 | |
Ez (GPa) | 10.91 | (σz)T (MPa) | 51.54 | |
γxy | 0.12 | (σx)C (MPa) | -637.34 | |
γyz | 0.12 | (σy)C (MPa) | -176.74 | |
γxz | 0.31 | (σz)C (MPa) | -174.74 | |
Gxy (GPa) | 5.07 | τx (MPa) | 71.05 | |
Gyz (GPa) | 4.23 | τ y (MPa) | 45.71 | |
Gxz (GPa) | 5.07 | τ z (MPa) | 71.05 | |
Resin | ρ (kg/m³) | 1.116 | γ | 0.35 |
E (GPa) | 3.78 | τ (MPa) | 1400 |
Table 3: List of Samples with their Prepreg Layer Count, Dimensions and a Column for Mesh Elements, Detailing Variations in Structure for the FEA
| FEM Code | Sample Name | Total Number of Prepreg Layers | Dimensions (mm) (Length×Width×Thickness) |
| FEM 26 | Coupon Sample | 26 | 100×15.26×5.2 |
| FEM 260 | ComBeam 1, 2 | 260 | 1600×100×52 |
| FEM 280 | ComBeam 3 | 280 | 1600×100×56 |
| FEM 350 | ComBeam 4, 5, 6 | 350 | 1600×100×70 |
The results of computational stiffness were evaluated against empirical data obtained from physical experiments to confirm the validity of the FEM approach, emphasizing the GNA's effectiveness in predicting intricate real-world structural behaviors.The finite element models for coupon samples and full-scale ComBeams, as outlined in Table 3, were meticulously crafted to faithfully reproduce the configurations and variations in thickness, thus improving the reliability of the simulations.
In accordance with the limitations of the physical tests, the boundary conditions for the models were defined, as illustrated in Figure 9a. At the support points, the models were permitted unrestricted movement in the x-direction and rotation about the y-axis. Conversely, movements in the y and z directions, along with rotations around the x and z axes, were constrained to simulate the physical conditions.
Meshing was executed with accuracy utilizing SHELL281 type Quad 8 mesh elements, as illustrated in Figure 9b, featuring mesh sizes of 5 mm×5 mm. A total of 6400 shell elements were incorporated for the ComBeam FE models (FEM 260, 280 and 350), along with 400 elements with sizes of 2 mm×1.9 mm for the coupon model (FEM 26).
Forces of 1 kN, 100 kN, 115 kN and 170 kN were applied to the FEM 26, FEM 260,FEM 280 and FEM 350 models, respectively. These force magnitudes were selected to simulate the quasi-static three-point bending test conditions observed in the experiments. The static test results of strains obtained from the embedded FBG sensors and SGs were corroborated with the FEA outcomes, which facilitated the alignment of the FE models with actual experimental data.
Investigation of Cure and Post-Cure Processes
This section presents the findings from the HP-DSC studies and the experimental investigations conducted during the curing and post-curing phases. The data acquired through FBG sensor and TC measurements at various stages of manufacturing is crucial for elucidating the material's response to thermal and pressure conditions. Such information enables us to evaluate the evolution of internal stress and thermal fluctuations, both of which are essential for assessing the quality and reliability of the composite structure. Throughout these processes, the material's response was scrutinized, with a focus on obtaining a quantitative assessment of the curing behaviors, which enhances our understanding of the residual stresses that remain during the post-cure phase.
The HP-DSC studies, illustrated in Figure 10a, reveal a minimal dependency of heat flow on pressure as it ranges from 1 MPa to 6 MPa. This observation is consistent with prior research indicating that variations in pressure do not affect the curing characteristics of uncured epoxy-based prepreg materials [35]. A slight reduction in average heat flow with increasing pressure implies negligible effects on the rates of exothermic reactions. The material demonstrates consistent responses to both heat and pressure, with stable standard deviation levels across different pressure settings. Furthermore, Figure 10b shows that the degree of curing remains relatively constant over time under varying pressures, thereby confirming that pressure does not significantly alter the degree of curing.
Figure 10(a-b): Thermal behavior and curing process of the OM11 resin system under varying pressures via HP-DSC, (a) Minor heat flow variations with increasing pressure, indicating a consistent thermal response and (b) The average degree of curing remains unaffected by pressure changes, underscoring the stable curing characteristics of the resin across different pressure levels

Figure 11. Wavelength variations of four FBG sensors in ComBeam 5 during curing and cooling phases
As the pressure is gradually increased from 1 MPa to 6 MPa, the observed onset temperatures show minimal variation, recording values of 112.86°C, 112.85°C, 112.46°C and 111.30°C, respectively. This indicates that curing temperatures remain stable despite the fluctuations in pressure. However, it is crucial to recognize that while the HP-DSC studies reveal a negligible effect on the curing behavior within this pressure range, real-world manufacturing situations, such as the fabrication of full-sized components like ComBeam samples, tell a different story. In these practical manufacturing contexts, elements such as the consistent impregnation of resin within the composite structure, the dynamics of resin flow and the occurrence of voids are significantly affected by the applied pressure. This difference highlights the limitations of HP-DSC in addressing the complexities that are inherent in actual manufacturing processes, especially regarding resin voids, their distribution and resin impregnation. Although HP-DSC provides important insights into material behavior under controlled laboratory conditions, it does not fully capture the complexities encountered in real manufacturing environments. This emphasizes the necessity of combining laboratory research with practical manufacturing experiences to achieve a thorough understanding of material properties and their processing techniques.
Figure 11 illustrates the Bragg Wavelength Shift (∆λB) of ComBeam 5 as recorded by FBG sensors 1 to 4, with the sensor locations specified in Figure 2a. The data begins with the stacked prepreg strips at ambient temperature and progresses through the manufacturing and cooling stages until equilibrium with the ambient temperature is achieved. The ∆λB (Y-axis), measured in nanometers, reflects changes in strain and/or temperature, while the X-axis represents time in minutes. A notable significant shift in the wavelength is observed during the curing phase, indicating a response to the exothermic nature of the chemical reactions occurring within the composite, as well as the mechanical stresses that arise when the pressure of the hydraulic press is increased. The decline in the Bragg wavelength curve following the peak signifies the completion of the exothermic reaction and a relaxation of internal stress. The cooling phase depicted in the graph commences once the mold is opened and persists until equilibrium with the ambient temperature is reached.
Table 4: Residual Strain Measurements for ComBeam 5 and ComBeam 6 Samples Using FBG Sensors
| Sample Name | FBG # | Residual Strain after Curing (με) | Calibrated Residual Strain after Curing (με) | Residual Strain after Post-Curing (με) | Calibrated Residual Strain after Post-Curing (με) | Post-Cure Calibrated Strain Change (%) |
ComBeam 5 | FBG 1 | -560 | -636 | -441 | -501 | 21% |
ComBeam 5 | FBG 2 | -469 | -631 | -383 | -515 | 18% |
ComBeam 5 | FBG 3 | -798 | -836 | -746 | -782 | 7% |
ComBeam 5 | FBG 4 | -537 | -566 | -499 | -526 | 7% |
ComBeam 6 | FBG 1 | -577 | -561 | -500 | -487 | 13% |
ComBeam 6 | FBG 2 | -749 | -782 | -679 | -708 | 9% |
ComBeam 6 | FBG 3 | -967 | -911 | -876 | -825 | 9% |
ComBeam 6 | FBG 4 | -591 | -578 | -482 | -472 | 18% |
Figure 12(a-b): The ∆λB as recorded by FBG sensors during the curing process of (a) ComBeam 5 and (b) ComBeam 6
Figure 11 illustrates that at the conclusion of the cooling phase, when the entire structure attains ambient temperature, the FBG 3 sensor, located at the center of the cross-section, undergoes the most significant negative shift in λB. Given that the structure is also at ambient temperature at the onset of the process, the thermal influence on the shift, as described by Equation (1), can be disregarded. This finding regarding ∆λB indicates that residual stress differs by cross-sectional location, reaching its maximum in the central region where the most substantial exothermic temperature increase is noted during curing. To further clarify this outcome, the ∆λB were analyzed to assess residual strain in ComBeam 5 and ComBeam 6. This finding aligns with results from earlier research [36,37], which highlight the significance of residual strains as indicators of manufacturing inconsistencies. A detailed examination of the residual stress at each sensor location, both after curing and during the post-curing phase, is provided in Table 4, which enumerates the residual strain values following curing and throughout the post-curing stages, along with the percentage change in residual strain that reflects the relaxation of the composite material over time. The calibrated residual strain values for the FBG sensors have been obtained using the CCs computed in Section 3.2.
Table 4 illustrates the analysis of measurement and calibration of residual strains utilizing FBG sensor readings for ComBeam 5 and ComBeam 6, providing comprehensive CCs. The initial measurements taken post-curing reveal variations in residual strain from -469 to -798 µε in ComBeam 5, with FBG 3 documenting the peak value. Following the post-curing process, these values adjust to -383 to -746 µε, signifying a decrease in internal stresses. The percentage change in residual strain for the sensors in ComBeam 5 varies from 7% to 21%, with FBG 1 reflecting the most significant reduction. Likewise, during the post-curing stage of ComBeam 6, a decrease in residual strain is observed. For example, FBG 1 shows a strain of -577 µε, which reduces to -500 µε, indicating a 13% reduction in in-plane residual strain. The percentage change in residual strain for ComBeam 6 ranges from 9% to 18%, implying that the composite material progressively alleviates internal stresses over time as a result of the differing curing processes. The residual strain values recorded after the curing and post-curing phases, along with the percentage change in residual strain, demonstrate the relaxation of the composite material over time.
Figure 12 illustrates two distinct consolidation methods and their impact on the recorded FBG sensor data concerning ∆λB, specifically for ComBeam samples 5 and 6 during the curing phase. Each graph depicts the shift for individual sensors (FBG 1 to FBG 4), reflecting the material's response to thermal and mechanical stresses throughout the procedure. These shifts are directly associated with the increase in the pressure applied by the hydraulic press and the temperature variations during the process (including mold heating and exothermic reactions), as well as the potential formation of residual strain due to the curing reactions. The vertical lines in

Figure 13: Thermocouple measurements illustrating the temperature variations of ComBeam 7 throughout the manufacturing stages

Figure 14(a-b): Detailed thermocouple measurements during the curing process for (a) ComBeam 7 with the mold heating system set to 130°C oil temperature and (b) ComBeam 8 with the mold heating system set to 110°C oil temperature
Figure 12 denote press movements, which encompass press closing, intermediate pressure increments and press opening times, all of which are correlated with the timing of the ∆λB. The inset figures illustrate the positioning of the sensors within the ComBeams. For the curing process of ComBeam 5 (Figure 12a), the force is initially set at 750 kN and subsequently raised to 2000 kN after 5 minutes. Conversely, ComBeam 6 (Figure 12b) is subjected to direct compression with 2000 kN from the outset.
In Figure 12a, it is clear that when the press is closed and pressure is applied to the composite structure, a slight increase in the wavelengths of all FBG sensors is noted. This occurrence is attributed to the enhanced contact between the composite layers under pressure, which generates tensile stresses on the FBG sensors. The sensors that are nearest to the surface of the ComBeam demonstrate a rapid increase in wavelength due to the swift transfer of heat from the mold. Among the sensors, FBG 1 and FBG 2 exhibit the quickest initial wavelength increase, followed by FBG 4 and FBG 5. Despite FBG 4 and FBG 5 being positioned near the surface, their placement between inner layers results in a slower heat transfer from the mold, leading to a more gradual increase in wavelength. Located at the midsection of the beam structure, sensor FBG 3 undergoes the slowest heat transfer from the mold, resulting in a relatively slower increase in wavelength. Sensor FBG 3 displays the most significant change in wavelength among all sensors, as the heat produced by the curing reaction takes longer to dissipate to the mold and the surrounding environment, a fact supported by the TC measurements presented in Figure 13. The other sensors, being closer to the mold surface, experience a quicker heat dissipation of the exothermic reaction by the mold. Assuming that the FBG 1 sensor attains the mold temperature in approximately 10 minutes, it can be deduced that the curing process concludes around the 110th minute, as the wavelength changes for FBG 1 remain consistent between the 10th and 110th minutes. A similar general discussion is applicable to the ComBeam in Figure 12b, although the patterns of wavelength changes among the FBG sensors vary.
These variations are likely attributable to the differing consolidation procedures, as previously mentioned, along with statistical variations in manufacturing processes. Consequently, when pressure is applied and subsequently increased, the embedded FBG sensors adhere or bond more effectively to the composite layers in which they are embedded. Due to the gradual application of consolidation pressure, the resin can flow smoothly at the mold temperature without disturbing the positioning of FBG sensors or altering the thermal field in their vicinity. This leads to the FBG sensors experiencing a uniform wavelength change within the structure induced by stress and temperature fields. If the pressure is applied rapidly rather than incrementally, the resin attempts to flow quickly towards the lateral surfaces of the composite structure, resulting in fluctuating changes in the wavelengths of the FBG sensors.
A detailed investigation into the thermal changes during the curing process of ComBeam 7 and 8 samples is demonstrated in Figure 14. This figure depicts temperature changes using the TCs (TC 1 to TC 5), illustrating the thermal variations occurring in the ComBeam samples over a 90-min period, illustrating the distinct thermal responses and peak temperatures characteristic on the curing behavior of each ComBeam. The extensive temperature data presented here have been carefully analyzed, shedding light on a wide range of heat transfer mechanisms involved in the cases of ComBeam 7 and 8.
Figure 15: Central region of a ComBeam 7 sample cross-section: over-curing manifested by red hue intensification and subsequent resin degradation, indicative of elevated exothermic activity
The oil temperature in the mold heating system was set to 130°C for the curing process of ComBeam 7, considering the peak temperature of the HP-DSC results mentioned in Figure 10a. However, even with the mold heating system set to 130°C, there is an approximate 5°C difference between the upper and lower mold temperatures, as indicated by the curv.
The adjustment is designed to prevent overcuring and assist the material in achieving its optimal state for property enhancement. This is consistent with the research conducted by Q. Liang and colleagues, which highlights the crucial role of heating rate in curing kinetics [35]. Another element contributing to non-uniformity is depicted in Figure 14, where variations in heating rates across different sections of the ComBeam samples are shown to affect the characteristics of the cured composite in distinct ways. Despite the calibrated settings, the highest surface temperatures recorded by TC 1 and TC 5 surpass the intended values. This suggests a vigorous exothermic reaction within the resin system, leading to temperatures exceeding the controlled mold temperature, which could considerably influence the curing behavior and the overall mechanical properties of the ComBeam samples. For ComBeam 7, surface temperatures were recorded at 142.67°C and 139.79°C, while ComBeam 8 exhibited surface temperatures of 120.59°C and 114.30°C. These measurements were affected by both the mold heat and the exothermic reaction from the curing process. The internal temperatures measured by TC 2 and TC 4, located 8 mm from the surface, offer valuable insights into the thermal dynamics within the composite. ComBeam 7 shows higher temperatures compared to ComBeam 8, with peak internal temperatures reaching 153.40°C and 143.98°C, respectively. In contrast, ComBeam 8 displays slightly lower temperatures of 120.15°C and 123.99°C. Furthermore, TC 3, responsible for monitoring core temperatures, records maximum values of 221.5°C for ComBeam 7 and 184.82°C for ComBeam 8. These elevated core temperatures arise from exothermic reactions taking place at the core of the composite during the curing process, as further illustrated in the cross-sectional view of Figure 15, which depicts overcure and resin degradation. At these elevated temperatures, deeper layers of the composite structure experience diminished heat dissipation due to lower thermal conductivity.
Temperatures have reached 153.40°C and 143.98°C, respectively. Conversely, ComBeam 8 exhibits slightly lower temperatures of 120.15°C and 123.99°C. Additionally, TC 3, which is responsible for monitoring core temperatures, records maximum values of 221.5°C for ComBeam 7 and 184.82°C for ComBeam 8. These elevated core temperatures are a result of exothermic reactions taking place at the core of the composite during the curing process, as further illustrated in the cross-sectional view of Figure 15, which depicts overcure and resin degradation. At these high temperatures, the deeper layers of the composite structure experience diminished heat dissipation due to lower thermal conductivity. As a result, heat accumulates in the core, intensifying the exothermic reaction and leading to increased temperatures. This phenomenon highlights the necessity of effectively managing heat during the curing process to ensure uniform curing while avoiding the risk of thermal degradation.
Temperature measurements underscore the significance of accurate thermal management during the curing process to avert material degradation and maintain the integrity of composites. Lower mold temperatures for ComBeam 8 mitigate core overheating; however, they also prolong the cycle time by ten minutes, illustrating a compromise between thermal regulation and manufacturing efficiency. The TC data, in conjunction with FBG sensor data that maps strain and temperature variations, offers a thorough understanding of material behavior under thermal stress. This dual-sensor methodology correlates internal temperature with strain, pinpointing areas of high thermal stress that could lead to deformation or structural vulnerabilities. By enhancing predictability and control over the curing process, this approach propels advancements in composite manufacturing, ensuring both integrity and stability.
Investigation of Static Three-Point Bending Results of Composite Beams with Finite Element Analysis Correlation
This study presents the outcomes of static three-point bending tests performed on a selection of laminated ComBeams. Out of six samples tested, two were fitted with embedded FBG sensors and surface-mounted strain gauges. This section also addresses the calibration studies of the FBG sensors, which facilitate the measurement of internal strains, yielding critical insights. A comprehensive strategy was employed to integrate calibrated sensor data with Finite Element Analysis (FEA) to deepen the understanding of material behavior under bending stresses. Specifically, the stiffness of each ComBeam was meticulously assessed, taking into account its internal strain distribution, to ensure a complete evaluation of stiffness and structural integrity under varying stress conditions. The static three-point bending test was executed on each ComBeam sample, as illustrated in Figure 7. The force-displacement outcomes of the static three-point bending test from the MTS servo hydraulic actuator are shown in Figure 16a for each thickness of the ComBeam samples. This test was designed as a displacement-controlled.
Table 5: Comparison of Stiffness Measurements in ComBeam Samples: Empirical Test Results vs. FEA with and Without LD
| Sample Name | Experimental Result of Stiffness (N/mm) | FEM Stiffness (Non-LD) (N/mm) | FEM Stiffness (LD) (N/mm) | Test Results vs. FEM (NonLD) (%) | Test Results vs. FEM (MD) (%) |
| Coupon | 675.1 | 693.2 | 714.3 | -3% | -6% |
| ComBeam 1 | 1054.3 | 989.2 | 1039.0 | 6% | 1% |
| ComBeam 2 | 1017.3 | 989.2 | 1039.0 | 3% | -2% |
| ComBeam 3 | 1251.7 | 1232.8 | 1263.7 | 2% | -1% |
| ComBeam 4 | 2326.8 | 2386.1 | 2373.3 | -3% | -2% |
| ComBeam 5 | 2351.6 | 2386.1 | 2373.3 | -1% | -1% |
| ComBeam 6 | 2348.7 | 2386.1 | 2373.3 | -2% | -1% |

Figure 16(a-b): Force-displacement results; (a) Force-displacement curves for thick ComBeam samples and (b) Comparison of FE simulations with experimental stiffness measurements under specified loading conditions
The low-frequency assessment primarily focuses on measuring stiffness, calibrating the FBG sensors and recording strain through both the FBG sensors and SGs at specified sensor locations, as depicted in Figure 3. This systematic methodology is vital for collecting precise and thorough data necessary for an in-depth analysis of the mechanical properties and structural integrity of the ComBeam samples, as well as for linking these results with FEM predictions utilizing GNA. The force-displacement relationships derived from the FEM simulations are in close agreement with the outcomes of the static three-point bending tests, as shown in Figure 16b. This strong correlation demonstrates the reliability of the FEM in forecasting the mechanical behavior of the ComBeam samples when subjected to load. Furthermore, stiffness metrics, which are essential for evaluating structural integrity, are thoroughly summarized. These metrics encompass results from the FEAs, where LD effects were taken into account to accurately represent material behavior under different stress levels. This integration significantly improves the predictive accuracy of FEM models, effectively bridging the divide between theoretical simulations and empirical physical testing outcomes.
Consequently, the significance of LD effects in ComBeams during FE analysis is emphasized when juxtaposed with the empirical data presented in Table 5. Incorporating LD effects is essential for precise modeling of LD modes, thereby enhancing the model’s accuracy, particularly under elevated load conditions. Table 5 illustrates that FEA incorporating LD effects predicts experimental stiffness values for thicker samples with greater precision. For example, for a thickness of 70 mm, the GNA forecasts a stiffness of 2373.3 N/mm, whereas the non-LD model estimates 2386.1 N/mm, compared to the experimental measurement of 2326.8 N/mm. The GNA model demonstrates accuracy within -2%, showcasing its capability to consider nonlinearities, in contrast to the non-LD model’s -3% deviation.
Nevertheless, the FE analyses uncovered notable discrepancies in thinner samples, such as the ‘Coupon Sample’ with a thickness of 5.2 mm. In this instance, the LD analysis predicted a stiffness of 714.3 N/mm, deviating by -6% from the experimental result of 675.1 N/mm, compared to a closer -3% deviation by the non-LD analysis. This deviation suggests that while LD analysis significantly enhances accuracy for thicker samples by effectively addressing LD modes, its application in thinner samples may not consistently achieve the same degree of accuracy.
The empirical correlation between simulated and actual test outcomes emphasizes the necessity of integrating LD effects. The data reveal that the relevance of LD escalates with the structural complexity of the material, as indicated by its thickness. This is particularly evident in the comparison of stiffness values between LD and non-LD analyses, especially as the samples increase in thickness. For example, ComBeam 5 and ComBeam 6 consistently exhibit a -1% deviation favoring the LD analysis when juxtaposed with the experimental results, underscoring the enhanced accuracy of LD analysis in these instances.

Figure 17(a-i): Geometrically Nonlinear Analysis under 170 kN load via FEM350 model depicting strain distribution at FBG sensor and SG points of experimental setup. The inset diagrams detail the placement of each sensor point within the ComBeam 5 & 6 as: (a) SG 1, (b) SG 2, (c) FBG 1, (d) FBG 2, (e) FBG 3, (f) FBG 4, (g) FBG 5, (h) SG 3 and (i) SG 4
In conclusion, the incorporation of LD effects in FEAs corresponds with theoretical anticipations of heightened accuracy in modeling LD modes. This incorporation signifies a notable progression in the predictive modeling of composite materials under real loading conditions. The strain data obtained from the static three-point bending tests on ComBeam 5 and 6, along with the strain projections derived from the FEM350 model (Figure 17), are detailed in Table 6. The wavelength data recorded by the FBG sensors during the tests were transformed into strain values using Equation (1) with the Ncode 2023 software. This methodology guarantees the evaluation of structural integrity and strain response, illustrating consistency among samples and validating the experimental approach.
Comprehensive strain measurement data collected under a 170 kN load during static three-point bending tests for ComBeam 5 and ComBeam 6, utilizing surface-mounted SGs and embedded FBG sensors, along with strain projections from corresponding sensor points derived from the FEM350 FE model analysis (Table 6).
Nonetheless, the inconsistencies noted during testing, along with variations in the production of the composite material, could lead to alignment inaccuracies in the manufactured FBG sensors, which require additional examination. Research suggests that the precision of FBG sensors may be affected by the development of resin pockets surrounding the embedded fibers or by alterations in fiber orientation throughout the manufacturing process. Enhanced embedding techniques and rigorous quality control are crucial for obtaining precise measurements [38,39].

Figure 18: The Schematic Illustrates the Calibration Configuration of ComBeam Samples, Detailing the Arrangement of SGs and FBG Sensors Across a Cross-Section Aligned Orthogonally to the Neutral Axis
Table 6: In-Depth Strain Measurement Data Acquired Under a 170 kN Load in Static Three-Point Bending Tests for ComBeam 5 and ComBeam 6 Utilizing Surface-Mounted SGs and Embedded FBG Sensors Paired with Strain Projections from Corresponding Sensor Points Derived from the FEM350 FE Model Analysis
| Sensor Code | Measured Strain of ComBeam 5 (μϵ) | Measured Strain of ComBeam 6 (μϵ) | Strain Obtained by FEM 350 with LD (μϵ) | Strain Deviation (%) for ComBeam 5: Test vs. FE (LD) | Strain Deviation (%) for ComBeam 6: Test vs. FE (LD) |
SG 1 | -12,347.04 | -12,244.74 | -12,091.00 | 1% | 0% |
SG 2 | -4166.13 | -3927.65 | -4224.80 | -1% | -7% |
SG 3 | 13,101.35 | 13,055.75 | 12,144.00 | 7% | 7% |
SG 4 | 4093.95 | 3828.28 | 4301.80 | -5% | -12% |
FBG 1 | -10,227.64 | -11,836.98 | -11,388.00 | -11% | 4% |
FBG 2 | -2922.20 | -3551.57 | -3978.80 | -33% | -13% |
FBG 3 | 457.42 | 473.22 | 50.62 | 87% | 91% |
FBG 4 | 5532.65 | 5954.29 | 5321.50 | 4% | 11% |
FBG 5 | 1999.80 | 1905.37 | 1882.80 | 6% | 1% |
Furthermore, variations in strain measurements may occur due to the dispersion of material properties across the beam's cross-sections. Inhomogeneities caused by uneven temperature and pressure distributions during processing can lead to a shift in the neutral axis, resulting in strain distributions that deviate from those predicted in the Finite Element (FE) model [40,41]. Tackling these challenges in the future will improve the precision and applicability of sensors designed for critical strain measurements.
The data from the FBG sensors were carefully calibrated against the readings obtained from the surface-mounted Strain Gauges (SGs) and the FE results presented in Table 6, in order to rectify any possible misalignments of the FBG sensors within the composite structures. Figure 18 provides a schematic representation of the instrumented ComBeam samples, highlighting the embedded FBG sensors located at two significant positions. The cross-sectional dimensions of the beam, along with the exact placements of the FBG sensors and SGs in relation to the compression (+h) and tension (-h) areas, are also illustrated in Figure 18. The FBG 1 and FBG 4 sensors are positioned at Location 1, calibrated with SG 1 and SG 3, respectively; likewise, the FBG 2 and FBG 5 sensors at Location 2 are calibrated with SG 2 and SG 4. All sensors are situated on the same cross-section, oriented perpendicular to the neutral axis.
Addressing these issues in the future will enhance the accuracy and practicality of sensors for critical strain measurements. The FBG sensor data were meticulously calibrated against readings from the surface mounted SGs and the FE results listed in Table 6 to correct any potential misalignments of the FBG sensors within the composite structures. Figure 18 illustrates the schematic of the instrumented ComBeam samples, showing embedded FBG sensors at two critical locations. The cross-sectional dimensions of the beam and the precise locations of the FBG sensors and SGs relative to the compression (+h) and tension (-h) regions are also depicted in Figure 18. The FBG 1 and FBG 4 sensors are aligned at Location 1, calibrated with SG 1 and SG 3, respectively; similarly, the FBG 2 and FBG 5 sensors at Location 2 are calibrated with SG 2 and SG 4. All sensors are positioned on the same cross-section, perpendicular to the neutral axis.
Strategic placement of the SGs, in proximity to the FBG sensors, ensures the accuracy of the strain correlation. Reference Points (RPs) 1 and 2 designate specific positions on the neutral axis critical for determining the CC of sensor FBG 3. The CC at RP 1 is computed as the mean of the CCs for the FBG 1 and FBG 4 sensors. Conversely, the CC at RP 2 is derived from the CCs of the FBG 2 and FBG 5 sensors. Subsequently, the CC for sensor FBG 3 is calculated by averaging the CCs obtained at RPs 1 and 2.
Once calibrated, the sensor data enables an accurate depiction of the strain variation across the cross-section of the beam, denoted as gxx(z), which can be described by the following linear relationship:
gxx(z) = a0+a11.z
(2)
Where, z is the distance from the neutral axis and ao and all are the coefficients determined from the strain readings at the extreme fibers of the cross-section:
z = ±h
(3)
Table 7: Strain Measurement and Calculation Comparison for ComBeam 5 and ComBeam 6 under a 170 kN Load
Sensor Code | Strains Measured by FBGs: ComBeam 5 (με) | Strains Calculated Via SGs: ComBeam 5 (με) | Calibration Coefficients: ComBeam 5 | Strains Measured by FBGs: ComBeam 6 (με) | Strains Calculated Via SGs: ComBeam 6 (με) | Calibration Coefficients: ComBeam 6 |
FBG 1 | -10,227 | -11,619 | 1.14 | -11,836 | -11,521 | 0.97 |
FBG 2 | -2922 | -3930 | 1.35 | -3551 | -3706 | 1.04 |
FBG 3 | 457 | 479 * | 1.05 * | 473 | 449 * | 0.95 * |
FBG 4 | 5532 | 5830 | 1.05 | 5954 | 5827 | 0.98 |
FBG 5 | 1999 | 1733 | 0.87 | 1905 | 1612 | 0.85 |
The coefficients were calculated using the strains measured at the top surface Exx+ and bottom surface E-xx as follows:

Applying these coefficients, the strain profiles for Location 1 and Location 2 were computed as follows:
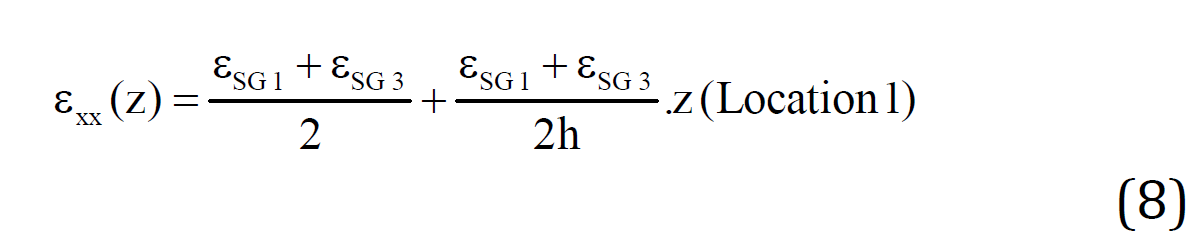
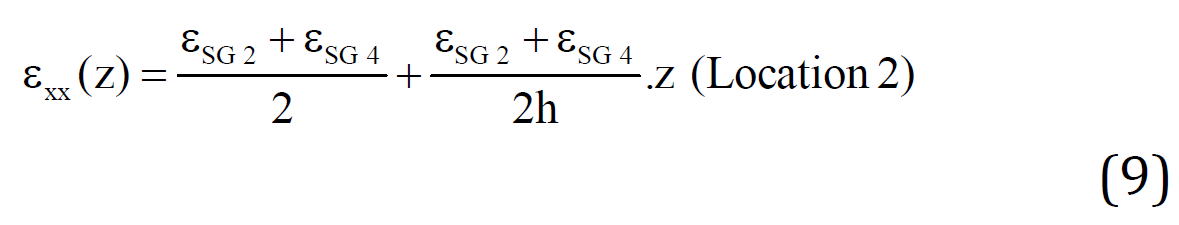
Table 7 presents a crucial dataset for evaluating the performance of FBG sensors in the field of SHM. It compares the strains measured by the FBG sensors in the ComBeams with those calculated from the surface-mounted SGs under a static 170 kN load. This comparison serves to validate the linear strain distribution model and ensure the relia-bility of the FBG sensors before their application in dynamic or fatigue testing scenarios under controlled environments. The calculated strains via surface-mounted strain SGs, derived from Equations 8 and 9, serve as a theoretical baseline against which the FBG measurements were evaluated. Discrepancies between these datasets are crucial for un-derstanding the real-world applicability of the linear strain distribution model. It was observed that the strains measured by the FBG sensors exhibit variance when compared to the SGs calculations, necessitating the use CCs. These coefficients are crucial for adjusting the raw FBG data to align with the expected strain values, thereby ensuring the precision of structural assessments.
As discussed in the literature, the angular relationship between the sensor axes is crucial; an optimal angle enhances accuracy, while any deviation may lead to errors in the recorded strain data. This sensitivity to orientation can greatly affect the readings of FBG sensors, making precise calibration essential to ensure that tangential strain components are accurately distinguished and the influence of radial strains, which can act as noise, is minimized [38].
Integrating FBG sensors into composite structures has a significant effect on the effective measurement of strains due to the complex strain field surrounding the sensors. These sensors are passive and integral elements of the mechanical dynamics within the composite matrix, subjected to effects such as stress concentration and variations in material properties [39]. This complex interaction with the environment requires a robust calibration protocol to accurately assess strain.
The detailed calibration coefficients calculated affect the post-processing of the raw data obtained from the FBG sensors to ensure that the measured strain values align closely with those from surface-mounted Strain Gauges (SGs) and the theoretical predictions from the Finite Element (FE) model presented in Table 8. This calibration process is vital for reducing the impact of external factors such as temperature fluctuations and mechanical stress during the embedding process, necessitating a comprehensive approach for effective Structural Health Monitoring (SHM). The calibration strategy, formulated through thorough analysis and empirical data, including strain results from the FE analysis, represents a systematic iteration aimed at enhancing sensor accuracy through methodical adjustments and subsequent validations [25-27]. Progress in structural engineering depends on this meticulous approach for dependable strain measurements, as it establishes an effective framework for utilizing FBG sensors in monitoring the integrity of composite structures.
When comparing the data obtained from the FBG sensors with the FEA outlined in Table 8, it becomes clear that the calibration of the FBG sensors increasingly corresponds with the FE predictions illustrated in Figure 17, particularly when taking into account the calibrated experimental results. Nevertheless, a significant deviation persists for the sensor positioned on the neutral axis. This discrepancy can be linked to the FE analysis’s presumption of uniform material properties, which does not accommodate the variations introduced by manufacturing processes, especially exothermic reactions. Such variations have a considerable effect on sensor accuracy, as previously discussed in Section 3.1, offering a contrasting viewpoint between empirical data and theoretical models. This highlights the necessity of acknowledging manufacturing-induced material inconsistencies in both sensor calibration and FE analysis, emphasizing the requirement for enhanced modeling techniques that reflect the complex realities of material behavior. Variations in material properties throughout the cross-section also play a role in the observed strain deviations [39]. These variations may result in shifts in the material’s neutral axis, thus undermining the assumptions of a linear strain distribution model. Such shifts are affected by factors including the thermal conductivity of the composite, the autocatalytic characteristics of curing reactions and the parameters of the curing process.
Moreover, stress concentrations impacting FBG sensors located between different layers within the cross-section of composite samples fluctuate due to the varying pressure and temperature effects on each embedded FBG sensor during the manufacturing process. These complexities highlight the importance of considering such variables to guarantee accurate strain measurements and emphasize the need for thorough approaches in material characterization and sensor calibration [38,40].
Table 8: Comparative Analysis of Measured and Calibrated FBG Strain Versus FE Model Predictions for ComBeam 5 and 6
| Sensor Code | Measured Strain of ComBeam 5 (με) | Measured Strain of ComBeam 6 (με) | Calibrated Strain of ComBeam 5 (με) | Calibrated Strain of ComBeam 6 (με) | Strain of FEM350 with LD (με) |
| FBG 1 | -10,227.64 | -11,836.98 | -11,619.95 | -11,521.87 | -11,388.00 |
| FBG 2 | -2922.20 | -3551.57 | -3930.13 | -3705.54 | -3978.80 |
| FBG 3 | 457.42 | 473.22 | 479.36 | 445.97 | 50.62 |
| FBG 4 | 5532.65 | 5954.29 | 5830.38 | 5827.04 | 5321.50 |
| FBG 5 | 1999.80 | 1905.37 | 1733.93 | 1625.04 | 1882.80 |
The table outlines the calibrated strains captured by the FBG sensors versus those predicted by the FEM350 model with LD
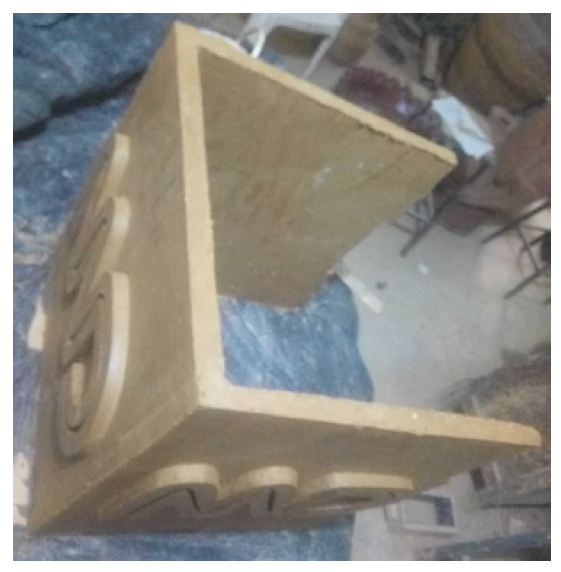
Figure 19(a-b): Graphical data from three-point bending fatigue tests on (a) ComBeam 5 and (b) ComBeam 6
Dynamic Three-Point Bending Tests on Composite Beams with Integrated Health Monitoring
Based on insights gathered from the CCs during static evaluations, this research investigated the dynamic fatigue characteristics of ComBeam 5 and ComBeam 6 under cyclic fatigue test conditions. The TC measurements reveal minimal temperature generation on the surface during 1 Hz fatigue tests with 35 mm displacements, permitting the utilization of the FBG sensors to monitor the mechanical properties of ComBeam specimens without interference from thermal noise. In dynamic tests, the premature failure of surface-mounted SGs around 10,000 cycles highlights the robustness and reliability of FBG sensors, which operated flawlessly up to 158,000 cycles in the testing of ComBeam 5. This test was successfully concluded, surpassing the strength benchmark set by the leaf spring and showcasing the efficacy of FBG sensors for continuous fatigue monitoring. Figure 19a,b depicts the force-displacement measurements as a function of cycle number for ComBeam 5 and ComBeam 6, respectively. These graphical representations are crucial for analyzing the fatigue behavior of the ComBeams, demonstrating the capabilities of the integrated SHM system.
Mulation of critical damage. This phenomenon was not observed in ComBeam 5 [25]. In contrast, the fatigue characteristics of ComBeam 6, illustrated in Figure 19b, enter this phase after only 1107 cycles. This highlights that larger displacement amplitudes, even at a lower frequency of 0.5 Hz, notably accelerate the onset of critical damage. This rapid progression to failure, as seen in Figure 20.
Consistently indicates that higher displacement amplitudes during cyclic loading expedite the transition to the critical damage phase, thereby diminishing the overall fatigue life of composite materials. This accelerated damage progression, which includes matrix cracking, fiber-matrix debonding and eventual fiber fracture, is attributed to the intensified displacement conditions [26]. The experimental strain data collected by the FBG sensors during the fatigue tests conducted on ComBeam 5 and ComBeam 6, given in Figure 21a and b, respectively, provide a comprehensive comparative analysis of fatigue responses in composite materials. These figures illustrate the variations in maximum strain values, which are crucial for understanding the material’s behavior under cyclic loading. Namely, recalling that the fatigue test is conducted under constant strain conditions, it should be expected that the maximum and minimum values of the FBG strain obtained experimentally would also be constant. As can be seen from these figures, the FBG strain values change as a function of the number of cycles and these changes exhibit a three-region trend similar to the forcecycle number graphs in Figure 19.

Figure 20(a-b): Post-Failure Investigation of ComBeam 6 Following the Three-Point Fatigue Testing, (a) The Images Display the ComBeam 6 Failure and (b) Illustrating the Fracture Location and its Pattern
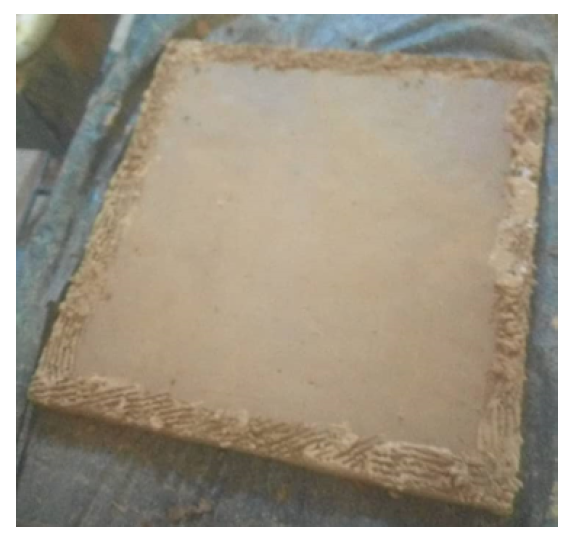
Figure 21(a-b): Microstrain Response of FBG Sensors Embedded in (a) ComBeam 5 and (b) ComBeam 6
This indicates that by monitoring the strain changes due to localized damage under fatigue loads in the material, the remaining useful life of the composite beam structure in terms of fatigue cycles can be predicted [27]. Essentially, the FBG sensors offer insights into internal strain dynamics that external measurements based on displacement alone may overlook. While ComBeam 6 experiences all three stages of the fatigue response, leading to failure within a relatively short testing period as seen in Figure 20, ComBeam 5, due to its longer test duration, does not fail and therefore does not distinctly exhibit the three fatigue phases. The observed variation in strain serves as a crucial indicator of the structural integrity and durability of the composite beams under repetitive loading conditions. These data provide invaluable insights for predicting the service life and formulating maintenance strategies for composite structures across various engineering applications. Scholarly research consistently indicates that higher displacement amplitudes during cyclic loading expedite the transition to the critical damage phase, thereby diminishing the overall fatigue life of composite materials. This accelerated damage progression, which includes matrix cracking, fiber-matrix debonding and eventual fiber fracture, is attributed to the intensified displacement conditions [26]. The experimental strain data collected by the FBG sensors during the fatigue tests conducted on ComBeam 5 and ComBeam 6, given in Figure 21a and b, respectively, provide a comprehensive comparative analysis of fatigue responses in composite materials. These figures illustrate the variations in maximum strain values, which are crucial for understanding the material’s behavior under cyclic loading. Namely, recalling that the fatigue test is conducted under constant strain conditions, it should be expected that the maximum and minimum values of the FBG strain obtained experimentally would also be constant. As can be seen from these figures, the FBG strain values change as a function of the number of cycles and these changes exhibit a three-region trend similar to the force-cycle number graphs in Figure 19. This indicates that by monitoring the strain changes due to localized damage under fatigue loads in the material, the remaining useful life of the composite beam structure in terms of fatigue cycles can be predicted [27]. Essentially, the FBG sensors offer insights into internal strain dynamics that external measurements based on displacement alone may overlook. While ComBeam 6 experiences all three stages of the fatigue response, leading to failure within a relatively short testing period as seen in Figure 20, ComBeam 5, due to its longer test duration, does not fail and therefore does not distinctly exhibit the three fatigue phases. The observed variation in strain serves as a crucial indicator of the structural integrity and durability of the composite beams under repetitive loading conditions. These data provide invaluable insights for predicting the service life and formulating maintenance strategies for composite structures across various engineering applications. Figure 22 compares the microstrain amplitudes of ComBeam 5 and ComBeam 6 throughout the fatigue tests, presenting data in quarter-based intervals of the total test duration. Figure 22a shows continuous strain behavior for ComBeam 5 under a 35 mm displacement amplitude, while Figure 22b illustrates the same for ComBeam 6 under a 65 mm displacement amplitude. The color-coded representation delineates the varied microstrain amplitudes measured by each FBG sensor, indicating the strain distribution across the beams subjected to three-point fatigue testing. Figure 22a demonstrates the consistent cyclic microstrain levels of ComBeam 5, highlighting its robust material performance under repetitive loading conditions. The stability in strain amplitudes across all testing quarters indicates sustained structural integrity, with no signs of catastrophic failure within the test parameters.

Figure 22(a-b): FBG strain measurement data captured at quarter-based percentages of the fatigue tests for (a) ComBeam 5 and (b) ComBeam 6
Figure 22a demonstrates the consistent cyclic microstrain levels of ComBeam 5, highlighting its robust material performance under repetitive loading conditions. The stability in strain amplitudes across all testing quarters indicates sustained structural integrity, with no signs of catastrophic failure within the test parameters. In contrast, Figure 22b depicts notably varying strain field as a function of cycle number during the testing of ComBeam 6. It shows a trend of decreasing maximum strain. In contrast, Figure 22b depicts notably varying strain field as a function of cycle number during the testing of ComBeam 6. It shows a trend of decreasing maximum strain values as the test progresses. This decrease becomes particularly pronounced after reaching the 75% mark of the fatigue test, followed by a sharp decline that leads to material failure after exceeding the 100% fatigue threshold. At the 125% fatigue test status, a significant reduction in strain is observed, indicating the post-failure state of ComBeam 6, as corroborated by Figure 20b. This reduction in strain after failure suggests the loss of material resilience and the breakdown of structural coherence, consistent with the final phase of fatigue life as postulated by theoretical failure models [24-27]. The data from ComBeam 6 exhibit all characteristics leading up to and beyond the failure point, crucial for understanding the total fatigue behavior of the material. The readings from FBG sensors can explicitly track the transition from one phase to another in the fatigue life, providing quantifiable and predictive insights valuable for predicting the end-of-service life for such materials in real-world applications. The reduced strain levels and failures demonstrated in ComBeam 6 correlate well with theoretical models, emphasizing the importance of monitoring composite materials. Thus, FBG sensors show potential as a crucial component in SHM systems. The data presented in Table 9 supplement the strain behavior observed in Figure 22, facilitating a detailed quantitative assessment of the microstrain experienced by ComBeam 5 and ComBeam 6 during the three-point fatigue test. The table identifies the amplitude of microstrain at each condition, providing quantitative data for comparing the strain experienced by the sensors at critical locations throughout the fatigue test. ComBeam 5 shows relatively stable strain values and does not fail even at the 100% fatigue test status, indicating its ability to withstand repetitive loading without structural failure. This consistency in strain amplitude across different test intervals affirms the mechanical integrity observed in Figure 22a, further supporting ComBeam 5’s endurance throughout the testing duration.
Table 9: Absolute Strain Amplitudes from FBG Sensors During Three-Point Fatigue Testing for ComBeam 5 and ComBeam 6 samples
Sample Name | Three-Point Fatigue Test Status (%) | FBG 1 Strain Amplitude (μϵ) | FBG 2 Strain Amplitude (μϵ) | FBG 3 Strain Amplitude (μϵ) | FBG 4 Strain Amplitude (μϵ) | FBG 5 Strain Amplitude (μϵ) |
ComBeam 5 | 0 | 5210 | 1463 | 377 | 2998 | 977 |
ComBeam 5 | 25% | 5096 | 1360 | 367 | 3059 | 898 |
ComBeam 5 | 50% | 5133 | 1361 | 352 | 3088 | 889 |
ComBeam 5 | 75% | 5020 | 1322 | 363 | 3052 | 874 |
ComBeam 5 | 100% (not failed) | 5004 | 1309 | 366 | 3044 | 866 |
ComBeam 6 | 0 | 9655 | 2878 | 414 | 4964 | 1566 |
ComBeam 6 | 25% | 8312 | 2415 | 367 | 4266 | 1341 |
ComBeam 6 | 50% | 8790 | 2583 | 400 | 4533 | 1443 |
ComBeam 6 | 75% | 5093 | 1524 | 235 | 2626 | 829 |
ComBeam 6 | 100% (failed) | 5283 | 1671 | 321 | 2653 | 926 |
ComBeam 6 | 125% | 2282 | 674 | 446 | 1645 | 592 |
The strain response data for ComBeam 6, as outlined in Table 9, demonstrate a dynamic progression, initially characterized by a reduction in absolute microstrain amplitudes. This reduction signifies the presence of internal structural defects within the composite material. As fatigue loading persists, the material exhibits a significant decrease in strain amplitude upon reaching structural failure, as illustrated in Figure 20. The sequence, detailed in the table, elucidates the gradual degradation of the composite under cyclic loading, culminating in a substantial inability to sustain strain, particularly evident in the 125% post-failure strain values. This trajectory corresponds with the insights from Figure 22b, where a notable decrease in strain post-failure is observed, indicating material failure. The observations from Table 9 confirm the efficacy of FBG sensors as diagnostic tools in real-time SHM, validating their effectiveness in capturing critical data that reflect the condition of the material during fatigue testing. The correlation between the strain data from the FBG sensors and the physical evidence of material behavior reinforces the reliability of these sensors in predicting material performance and lifespan in engineered systems. The degradation pattern leading to the ultimate failure of ComBeam 6 aligns with established fatigue failure stages and models discussed in the literature and exemplified by the analyses in Figure 22.
This research signifies a notable progression in Structural Health Monitoring (SHM) for composite structures, outlining the lifespan of large-scale laminated ComBeams from their production through virtual modeling to physical testing. By incorporating Fiber Bragg Grating (FBG) sensors and Strain Gauges (SGs), this study successfully achieved accurate monitoring of residual strains and enhanced the curing process through temperature modifications guided by the thermocouple (TC) data. This dual monitoring approach not only improves material exotherm and uniformity during the curing phase but also facilitates real-time SHM under both static and dynamic (fatigue) loading scenarios.
The calibrated strains, along with the SG data acquired from the FBG sensors, illustrate the collaboration between cutting-edge sensor technologies and traditional experimental techniques, thereby improving the precision and dependability of SHM methods. The application of Generalized Nonlinear Analysis (GNA) to integrate Load Distribution (LD) effects within the Finite Element (FE) model has enhanced the correlation between numerical simulations and experimental findings, enabling a comprehensive examination of stiffness characteristics under diverse conditions, especially for thicker samples.
The study emphasizes the ability of FBG sensors to identify early signs of material degradation, surpassing SG sensors that tend to fail prematurely under identical stress conditions. A thorough examination of the laminated beam during a three-point bending test uncovers important insights regarding the load-bearing characteristics of ComBeams. The findings indicate that the use of FBG sensors results in a significant shift of the neutral axis when compared to the FE models, a phenomenon attributed to the non-uniform material properties caused by the exothermic reaction during the curing process. This understanding, along with force-displacement data gathered from displacement-controlled experiments, clarifies the intricate relationship between the composition of composite materials, their manufacturing processes and the structural efficiency of laminated composite beams.
The comparison of experimental outcomes with stiffness values derived from the FE model serves to validate the model employed in this research and highlights the methodology's potential for comprehending the complex behavior of composite materials. This strategy, which integrates theoretical models with empirical findings, underscores the intricate interdependencies that influence the performance of composite structures and paves the way for future research in material science and engineering.
In summary, this research makes a significant contribution to the fields of materials science and engineering, providing valuable practical applications in Structural Health Monitoring (SHM). It highlights the necessity of integrating sensor technology with numerical modeling to forecast the behavior of intricate composite structures. The further advancement of these methodologies will equip researchers with improved tools to tackle the highly heterogeneous characteristics of composite materials, thereby ensuring safer and more dependable composite structures across various industrial applications.
This comprehensive study illustrates the advantages of merging experimental and numerical approaches to enhance SHM.
Future investigations will concentrate on composite leaf springs of Heavy Commercial Vehicles (HCVs) that exhibit varying cross-sectional thicknesses along their length. Moreover, the incorporation of Thermocouples (TCs) with Fiber Bragg Grating (FBG) sensors in thick Composite Beams (ComBeams) will be crucial for monitoring strain distribution during the curing process. This integration seeks to isolate thermal influences on FBG sensors to gain insights into pressure distribution during manufacturing. Additionally, material characterization throughout the cross-section of thick composite structures will be essential to identify non-uniform thermal effects on material properties. These initiatives will address the challenges identified in this study and promote the development of robust and reliable thick composite components for structural applications. Furthermore, force-controlled conditions will be taken into account for fatigue monitoring, where the applied load remains constant while measuring the resulting strain, facilitating direct observation of the material's response to stress. This methodology may prove particularly advantageous for real-time tracking of damage evolution, as it can clarify how the material reacts under specific loading conditions.
Kaw, A.K. Mechanics of Composite Materials. 2nd ed., Taylor & Francis Group, 2006, p. 39.
Hibbeler, R.C. Mechanics of Materials. 8th ed., Pearson Prentice Hall, 2011, p. 554.
Heißing, B. and M. Ersoy. Chassis Handbook—Fundamentals, Driving Dynamics, Components, Mechatronics, Perspectives. 1st ed., Springer, 2011, pp. 383-420.
Ke, J. et al. “A Review on Material Selection, Design Method and Performance Investigation of Composite Leaf Springs.” Composite Structures, vol. 226, 2019, 111277.
Rajendran, I. and S. Vijayarangan. “Optimal Design of a Composite Leaf Spring Using Genetic Algorithms.” Computers & Structures, vol. 79, 2001, pp. 1121-1129.
Shokrieh, M.M. and D. Rezaei. “Analysis and Optimization of a Composite Leaf Spring.” Composite Structures, vol. 60, 2003, pp. 317-325.
Hou, J.P. et al. “Evolution of the Eye-End Design of a Composite Leaf Spring for Heavy Axle Loads.” Composite Structures, vol. 78, 2007, pp. 351-358.
Krall, S. and R. Zemann. “Investigation of the Dynamic Behaviour of CFRP Leaf Springs.” Procedia Engineering, vol. 100, 2015, pp. 646-655.
Khatkar, V. and B.K. Behera. “Experimental Investigation of Composite Leaf Spring Reinforced with Various Fiber Architecture.” Advanced Composite Materials, vol. 29, 2019, pp. 129-145.
Qian, C. et al. “Fatigue Reliability Design of Composite Leaf Springs Based on Ply Scheme Optimization.” Composite Structures, vol. 168, 2017, pp. 40-46.
Subramanian, C. and S. Senthilvelan. “Joint Performance of the Glass Fiber Reinforced Polypropylene Leaf Spring.” Composite Structures, vol. 93, 2011, pp. 759-766.
Castano, L.M. and A.B. Flatau. “Smart Fabric Sensors and E-Textile Technologies: A Review.” Smart Materials and Structures, vol. 23, 2014, 053001.
Koncar, V. Smart Textiles for In Situ Monitoring of Composites. 1st Ed., Elsevier, 2018.
Sadeghi, M.Z. “Exploitation of the Full Potential in Lightweight Design with Smart Structures.” JEC Conferences, Paris, March 2016.
Ferreira, P.M. et al. “Embedded Sensors for Structural Health Monitoring: Methodologies and Applications Review.” Sensors, vol. 22, 2022, 8320.
Liu, G. et al. “Review of Wireless RFID Strain Sensing Technology in Structural Health Monitoring.” Sensors, vol. 23, 2023, 6925.
Brink, M. et al. “Challenges and Opportunities of RFID Sensortags Integration by Fibre-Reinforced Plastic Components Production.” Procedia Manufacturing, vol. 24, 2018, pp. 54-59.
Zhao, G. et al. “Impact Localization on Composite Laminates Using Fiber Bragg Grating Sensors and a Novel Technique Based on Strain Amplitude.” Optical Fiber Technology, vol. 40, 2018, pp. 172-179.
Werneck, M.M. et al. “A Guide to Fiber Bragg Grating Sensors.” Current Trends in Short- and Long-Period Fiber Gratings, edited by C.C. Laborde, IntechOpen, 2013, pp. 1-23.
Zhang, J. et al. “Effect of Cure Cycle on Curing Process and Hardness for Epoxy Resin.” Express Polymer Letters, vol. 3, 2009, pp. 534-541.
Hu, H. et al. “Monitoring the Gelation and Effective Chemical Shrinkage of Composite Curing Process with a Novel FBG Approach.” Composite Structures, vol. 176, 2017, pp. 187-194.
Geng, X. et al. “Sensing Characteristics of FBG Sensor Embedded in CFRP Laminate.” Measurement, vol. 98, 2017, pp. 199-204.
Fernando, C. et al. “An Investigation of the Use of Embedded FBG Sensors to Measure Temperature and Strain Inside a Concrete Beam during the Curing Period and Strain Measurements under Operational Loading.” Procedia Engineering, vol. 188, 2017, pp. 393-399.
Natarajan, V. et al. “Fatigue Response of Fabric-Reinforced Polymeric Composites.” Journal of Composite Materials, vol. 39, 2005, pp. 1541-1559.
Keulen, C.J. et al. “Prediction of Fatigue Response of Composite Structures by Monitoring the Strain Energy Release Rate with Embedded Fiber Bragg Gratings.” Journal of Intelligent Material Systems and Structures, vol. 27, 2016, pp. 17-27.
Arena, M. and M. Viscardi. “Strain State Detection in Composite Structures: Review and New Challenges.” Journal of Composite Science, vol. 4, 2020, 60.
Kocaman, E.S. et al. “Monitoring the Damage State of Fiber Reinforced Composites Using an FBG Network for Failure Prediction.” Materials, vol. 10, 2017, 32.
Ramakrishnan, M. et al. “Overview of Fiber Optic Sensor Technologies for Strain/Temperature Sensing Applications in Composite Materials.” Sensors, vol. 16, 2016, 99.
Kocaman, E.S. et al. “An Experimental Study on the Effect of Length and Orientation of Embedded FBG Sensors on the Signal Properties Under Fatigue Loading.” Science and Engineering of Composite Materials, vol. 23, 2015, pp. 711-719.
Pereira, G. et al. “Study of Strain-Transfer of FBG Sensors Embedded in Unidirectional Composites.” Polymer Testing, vol. 32, 2013, pp. 1006-1010.
Maheshwari, M. et al. “Wavelength-Shifted Chirped FBGs for Temperature Compensated Strain Measurement.” Sensors and Actuators A: Physical, vol. 265, 2017, pp. 231-235.
Yeager, M. et al. “Impact Detection and Characterization in Composite Laminates with Embedded Fiber Bragg Gratings.” Procedia Engineering, vol. 188, 2017, pp. 156-162.
ASTM D790-17: Standard Test Methods for Flexural Properties of Unreinforced and Reinforced Plastics and Electrical Insulating Materials. ASTM International, 2017.
Ahmadi, M. and T. Farsadi. “Multidisciplinary Optimization of High Aspect Ratio Composite Wings with Geometrical Nonlinearity and Aeroelastic Tailoring.” Aerospace Science and Technology, vol. 145, 2024, 108849.
Liang, Q. et al. “Effect of Curing Pressure on the Curing Behavior of an Epoxy System: Curing Kinetics and Simulation Verification.” Polymer, vol. 256, 2022, 125162.
Ma, K.P. et al. “Internal Residual Strain Measurements in Carbon Fiber-Reinforced Polymer Laminates Curing Process Using Embedded Tilted Fiber Bragg Grating Sensor.” Polymers, vol. 12, 2020, 1479.
Chen, J. et al. “Monitoring of Temperature and Cure-Induced Strain Gradient in Laminated Composite Plate with FBG Sensors.” Composite Structures, vol. 242, 2020, 112168.
Matveenko, V. et al. “Analysis of Reliability of Strain Measurements Made with the Fiber Bragg Grating Sensor Rosettes Embedded in a Polymer Composite Material.” Sensors, vol. 21, 2021, 5050.
Fedorov, A.Y. et al. “Strain Measurement and Stress Analysis in the Vicinity of a Fiber Bragg Grating Sensor Embedded in a Composite Material.” Composite Structures, vol. 239, 2020, 111844.
Gao, Y. et al. “Size Effect in Curing Optimization for Thick Composite Laminates.” Materials Today Communications, vol. 34, 2023, 105276.
Gao, Y. et al. “Optimization Strategy for Curing Ultra-Thick Composite Laminates Based on Multi-Objective Genetic Algorithm.” Composites Communications, vol. 31, 2022, 101115.
