This work has been studied the surface tension () as a function of polyethylene (PE198, PE507, PE619 and PE1100) at different molecular weights by using Simha-Somcynsky theory (SS) occupied site fraction(y) theory in conjunction with Cahn-Hilliard (CH) theory which relevance the free Helmholtz energy of polymer surfaces and interfaces. The aim of this study is establishing the relationship how the surface tension changes for different molecular weights. To extracting the best value of external freedom degree used the Newton Raphson method. İn this work has been applied the temperature range (313 -473) K and the pressure up to about (150) Mpa. The maximum and minimum deviations in the volume were found (1.414) in PE198 and (0.0145) in PE1100 respectively.
The thermodynamic properties of surface tension and density play a crucial role in phenomena such as gas absorption, distillation, crystallization, melting, fusion, and evaporation. These properties are also pivotal in various industries including rubber, plastic, and paint manufacturing. Surface tension in liquids and gases is essential for studying interfacial surfaces and understanding the nature of reactions within mixtures.
Surface tension manifests in two states: on exposed surfaces, it tends to contract, reducing the surface area as liquid molecules draw closer together with force; on unexposed surfaces, it tends to expand, causing molecules to move apart. Although extensive study of surface tension is challenging, it has been examined under critical temperature conditions. Surface tension is defined as the energy required transferring a portion of the liquid mass to the surface to increase the surface area.
The complex structure of binary systems makes it difficult to obtain surface tension data due to temperature and prolonged experimental measurements. Thermo-dynamic properties are calculated to alter the characteristics of colloidal systems, driven by technological advancements and the need to enhance the application of metals through understanding their physical properties.
Experimental systems are maintained with a density greater than that of Boyle's density and temperatures below twice the boiling point. The Cahn–Hilliard (CH) theory is employed to calculate physical parameters in polymers, providing a simple model for the structure of multi-phase polymer materials. This theory examines the structure of polymer materials to understand changes in mass and surface tension.
Physical parameters are studied as a function of temperature to express surface tension, gradient energy coefficient, density, and reduction in surface tension.
Cahn–Hilliard Theory
Physical parameters in polymers are calculated using the Cahn–Hilliard (CH) theory, a simple model for the structure of multi-phase polymer materials. The theory examines how mass and surface tension change in polymer materials.
(1)
: represents the energy density of a homogeneous polymer and is represented by the Laplace equation and density in the following relationship.
, (2)
The symbol (o) in Equation 2 refers to the finite derivatives in gradient energy density and tends to zero. The free energy A of the system volume is V determined by Equation 3:
(3)
k: The gradient energy coefficient [10] and the theoretical values for the low gradient energy coefficient (k =0.5 ) were calculated by Sutherland. The first term in Equation 3 represents the Helmholtz free energy of a homogeneous polymer, while the second term represents the gradient energy coefficient in the free energy.
(4)
: represents the difference between the free energy of homogeneous and heterogeneous polymers (liquid and gas) as shown below.
(5)
, The chemical potentials of liquid and vapor in equilibrium are derived in detail [7], indicating a reduction in surface tension and low gradient energy coefficient.
, , (6)
The characteristic arrangement of holes and molecules is determined by the Flory–Huggins theory and can be measured by mixing a set of entropies of holes and molecules using the Boltzmann constant.
(7)
Simha-Somcynsky (SS) Theory
The Simha-Somcynsky (SS) theory describes the cell structure, assuming that cells and unoccupied molecules exist in the lattice cell due to the instability of liquid and solid polymers. Here, y refers to the occupied part location.
(8)
The partition function [16] indicates the location of the filled and free volume part, as shown below:
(9)
All lattice energies [17], unconstrained volumes, and values of harmonic factors are implemented. This remains unchanged in system equilibrium when the derivative equals zero according to the work rate.
(10)
We will obtain the equation of state [18] by deriving the Helmholtz free energy for the polymer system to calculate pressure and volume at specific temperatures [19].
(11)
(12)
The PVT relationship refers to the relationship between Equation (7) and Equation (8) [20].
, (13)
The physical parameters shown in Equation (9) are P*, V*, T*
, , (14)
Entropy and chemical force substitution in binary systems, free energy function parameters, and derivation procedures [21]. The chemical potential is the difference between mass and surfaces.
(15)
Are refer to the location of the occupied part for large and superficial quantities, respectively, formulating the free energy by potential difference. The Scaled Helmholtz energy is expressed by chemical potential difference as:
(16)
(17)
(18)
Measurement variables
, , (19)
(20)
Equations 19 and 6 are used to calculate temperature and pressure to find the surface tension coefficient and low gradient energy coefficient for PE198, PE507, PE619, and PE1100. The temperatures start from 313K to 513K and pressures from 0.1 MPa to 150 MPa, respectively, to illustrate the change in coefficients from volume to surface.
Surface tension is described as a force [22], withxymers are stable. These experimental results are calculated to apply the SS theory to understand physical parameters (P*, V*, T*, c/s ) in Equations 10 and 12. Each part repeated in the polymer can be considered as land and building. The total freedom of polymers (s) is 3c, where (c) represents the least volumetric error in PVT data [23-24]. Experimental data from the SS theory can be found from Equations 12 and 10 and can be matched with experimental data using the CH theory and the parameters in Tables 1, 2, 3, and 4.
Table (1) shows the distinct physical properties of polyethylene at various molecular weights.
MaxErr | MinErr | V*(cc/gm) | ԑ* (kK) | K* (erg.cm/ | T*(K) | S | C | polymers |
0.39735 | 0.014082 | 0.00123478 | 143.875 | 0.000103166 | 18274.6 | 36 | 2.85 | PE507
|
1.4148 | 0.0147 | 0.00124531 | 147.7 | 0.00046873 | 11490.5 | 14 | 1.85 | PE198
|
0.224046 | 0.0140518 | 0.001231 | 678.688 | 0.000648952 | 2343.1 | 78 | 4.7 | PE1100
|
0.316869 | 0.0140718 | 0.00122014 | 707.963 | 0.00615247 | 18485.5 | 44 | 3.48 | PE619 |
Table (2) presents the values of surface tension reduction and void fraction for different molecular weights (PE198, PE507, PE619, PE1100) at temperatures ranging from 313K to 433K. These values were obtained from the Cahn-Hilliard (CH) theory with the FC contribution at different molecular weights.
h list | T(k) | Polymers | |
0.170561 0.187942 0.205694 0.223818 0.24319 | 0.511728 0.467689 0.424415 0.381905 0.29952 | 373 393 413 433 453 | PE 198 |
0.11184 0.12482 0.13811 0.15167 0.16550 | 1.58910 1.51576 1.44235 1.36958 1.29756 | 373 393 413 433 453 | PE 619 |
0.11497 0.12825 14182 0.155690 0.16983 | 1.35682 1.29027 1.22434 1.15906 1.09443 | 373 393 413 433 453 | PE507 |
0.09606 0.10788 0.11997 0.13240 0.14508 | 2.47492 2.35715 2.23938 2.12161 2.00384 | 373 393 413 433 453 | PE 1100 |
Table (3) displays the values of surface tension and density for different molecular weights (PE1100, PE198, PE507, PE619) at temperatures from 313K to 433K, as derived from the (CH) theory with the FC contribution at various molecular weights.
P(kg/m3) | (N/m) | T(K) | Polymers |
748.487 734.446 720.067 705.358 690.323 684.963 659.275 | 22.832 21.114 19.417 17.746 16.104 14.491 12.911 | 313 333 353 373 393 413 433 | PE198 |
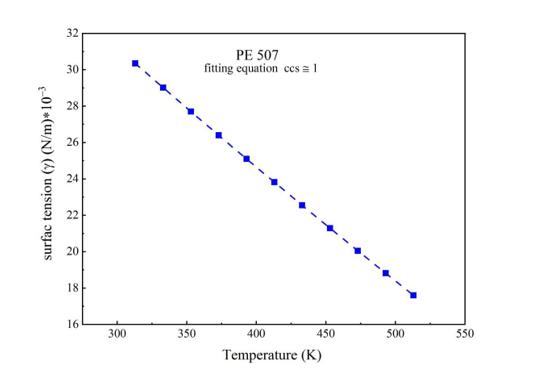
798.289 787.586 776.565 765.247 753.652 741.792 729.682 | 30.3446 29.016256 27.6988 26.3927 25.0983 23.8159 22.5459 | 313 333 353 373 393 413 433 | PE507 |
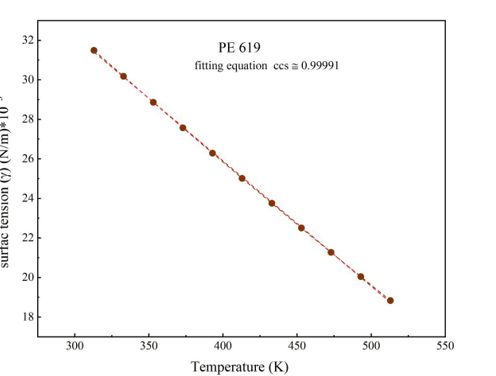
809.923 799.315 788.315 777.177 765.689 735.943 741.952 | 31.4873 30.17 28.865 27.570 26.286 25.031 23.751 | 313 333 353 373 393 413 433 | PE619 |
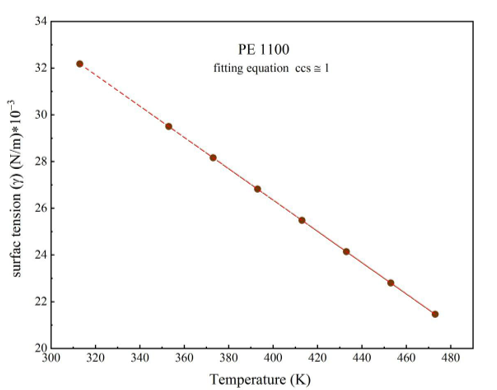
0.49613 0.40604 0.36819 0.33402 0.30293 0.27442 0.24811 | 32.17988 29.49989 28.15989 26.81989 25.47989 24.13989 22.79989 | 313 333 353 373 393 413 433 | PE1100 |
Table (4) shows the values of the low gradient energy coefficient for different molecular weights (PE198, PE507, PE619, PE1100) at temperatures from 333K to 413K.
PE1100 | PE 619 | PE 507 | PE 198 | T(k) |
0.49613 | 0.39407 | 0.34972 | 0.128131 | 333 |
0.40604 | 0.35805 | 0.31684 | 0.11779 | 353 |
0.36819 | 0.3263 | 0.28779 | 0.10424 | 373 |
0.33402 | 0.29799 | 0.2619 | 0.070752 | 393 |
0.30293 | 0.24951 | 0.23863 | 0.0867777 | 413 |
Figure (1): illustrates the relationship between temperature and surface tension for PE198.
When the gap part increases, the temperature increases and the size increases, leading to a decrease in the gradient coefficient and thus leads to a decrease in surface tension because it leads to a high interaction between the polymer molecules and thus an increase in the average gap part, which reduces the gradient energy coefficient and makes the surface tensile softer.
Figure (2): illustrates the relationship between temperature and surface tension coefficient for PE507.
As the temperature decreases, the density increases, the pressure decreases, and the free volume and unoccupied part decrease. This leads to an increase in surface tension and gradient energy coefficient, making the surface tension more rigid and reducing the randomness in polymer distribution.
Figure (3): shows the linear relationship between temperature and surface tension coefficient for PE619.
As the temperature increases, the molecular movement increases, which enhances the randomness in polymer distribution within the lattice. This reduces the gradient energy coefficient, thereby decreasing the surface tension coefficient while increasing the free volume and average void fraction.
Figure (4): depicts the linear relationship between temperature and the surface tension reduction coefficient for PE1100.
The value of the surface tensile decrease coefficient is raised by reducing the temperatures, which makes the polymer molecules complex, and increasing the surface tensile, as it becomes harder and decreases the free volume, and thus leads to a little interaction between the molecules and thus a decrease in the average gap part.
Figure (5): presents the values of temperature and surface tension coefficient for different molecular weights of polymers (PE198, PE507, PE619, PE1100).
The figure above illustrates the experimental data and theoretically calculated values. As the temperature increases from 313K to 513K, surface tension decreases, resulting in high interactions between polymer molecules, an increase in free volume, and an increase in the void fraction. This leads to a reduction in the low gradient energy coefficient. As the pressure increases, the volume decreases significantly, showing linear behaviour, and the density decreases.
Saygin Küzeci, Simha-Somcynsky and Cahn Hilliard Theory of Polymers Surface Free Volume Depth Profile Removal, Phd Thesis, Marmara University, 2011.
S. M. Nuri, S. Y. Darweesh, Researching the PVT properties and gradient energy coefficient with different parameters of Polystyrene (PS910), Tikrit Journal of Pure Science, Vol. 23, No. 3, 2018.
A. Alper, Refractory Materials A series of Monographs, Vol 6-V, Academic Press, New York, 1978
S. Nuri, S. Hasan, Studying the Relationship between Gradient Energy Coefficient with Occupied Site Fraction, Temperature, Density and Surface Tension for Liquid Cyclohexane, Diyala Journal for pure sciences, Vol. 14, No. 2, 2018.
L.A. Utracki, and R. Simha, Analytical representation of solutions to lattice‐hole theory. Macromolecular theory and simulations, Vol. 10, No.1, pp.17-24, 2001.
Cahn, J. W., and Hilliard, J. E., Free Energy of a Non-Uniform System. I. Interfacial Energy. J. Chem. Phys. 28:258–267, 1958.
Mauri, R., Shinnar, R., and Triantafyllou., Spinodal Decomposition in Binary Mixtures. Phys. Rev. E. 53(3):2613–2623, 1996.
Verschueren,M.,A Diffuse-Interface Model for Structure Development in Flow. Thesis. Eindhoven University of Technology, 1999.
S. M. Nuri. Extracting the density gradient profile of polyethylene glycol from bulk to surface. Kirkuk Uni- versity Journal-Scientific Studies, 12(4): 338–351, 2017, doi:10.32894/kujss.2017.132379.
I. Bodurov, T. Yovcheva, Sainov, and S. PMMA. films refractive index modulation via tio2 nanoparticle inclusions and corona poling. Colloid and Polymer Science, 292(11): 3045–3048, 2014, doi:10.1007/s00396-014-3373-y.
Park HE, Lim ST, Laun HM, and Dealy JM. Measurement of pressure coefficient of melt viscosity: drag flow versus capillary flow. Rheologica Acta, 47: 1023–1038, 2008, doi:10.1007/s00397-008-0296-x.
John Wiley and Sons. Handbook of Introduction to Phys- ical Polymer Science. Inc., Hoboken ,New Jersey in Canada, 4t h edition, 2006, 10.24237/djps.1402.403B.
R. Cardinaels, Van Puyvelde, and P. Moldenaers. Evalua- tion and comparison of routes to obtain pressure coeffi- cients from high-pressure capillary rheometry data. Rhe- ologica Acta, 46(4): 507–520, 2007, doi:10.1007/s00397- 006-0148-5.
F. Sahin, C. Tav, and Yahsi. Linking the viscous and vacancy behavior of mixtures of high-molecular-weight hydrocarbons. International Journal of Thermophysics, 27(5): 1501–1514, 2006, doi:10.1007/s10765-006-0099- 1.
D. Buta and K. F. Freed. Lattice polymers with structured monomers: A monte carlo study of ther- modynamic properties of melts and solutions. Jour- nal of Chemical Physics, 116(24): 10959–10966, 2002, doi:10.1063/1.1478766.
A. Sorrentino and R. Pantani. Pressure-dependent viscosity and free volume of atactic and syndiotactic polystyrene. Rheologica Acta, 48(4): 467–478, 2009, doi:10.1007/s00397-009-0348-x.
G. Akdeniz, U. Yahsi, and C. Tav. Viscous behavior of ps, pp, and abs in terms of temperature and pressure- dependent hole fraction. Journal of Applied Polymer Science, 117(1): 110–113, 2010, doi:10.1002/app.31565.
U. Yahsi and F. Sahin. Linking the viscous and vacancy behavior of high molecular weight hydrocarbons. Rheo- logica Acta, 43(2): 159–167, 2004, doi:10.1007/s00397- 003-0330-y.
T. Sedlacek, R. Cermak, B. Hausnerova, M. Zatloukal, A. Boldizar, and P. Saha. On pvt and rheological measure- ments of polymer melts - correction of the hole fraction - viscosity relationship. International Polymer Processing, 20(3): 286–295, 2005, doi:10.3139/217.1890.
S. Ku ̈zeci. Simha-somcynsky ve cahn hilliard kuramlarını kullanarak polimerlerin yu ̈zey serbest hacim derinlik pro- filininC ̧ıkarılması. DoktoraTezi,MarmaraU ̈niversitesi Fen Bilimleri Enstitu ̈su ̈, pages 3–5, 2011.
M. Aslan. Statistical Termodynamics of Branched And Dendrimer Macromolecular Structures. PhD thesis, Mar- mara University ,Istanbul, 2009.
H. Kahl and S. Enders. Calculation of surface prop- erties of pure fluids using density gradient theory and saft-eos. Fluid Phase Equilibria, 172: 27–42, 2000,doi:10.1016/S0378-3812(00)00361-7.
Rubinstein M.; Colby R.H.: Polymer physics. Oxford University Press(2003): G. Akdeniz, U. Yahsi, C. Tav, J. Appl. Polym. Sci. 117, 110 (2010)