
+91 6002993949
submission@iarconsortium.org
Open Access
ISSN (Print) : 2788-9394
ISSN (Online) : 2788-9408
All actions performed to stop subsurface flow are referred to as "well control" During drilling or workover operations, a kick could happen and swiftly turn into a blowout, harming both natural resources and equipment. This paper covers the difficulties that arise during drilling operations in the oil and gas sector, concentrating on well control in particular. The study uses the engineer's method (the wait and weight method) to investigate pressure fluctuations that happen during well control. The study goals were achieved by using the drilling simulator and landmark software to simulate different scenarios with varying kick sizes (kick sizes of 8, 15 and 20 bbl), respectively and two slow circulating rates of 30 SPM and 40 SPM). The results showed that the size of the kick and the circulating rate have a significant impact on pressure levels, with larger kicks resulting in higher pressure profiles. The time it takes to completely kill the well is affected by the different circulating rates. The findings emphasize the importance of proper kick management to safely remove gas kicks from the wellbore.
Well control is the term used for all actions taken to stop the unintended release of wellbore fluids into the environment or underground. A blowout is an uncontrolled release of formation fluids through all well barriers and up to the surface. A "kick" refers to the sudden influx of formation fluids into the wellbore. These fluids can include gas, hydrocarbons, formation water or a combination of these. Among them, a gas kick is considered the most challenging to manage because of its low density and high compressibility [1]. A kick can happen when the pressure in the formation is higher than the pressure in the wellbore, causing gas to flow into the wellbore. The main cause of gas kicks is insufficient mud weight, which allows formation pressure to surpass wellbore pressure. However, using heavy mud weight to excessively increase wellbore pressure is not a practical solution as it can lead to fractures in the formation and a loss of circulation, resulting in damage to the formation [2]. Different techniques for mud circulation and gas influx were incorporated into mathematical models. The final form of the model is determined by the pressure in the casing and drill pipe when shut in and the change in volume in the pit to calculate the amount of gas in the wellbore [3]. The pressure in the annular space was studied during both the driller's and engineer's methods. The author pointed out that there are two scenarios, one where the gas influx flows as a continuous slug and another where it is mixed with mud, that can affect how the formation permeability, volume of the kick and wellbore geometry impact the pressure profile in the annular space at different depths [1]. The system of multiphase fluid is extremely important in maintaining well-controlled conditions, especially during unexpected situations such as kicks. The behavior and pattern of flow are different from a single-phase system, where typically only gas kicks are taken into account during the design phase of drilling operations. Since multiphase kicks can have different outcomes compared to single-phase kicks, it is important to have accurate calculations for multiphase kicks [4]. Different methods for controlling kicks during drilling and workover operations have been studied, including the factors that affect those methods, such as the rate of fluid influx, type of influx, formation permeability and ballooning effect. The study utilized the DRLLSIM 5000 simulator to analyze and investigate the results. Different methods for controlling kicks during drilling and workover operations have been studied, including the factors that affect those methods, such as the rate of fluid influx, type of influx, formation permeability and ballooning effect. The study utilized the DRLLSIM 5000 simulator to analyze and investigate the results [5]. During drilling, workover, snubbing and coiling tubing, many potential issues can arise. Basement reservoirs, which are typically composed of fractures, can result in larger kick sizes and require more attention and accurate calculations. The primary goal of this research is to study the impact of circulating a kick on various parameters, such as pit gain, casing shoe pressure, choke pressure and drill pipe pressure, during the process of well killing. And the effect of different circulating rates on the time of killing the well. Additionally, the research aims to develop an understanding of the behavior of gas kicks from the time of influx to the wellbore until the well is successfully killed. A sensitivity study was conducted to examine the effects of kick size, as they are considered to be the primary factors that affect well control before well design and well killing.
Approaches to Well Control Procedure
Primary Well Control: To avoid a kick, the hydrostatic pressure is kept higher than the formation pressure. This is known as the trip margin [7].
Secondary Well Control
The first step in preventing a kick is to use a blowout preventer (BOP) to shut in the well and minimize the size of the influx and prevent it from escaping to the surface. The second step is to perform killing operations to remove the influx from the well and prevent surface, subsurface and underground blowouts [7].
Tertiary Well Control
If primary and secondary well control methods cannot control the formation and an underground blowout occurs, drilling relief wells can be a solution to save human life and protect the environment from a surface blowout. Therefore, choosing the appropriate killing procedures during drilling and workover operations is essential to prevent all types of blowouts [7].
Field Data Collection Processing
Well, X is located in a Jambour field south of Kirkuk, which is governed by Iraq. Well X is a well that has a 9 5/8" casing. The BHA is composed of 8.5-inch bits, 6.5-inch drill collars and a 5-inch heavy-weight drill pipe. The remainder of the drill string is a 5-inch drill pipe. The fracture gradient is 17 ppg. The total depth of the well is 8000 ft MD (8000 ft TVD). Figure 1 describes this well. The open-hole section is 1500 feet long and has a diameter of 8 1/2 inches. The simulation will be implemented for the expected kick from this basement reservoir. Additionally, a sensitivity analysis is done to show the influence of the kick size and the slow circulating rate on controlling well X during exposure to kick from this reservoir.
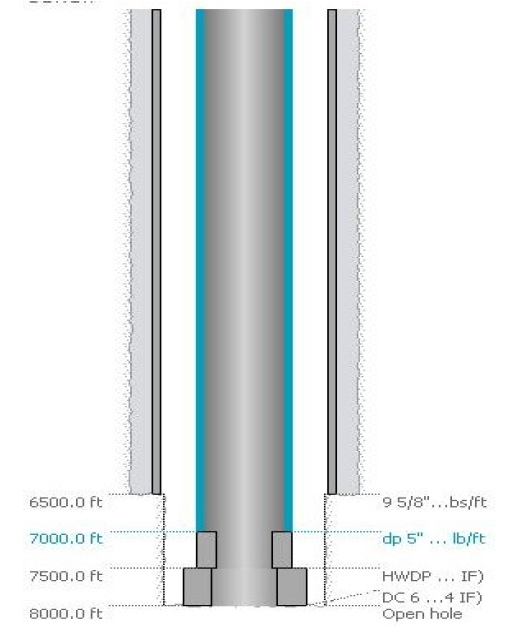
Figure 1: Schematic View of Well X
Operated Kick Scenarios
To study factors that come into play during kick circulation, three kick sizes and two circulating rates were assumed as shown in Table 1 and Figure 2 to evaluate pressure variations and determine maximum pressures during kick circulation and the time to kill the well.
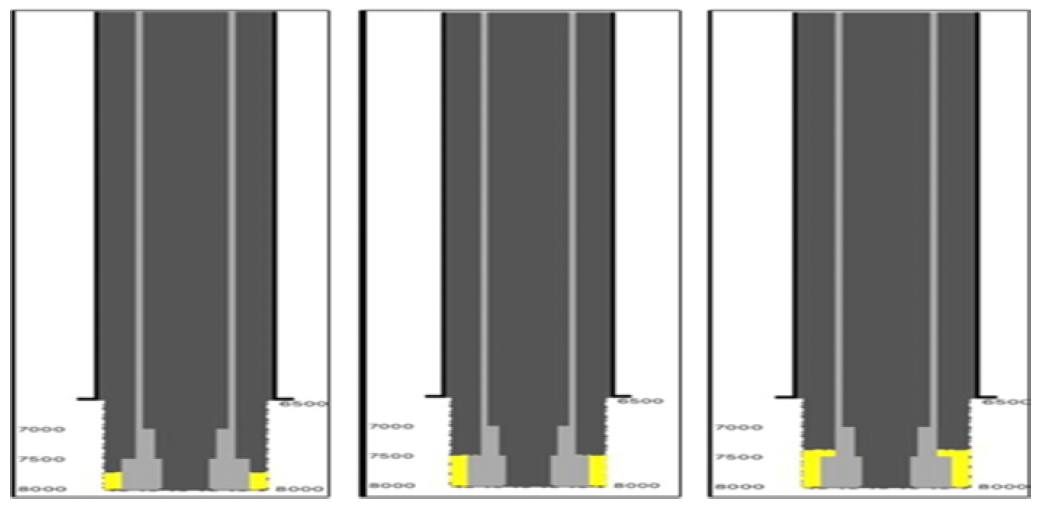
Figure 2: Different Pit Gains
Wait and Weight Method Operation
The wait-and-weight (W&W) technique is also referred to as the engineering technique or the one-circulation technique. Controlling its Bottom-Hole Pressure (BHP) seems essential during this process; it should remain consistent and steady throughout the killing operation. In W&W, the annular mud and the input fluid are combined, creating a variable hydrostatic column. The hydrostatic column for the drill string will also change. It is more crucial to adhere to the kill sheets in this manner because as killing mud changes old mud inside the drill pipe, the hydrostatic column changes, which impacts the pump pressure. In the beginning, there won't be a steady mud column inside the drill string since the mud will be changed concurrently as kick circulation begins. New mud will move down the drill string, changing the mud column. Additionally, the mud's composition will alter as it rises in the annulus due to fluid intake. This will have an effect on the hydrostatic pressure inside the annular as well as the bottom hole pressure, so, if necessary, it must be balanced off with the choke pressure to prevent it from falling below the pore pressure. Following the kill sheet exactly eliminates errors and lowers the possibility of a bottom hole pressure that is either higher or lower than the pressure range as shown in the pore and fracture plot. When employing the Wait and Weight (W&W) technique, we must wait after kicking until the inflow has ceased and the pressure on top of the annulus and drill pipe stabilizes. The well is sealed, the formation pressure and Bottom Hole Pressure (BHP) are measured and the relevant computations are made to ascertain the new mud weight. The major well barrier's restoration is the operation's main objective, as is the new kill mud's need to be able to keep the well circumstances on its own [8].
Table 1: Summary of Kick Situations
Pit gain | 8 bbl | 15 bbl | 20 bbl | |||
SPM | 30 | 40 | 30 | 40 | 30 | 40 |
SCR (PSI) | 250 | 450 | 250 | 450 | 250 | 450 |
SIDPP (PSI) | 500 | |||||
ICP (PSI) | 750 | 950 | 750 | 950 | 750 | 950 |
FCP (PSI) | 275 | 294 | 275 | 294 | 275 | 294 |
SICP (PSI) | 650 | 772 | 832 | |||
FLOW RATE (GPM) | 138 | 184 | 138 | 184 | 138 | 184 |
TIME (MIN) | 164 | 123 | 164 | 123 | 164 | 123 |
Related Well Control Equations
The calculations for killing were performed using the fundamental equations listed below. Those have been employed to well control and analysis for the current manuscript. More details will be described in further sections. The calculations for killing were performed using the fundamental equations listed below.
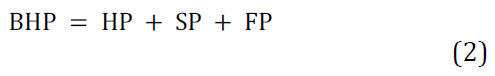
Hydrostatic Pressure
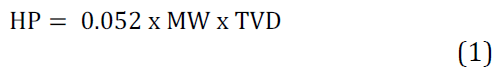
Bottom Hole Pressure
Boyles Law
Kill Mud Weight
Initially Circulating Pressure
Final Circulating Pressure
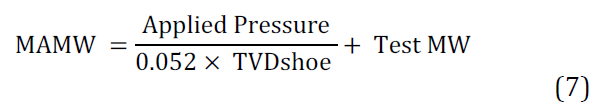
Maximum Allowable Mud Weight (ppg)
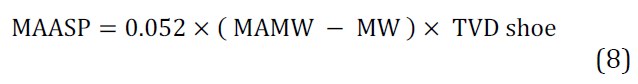
Maximum Allowable Annular Pressure
The Well Control Analysis Results
To study the factors that affect killing operations using drilling simulator software. The factors (size of influx and killing rate) were changed, then killing operations using a simulator was performed and we tried to read the chart for each factor. All simulations were carried out until the gas was completely out of the system; the data was recorded by the simulator and then manipulated in Excel.
Kick behavior is studied and investigated in well X, drilled to produce from the high-pressure reservoirs, using the drilling simulator and landmark software. The effect of the kick would appear by changing the kick size to 8, 15 and 20 bbl. As shown in Figure 3 for the kick size 8 bbl the pit gain starts to increase with circulation. Further, the pit gain is increasing as the kick is circulated out and reaches a maximum when the top of the gas kick arrives at the surface with a volume of 42.8 bbl in 110 minutes at 30 SPM and 83 minutes at 40 SPM. When the pit gain decreases, the gas kick starts to leave the well. The gas has been completely circulated out and kill mud has been displaced in both the drill pipe and the annulus. At 30 SPM, the well is completely killed and full of kill mud in 164 minutes and 123 minutes at 40 SPM.
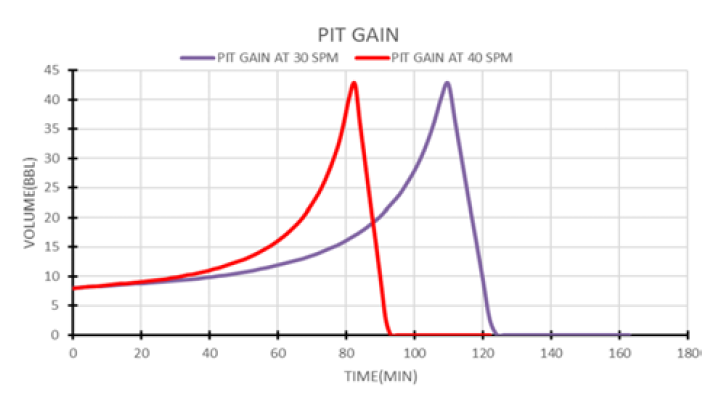
Figure 3: Pit Gain of 8 bbl
As shown in Figure 4, the well has been shut down and the pressure has been stabilized at 650 psi. killing starts and reaches the highest surface pressure of 700 psi. after the influx has reached the surface and all gas bubbles have been circulated out, the pressure begins to fall. The well is completely dead and full of killing mud.
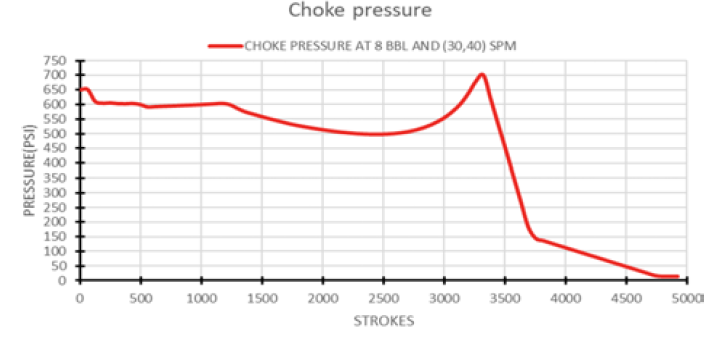
Figure 4: Choke Pressure at 8 bbl Pit Gain
Figure 5 depicts the behavior of the casing shoe pressure at 8 bbl pit gain during the kill procedure as the influx travels in the annulus. As the kick enters the annulus, pressure increases as the influx move up, with maximum pressure at the shoe being 4866 psi. After that, the pressure reduces as it passes above the shoe. As the kill-weight mud is pumped down the drill pipe, the pressure drops steadily.
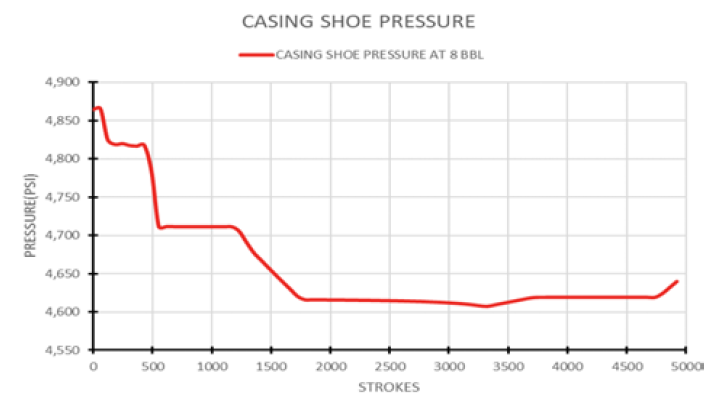
Figure 5: Casing Shoe Pressure at 8 bbl Pit Gain
Moreover, Figure 6 shows the pit gain when the well kicks 15 bbl. It can be seen that the pit gain is increasing as the kick is circulated out and reaches a maximum when the top of the gas kick arrives at the surface with a volume of 62.3 bbl in 104 minutes at 30 SPM and 78 minutes at 40 SPM. When the pit gain decreases, the gas kick starts to leave the well. The gas has been completely circulated out and kill mud has been displaced in both the drill pipe and annulus in 164 minutes at 30 SPM and 123 minutes at 40 SPM.
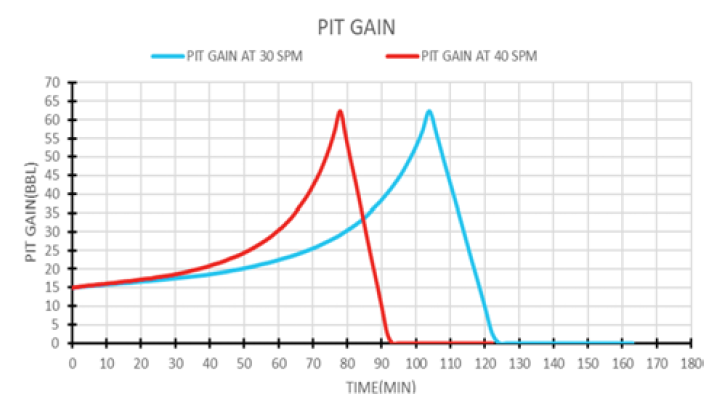
Figure 6: Pit Gain at 15 bbl
Clearly Figure 7 shows that when the well kicks 15 bbl, pressure stabilizes at 772 psi. Killing begins and reaches a maximum surface pressure of 937 psi. After the influx has reached the surface and all gas bubbles have been circulated out, the pressure begins to fall. At 30 SPM, the well is completely killed and full of kill mud in 164 minutes and 123 minutes at 40 SPM.
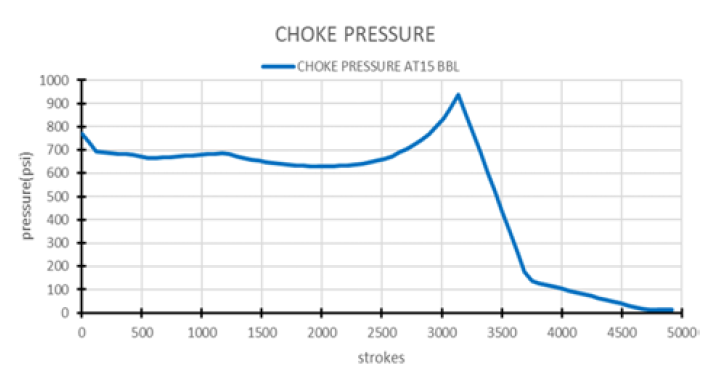
Figure 7: Choke Pressure at 15 bbl Pit Gain
Figure 8 depicts the behavior of the casing shoe pressure during the kill procedure when the pit gain is 15 bbl as the influx travels in the annulus. As the kick enters the annulus, pressure increases as the influx moves up, with the maximum pressure at the shoe being 4989 psi. After that, the pressure reduces as it passes above the shoe.
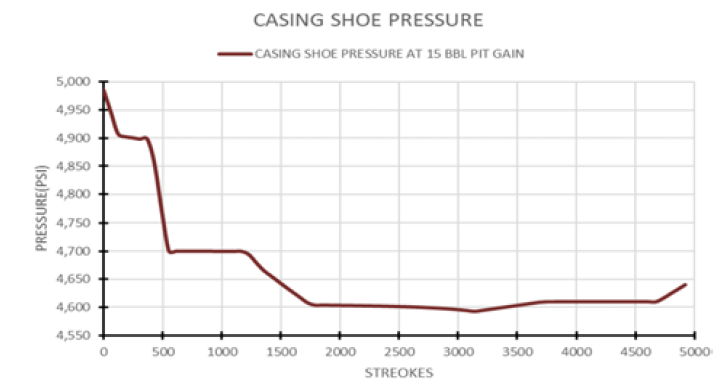
Figure 8: Casing Shoe Pressure at 15 bbl Pit Gain
Figure 9 shows the pit gain when the well kicks 20 bbl. The pit gain is increasing as the kick is circulated out and reaches a maximum when the top of the gas kick arrives at the surface with a volume of 70.1 bbl in 100 minutes at 30 SPM and 75 minutes at 40 SPM. When the pit gain decreases, the gas kick starts to leave the well. The gas was completely circulated out and kill mud was displaced in both the drill pipe and annulus in 164 minutes at 30 SPM and 123 minutes at 40 SPM.
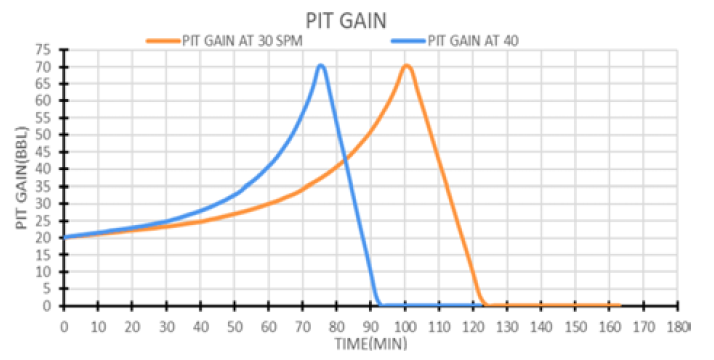
Figure 9: Pit Gain of 20 bbl
The choke pressure constructed in Figure 10 shows that when the well kicks 20 bbl, pressure stabilizes at 832 psi. Killing begins and reaches a maximum surface pressure of 1035 psi. After the influx has reached the surface and all gas bubbles have been circulated out, the pressure begins to fall. At 30 SPM, the well is completely killed and full of kill mud in 164 minutes and 123 minutes at 40 SPM.
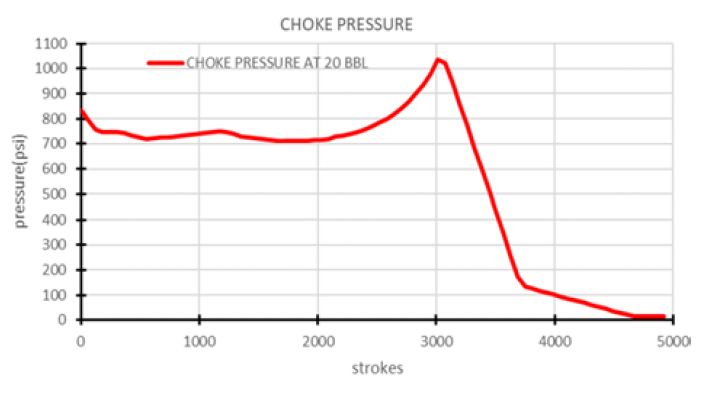
Figure 10: Choke Pressure at 20 bbl Pit Gain
Figure 11 shows the behavior of the casing shoe pressure while the influx travels in the annulus in the kill procedure. As the kick moves up the annulus, the pressure increases, with the maximum pressure at the shoe being 5046 psi. After that, the pressure reduces as it passes above the shoe. As the kill-weight mud is pumped down the drill pipe, the pressure drops steadily. The casing shoe pressure decreases until the kill mud enters the annulus.
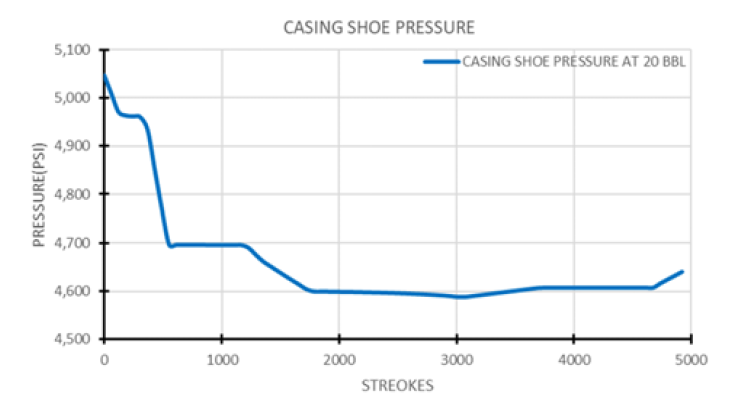
Figure 11: Casing Shoe Pressure at 20 bbl Pit Gain
Figure 12 shows the behavior of the drill pipe pressure. After some time, the kick becomes stable. The top annular and drill pipe increased pressure in a shut-in well until the formation pressure and BHP were stable and the flow stopped. The SICP and SIDPP are now measured, with the SIDPP being 500 Psi. There won't be a steady mud column inside the drill string at first since the mud will be changed once kick circulation gets going. The mud column should change as new mud descends the drill string, so when the kill mud reaches the bit, it switches from the ICP to the FCP and remains at the same value in the FCP till the well is full kill. When circulating at 30 SPM, the ICP is 750 Psi and the FCP is 275 Psi, whereas when circulating at 40 SPM, the ICP is 950 Psi and the FCP is 294 Psi.
Finally, the kick size highly influences the pressure behavior while the fluid migrates from the bottom hole to the surface. Table 2 The higher the kick, the higher the influx and well pressure. When the pit gain was 8 bbl, the choke pressure was 700 psi and 4865 psi for the casing shoe pressure. When the kick size is 15 bbl, the choke pressure increases to 937 psi and the casing shoe is at 4986 psi. The choke pressure was 1035 psi and the casing shoe pressure was 5046 psi when the pit gain was 20 bbl. As expected, the larger the kick size, the greater the effect.
Slow circulating pressure is related to stand-pump pressure. When circulating at 30 SPM, the ICP is 750 psi and the FCP is 275 psi, whereas when circulating at 40 SPM, the ICP is 950 psi and the FCP is 294 psi.
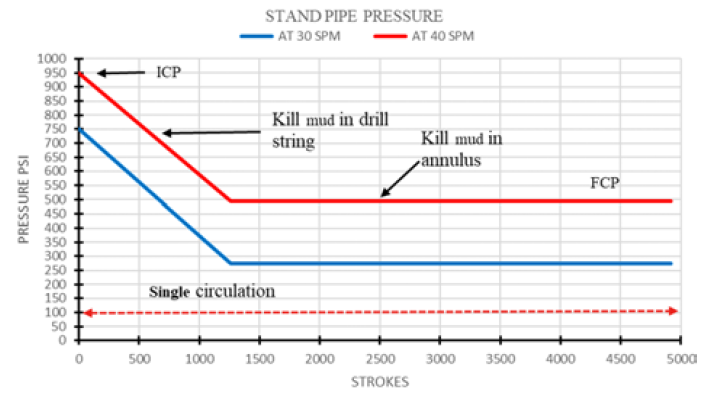
Figure 12: Drill Pipe Pressure Using the (W and W) Method of Well Control
Table 2: Maximum Pressure with Pit Gain
Well Name | Pit Gain (bbl) | Maximum Pressure at Shoe Casing (Psi) | Maximum Surface Pressure (Psi) |
Well X | 8 | 4865 | 700 |
15 | 4986 | 937 | |
20 | 5046 | 1035 |
The current research project has produced a useful model for drilling kicks and demonstrated that well control simulations are effective tools for evaluating the impact of kick volume and slow circulating rate on various pressures, such as casing shoe pressure, bottom hole pressure, standpipe pressure and choke pressure. The study provided a thorough understanding of how kicks behave from the moment they enter the wellbore until the well is safely and effectively killed. The results showed that when kicks are detected and removed from the well in a controlled way while maintaining constant bottom hole pressure, there is an increase in pit gain, casing shoe pressure and choke pressure. Additionally, the research found that kick size and slow circulating rate have a significant impact on the well, with larger kicks leading to higher pressure profiles.
Nomenclature
BHP = Bottom Hole Pressure
FP = Formation Pressure, Psi
HP = Hydrostatic Pressure, Psi
SIDPP = Shut in Drill Pipe Pressure, Psi
SICP = Shut in Casing Pressure, Psi
OMW = Old or Original Mud Weight, ppg
KMW = Kill Mud Weight, ppg
SPM = Stroke Per Minute.
ICP = Initial Circulating Pressure, Psi
SCR = Slow Circulating Rate Pressure, Psi
FCP = Final Circulating Pressure, Ps
MAASP = Maximum Allowable Annular Pressure, Psi
MAMW = Maximum Allowable Mud Weight, Ppg
P1 = Pressure of Gas at Depth 1
V1 = Volume of Gas at Depth 1
P2 = Pressure of Gas at Depth 2
V2 = Volume of Gas at Depth 2
Applied Pressure = Applied Pressure from Integrity, Psi
TVD = True Vertical Depth, ft
Test MW = Mud Weight, ppg
Omosebi, A. et al. “Annular Pressure Prediction during Well Control.” Society of Petroleum Engineers, Nigeria, 2012.
Darwesh, A. et al. “Kicks Controlling Techniques Efficiency in Terms of Time.” 2017, pp. 82-492.
Choe, J. Dynamic Well Control Simulation Models for Water-Based Muds and Their Computer Applications. Texas A&M University, 1995.
Irawan, S. et al. “Implication of the Multiphase Influx in Well Control and Circulating System.” Journal of Earth Energy Science, Engineering, and Technology, vol. 13, 2020.
Elgibaly, A. “Well Control during Drilling and Workover Operations.” Journal of Petroleum and Mining Engineering, vol. 21, no. 1, 2019, pp. 104-120.
Grace, R.D. Blowout and Well Control Handbook. Gulf Professional Publishing, 2017.
Schools, A.D. Well Control for the Rig-Site Drilling Team. Training Manual, 2002.
Mihandoust, M. et al. “Evaluation of Driller’s and Wait and Weight Methods in the Well Killing Operations.” Journal of Islamic Studies, Tehran, 2019.
