
+91 6002993949
submission@iarconsortium.org
Open Access
ISSN (Print) : 2788-9394
ISSN (Online) : 2788-9408
The technology of Brain Computer Interface (BCI) is a rapidly growing research field with vast applications. BCI acts as a bridge between a human brain and the machine-like computer. The main purpose of BCI system is to enable the people with disability to interact with outside world. The electrical signals captured from the brain are processed to remove the noise and artifacts. The features of the processed signal are extracted, classified and later translated into the device commands in order to execute the intent of the user. This paper furnishes the basics of BCI, different ways of signal acquisition, overview of the BCI system, its applications and challenges.
Brain-Computer Interface (BCI) is a quickly growing and upcoming technology which is capable of making a human brain to communicate with the environment. It is a system which translate the activity of the human brain into commands or messages to make an application interactive. A user can change the position of a ball on the screen of the computer in the left or right direction, by envisioning left or right-hand movement [1]. BCI has many applications among which the most important application is one which is designed to help the disabled people to lead a normal life just like others. A famous example is controlling a wheel chair.
Brain Computer Interface Types
In the human brain, the neuron cells generate electrical signals. Based on the way these signals are generated, the brain computer interface is categorised into the following three groups. The Figure 1 shows the classification of BCI.
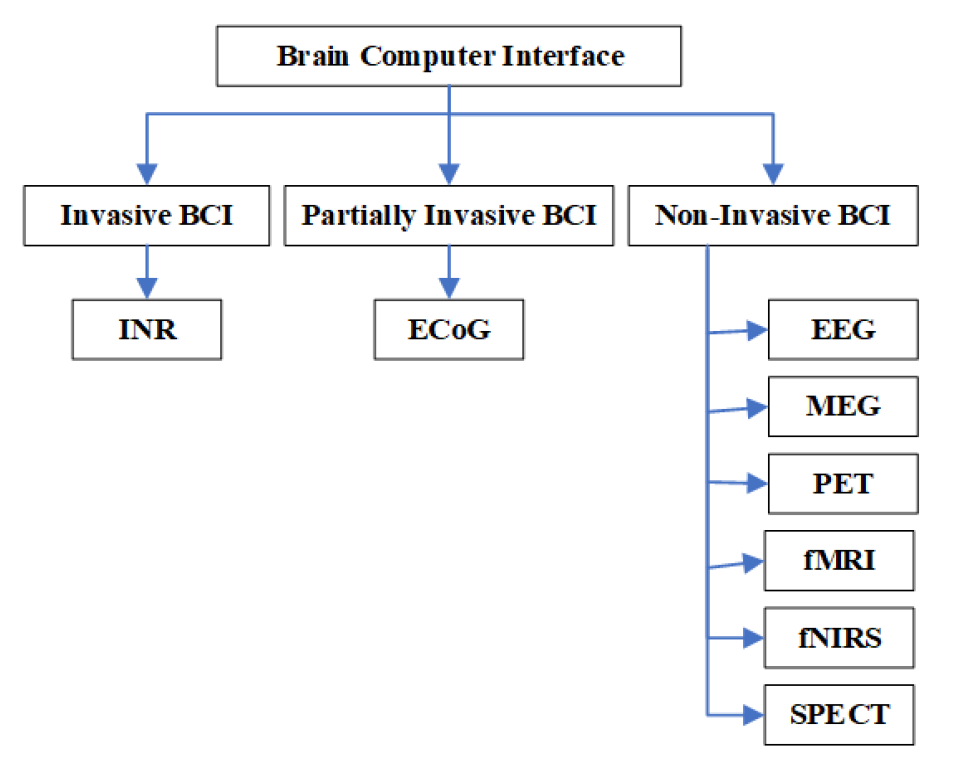
Figure 1: Classification of Brain Computer Interface
Invasive Brain Computer Interfaces
In invasive BCI, special devices are used to seize the signals generated from the brain. These devices are called as Invasive BCI devices. By performing a neurosurgery, the electrodes are implanted under the scalp of the brain. The single unit BCIs are used to detect the electrical signals from a sole area of the brain cells and the multiunit BCIs are used to detect electrical signals from several areas. The electrodes are made up of the metal discs and can vary in their lengths. The different types of electrodes are wet or dry and disposable, reusable disc electrodes (gold-plated, silver-plated, stainless steel, tin), headbands and electrodes caps, needle electrodes, saline-based electrodes. Even though this method helps in capturing the highest quality of electrical signals from the brain, it also causes risk of forming scar tissues. Since it is an expensive as well as a risky procedure, only the blind and paralyzed people are targeted [2].
Intracortical Neuron Recording
It is an invasive BCI used to quantify the electrical activity of the brain’s the grey matter. Three signals namely Single-Unit Activity (SUA), Multi-Unit Activity (MUA) and Local Field Potentials (LFPs) can be attained from this recording. High spatial and high temporal resolution is achieved using this technique compared to EEG. Intracortical neuron recording was first done on animals like monkeys and rats to capture their neural activity from the motor cortex.
Partially Invasive Brain Computer Interfaces
This is also called as non-invasive BCI. Here instead of placing the electrodes within the grey matter they are inserted inside the skull but rest outside the brain rather. Hence the clarity of the electrical signals obtained is less compared to the quality of the signals obtained from the invasive BCI methods. Also, they have a lesser risk of scar-tissue in the brain compared to the invasive BCIs.
Electrocorticography (ECoG)
In this technique, electrodes are implanted in a thin plastic pad which is placed above the cortex to measure the electrical activity in the cerebral cortex. The electrodes can be placed outside or under the dura mater. The grid electrodes are used to cover a bulk area of the cortex. ECoG electrode arrays usually comprise sixteen sterile, disposable stainless steel, carbon tip, platinum, Platinum-iridium alloy or gold ball electrodes. Each of the electrode is mounted on a ball and socket joint for ease in positioning.
Advantages
The signal obtained exhibit high amplitude, high temporal and spatial resolution. The flexibility of placing the stimulating and recording electrodes is permitted. The clinical risks are low and the signals are less susceptible to the noises generated by eye blink and movement of the eye.
Disadvantages
While ECoG recording period, seizures may not be recorded. Sampling errors may occur. The placement of electrodes is constrained by the area of exposed cortex and surgery time.
Applications
ECoG is used to localize the epileptogenic tissue, map out cortical functions and also used to predict the success of the surgery. It identifies the somatosensory and somatomotor cortex areas. It is used to diagnose, assess and monitor certain neuro-otologic disorders [3].
Non-Invasive Brain Computer Interfaces
In non-invasive BCIs, the brain signals are captured by placing the electrodes on caps or headbands. Figure 2 shows the non-invasive BCI.
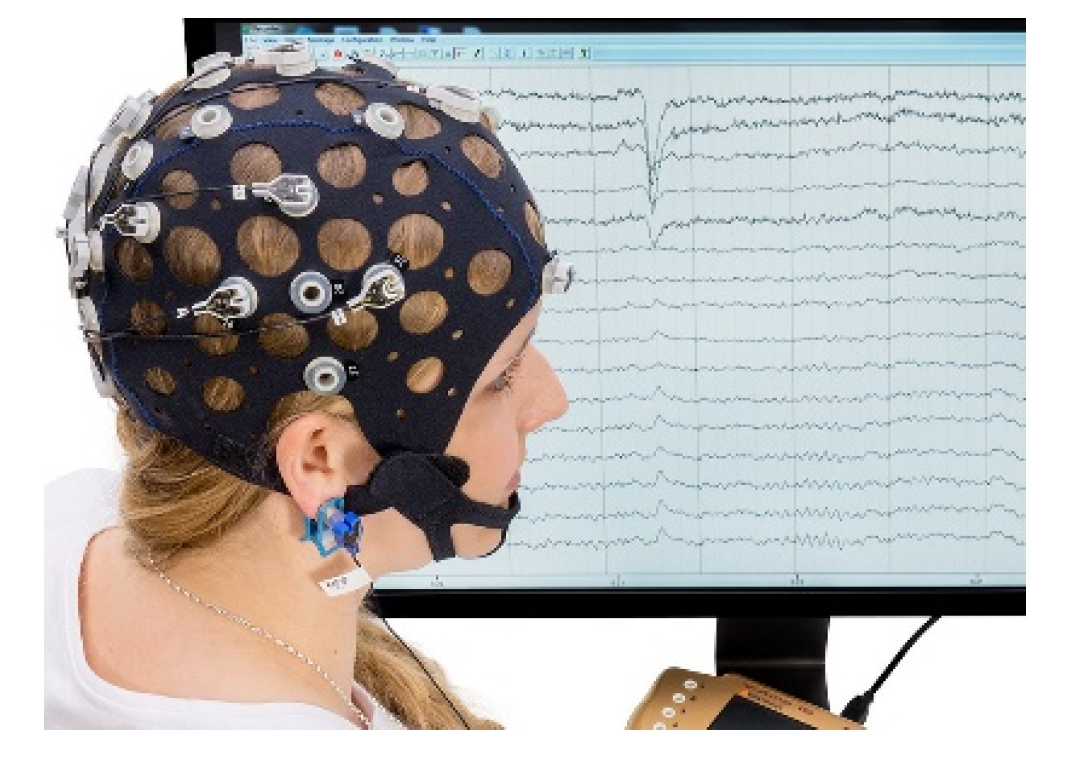
Figure 2: Non-Invasive BCI
The clinical surgery is unnecessary because the electrodes are located on the brain superficially. Even though the skull cap is easy to wear, the spatial resolution is relatively poor. Since the skull dampens the signals, electromagnetic waves obtained are blur in nature. However, the merits include lower cost and high portability. The different types of non-invasive BCIs are Electroencephalogram (EEG), Magnetoencephalography (MEG), Positron Electron Tomography (PET), functional Magneto-Resonance Imaging (fMRI), Near-Infrared Spectroscopy (fNIRS), Single Photon Emission Computed Tomography (SPECT):
Electroencephalography (EEG)
It is a non-invasive BCI which records the electrical activity of the brain by placing the electrodes (metal discs) on the scalp. The EEG recording system consists of electrodes, amplifiers, A/D converter and a recording device. The electrical signals from the scalp are captured by the electrodes. The analog signals are processed by the amplifiers to increase the amplitude of the EEG signals so that the signals can be digitized in an accurate way by the A/D converter. Finally, the recording device (computer) can store and display the data. EEG encompasses a set of signals. These signals are categorized based on their oscillations. The phase, power and frequency will describe the oscillations. The frequency ranges are classified based on the distribution over the scalp and/or biological implication. The oscillations occur at specific frequencies which include delta (δ), theta (θ), alpha (α), beta (β) and gamma (γ) from low to high, respectively.
Delta Signal
This signal is captured in the frequency range of 1 to 4Hz. It is normally associated with slow-wave sleep. This signal occurs in the different areas of the brain in different range. If this signal is spotted in the awake state, then it determines the flaws in the brain. It is the slowest wave with highest amplitude. A confusion between delta waves and artifact signals generated by muscles of neck and jaw can be created due to the low frequency. Delta waves occur in all the animals.
Theta Signal
The frequency range of this signal is from 4 to 8Hz. Theta is linked to inefficiency, carelessness, daydreaming and drowsiness. When a person is frustrated, disappointed or emotionally stressed, the theta signal will increase. The circumstances like deep meditation, not being focused and being unconsciousness are signified by this theta signal [4]. A thin line of differentiation between the sleep state and being awake is represented by theta signal’s lowest waves.
Alpha Signal
Here the range of frequency is from 8 to 13Hz. It is related with peacefulness and disinterestedness. Thinking with peaceful by closing the eyes will show an increase in the amplitude of alpha activity. This signal can be seen behind the head and in the forward lobe. A rise in alpha power can also be seen after smoking marijuana.
Beta Signal
This signal lies between 12Hz and 30Hz. It is further categorized into β1 and β2 to obtain the essential choice. Human activities like concentration and attentiveness are associated with the small and fast signals of beta. They are defined well in central and frontal areas of the human brain. During struggling, movement of suppress or cracking a mathematical task, the beta activity will be increase.
Gamma Signal
This signal is found above 31Hz. It mirrors the act of consciousness. It is allied with perception and attention. Gamma signal is generated in the prefrontal area of the brain and it plays a vital role in BCI performance.
Advantages
EEG is a low-cost method of neuroimaging and has a high temporal resolution. It does not produce any harmful side effects on human health.
Disadvantages
EEG recordings are susceptible to contamination with noise produced by eye blink, muscle movement etc. EEG cannot be used to obtain the image of the cross sections of the brain as it is a signal measurement technique. It cannot specify the position of the electrical activity on the brain surface very well.
Applications
EEG-based BCI is the flashpoint in the field of neuro-engineering, reformation and brain science. The EEG method recognises and seizes the commonly used signal called P300 wave. EEG plays an important, effective and efficient role in identifying epilepsy, arkinson’s disease, alzheimer’s disease, neurological disorders, abnormalities in the brain waves, sleep disorders, stroke, brain tumours, brain death and many more [5]:
Magnetoencephalography (MEG)
It is a non-invasive imaging technique. The process of magnetic induction is used to record the brain activity. The current within a cell flows over the dendrites. This will generate the magnetic fields. These magnetic fields are measured by MEG. The neuromagnetic signals generated by the brain are enormously small. Hence the MEG scanners require superconducting sensors, called Superconducting Quantum Interference Device (SQUID) sensors. These sensors are immersed in a coolant of huge liquid helium of degree around −269°C. At this low degree, the electrical resistance of the SQUID disappears and it will exhibit a very small impedance. Therefore, the magnetic fields which are generated by the neurons of the brain are recognised and amplified by the MEG device.
Advantages
MEG has a high spatial and temporal resolution compared to EEG. This will reduce the training time required to regulate a BCI and fastens the reliable communication. The magnetic fields of MEG are less determined than electrical currents in EEG. Due to this, a surgeon finds it easy to plan his surgery.
Disadvantages
The MEG equipment is more costly compared to EEG equipment. It can identify only the magnetic fields which align with the side of the head. The magnetic field generated by the brain is weak in nature. Due to this reason, MEG is extremely delicate to the exterior sound.
Applications: MEG is used to identify epilepsy, alzheimer’s disease, psychiatric disorders, head injury etc.
Positron Electron Tomography (PET)
PET is used to investigate the flow of the blood, metabolic process and chemical reactions in human and animal body. Glucose is utilized by every organ of the human body. This glucose utilization rate is measured by PET. The PET scan is based on the detection of radioactivity emitted. It reveals the functioning of the body tissues and organs by using a drug called tracer which emits radiation unexpectedly. The tracer can either be gulped, inhaled, or injected. A bright spot in the region where high chemical activity happens can be observed when the tracer is injected to the body. This helps in the study of the pharmacokinetics of radiotracers molecules. In contrast to MRI, PET scan uses positrons to provide a complete view of complex systemic diseases by presenting the problems at the cellular level.
Advantages
PET provides enhanced image quality, better interpretive certainty, advanced diagnostic accuracy, lesser patient dosimetry and shorter imaging protocols as compared to SPECT. Even though PET uses radioactive tracers, exposure to the harmful radiation is minimal and hence the risk of negative effects is low. It detects residual or recurrent disease which makes it an excellent diagnostic technique to differentiate tumour repetitions from radiation necrosis or post-surgical changes.
Disadvantages
The slow growing and less active tumours may not absorb much of the radioactive tracer. In such situations, a PET scan is less accurate. The tumours less than 7mm may go undetected. People who tend to be allergic to iodine, aspartame or saccharin may have an allergic reaction to the tracer. The injected tracer may lead to the signs of bleeding, bruising, or swelling.
Applications
PET scan of the brain is frequently used to detect cancer, heart problems, epilepsy, stroke, dementia, brain disorders, Huntington, Parkinson and Alzheimer diseases. This scan is used to detect dense tumours in the regions of the brain, prostate, thyroid, lungs and cervix. Moreover, it can assess the existence of colorectal, lymphoma, melanoma and pancreatic tumours as well. It is commonly used by oncologists, neurologists, neurosurgeons and cardiologists [6].
Functional Magneto-Resonance Imaging (fMRI)
fMRI is an imaging technique used to generate the anatomical images of different parts of the body. It determines the time-varying and regional changes in brain metabolism. The brain activity can be measured through the flow of the blood and solid structural responses related with the behaviour of the neurons. There can be variations in the responses obtained by hemodynamics. MRI is capable of producing the sectional images of these variations. This denotes the changes in neural oscillations or brain waves with time. In fMRI, the patient’s brain is imaged using a elevated Tesla magnetic Field, Radiofrequency (RF) pulse and magnetic gradient. This mechanism is based on the principle of Nuclear Magnetic Resonance (NMR). An MRI scanner comprises of superconducting magnet, gradient coils, radio frequency transmitter and receiver and the computer. The MRI systems generate a very good quality of diagnostic images of different parts of the human body using a successful and secure magnetic field created by the main magnet.
Advantages
It has a better and high space resolution compared to EEG. It is used to analyse the behaviour of different brain regions.
Disadvantages
It has a small temporal resolution than EEG. It can capture a rich and strong image only if the person stays still. It is inappropriate for instant, rapid and faster communication in BCI systems. fMRI is extremely vulnerable to the noise generated due to head motion. The fMRI machines are bulky in nature and also very expensive.
Applications
The Blood Oxygen Level Dependent (BOLD) during neuronal activation is measured using fMRI [7]. This helps in detecting the abnormalities in the brain which may not be possible using other imaging techniques. The best use of fMRI scans is in effectively diagnosing schizophrenia which is a psychological problem. The patient suffering from this disorder will not be able to identify the reality and exhibit a be behaviour which is not considered to be normal in the society.
Functional Near-Infrared Spectroscopy (fNIRS)
fNIRS is a non-invasive brain-monitoring technology. It is also called as Optical Topography (OT). The fundamentals of blood vessels and nerves coupling is the basis on which fNIRS works. This theory is also known as the haemodynamic response or Blood-Oxygen-Level Dependent (BOLD) response. It is helpful to measure the blood oxygenation changes in human body. By placing the near infrared light sources and detectors on the scalp of the human brain, the cortical hemodynamic response is tracked and measured. The changes in oxy- and deoxy haemoglobin concentration can be measured only from the regions near the cortical surface.
Advantages
fNIRS offers a non-invasive, portable and inexpensive device for functional neuroimaging comparable to EEG, as opposed to fMRI, PET and MEG. It uses light sources which follow the theory of amplification of the light by radiation emission. There is no requirement of any precautionary procedures and hence it is safe. The sensitivity of fNIRS to the artifacts is low, when compared to EEG. The spatial resolution of fNIRS if very high compared to EEG. Also, it has a good temporal resolution when compared to fMRI. Also, it exhibits high temporal resolution. It is user friendly and more robust to head movement. It is capable of providing quantitative estimates of the blood flow.
Disadvantages
The penetration acuteness of NIRS is inadequate. In adults it classically stretches out from 5 to 10 millimetres underneath the internal surface of the head for awaking the brain. Because of the absence of transmission estimation through the head, the brain’s depth resolution poses many challenges.
Applications
fNIRS is useful in the area of medical monitoring and diagnosis. NIRS technology detects cerebral haematomas [8] in the early stages. By discovering the fluctuations in oxygenated and deoxygenated haemoglobin. fNIRS determines the variability in the blood flow. In contrast to fMRI or PET, it achieves a temporal resolution of more than100 Hz by gauging the hemodynamic signs. This helps to filter out the necessary brain activity signals. While the musician plays the musical instrument, his/her brain activity can be monitored using fNIRS.
Single Photon Emission Computed Tomography (SPECT)
SPECT is a nuclear imaging test which shows the flow of the blood to the different tissues and organs of the human body. An injection consisting of a radioactive tracer is given to the patient. The three types of tracers used are technetium-99m, iodine-123 and iodine-131. After which a form of electromagnetic radiations called gamma rays are emitted by the radioactive tracer [9]. These gamma rays are detected by the gamma camera to acquire several two-dimensional images called as projections from multiple angles. Then a computer is used to apply a tomographic reconstruction algorithm on to the multiple projections to yield cross sectional images. These images are then assembled to obtain a three-dimensional data set.
Advantages
It is used to diagnose seizures, stroke, stress fractures, infections and tumours in the spine. SPECT scan is of low cost compared to PET scan. Majority of the people find this scan safe with minor allergies, swelling and pain. The SPECT scan and the test is not associated with any long-term health risks compared to X-rays.
Disadvantages
It offers a lower resolution image which is prone to artifacts and attenuation. It takes longer time to scan. Compared to PET, SPECT does not provide a quantifiable approximation of the blood flow. Since the radioactive tracer might be passed to the developing foetus or the nursing baby, this scan is not considered to be safe for pregnant and breast-feeding women.
Applications
It plays a vital role in identifying the heart problems, brain and bone disorders. SPECT scan helps to determine the parts of the brain affected by several disorders like dementia, epilepsy, seizures and head injuries it monitors the areas of the bone where the cancer has progressed and also finds the hidden and stress fractures in the bone. This neuroimaging technique is also useful to detect the Parkinson’s disease at the early stages.
Overview of the BCI System
A BCI system comprises of four stages namely Signal Acquisition, Signal Pre-Processing, Feature Extraction and Classification and Computer Interaction. Figure 3 shows the four stages of BCI system.
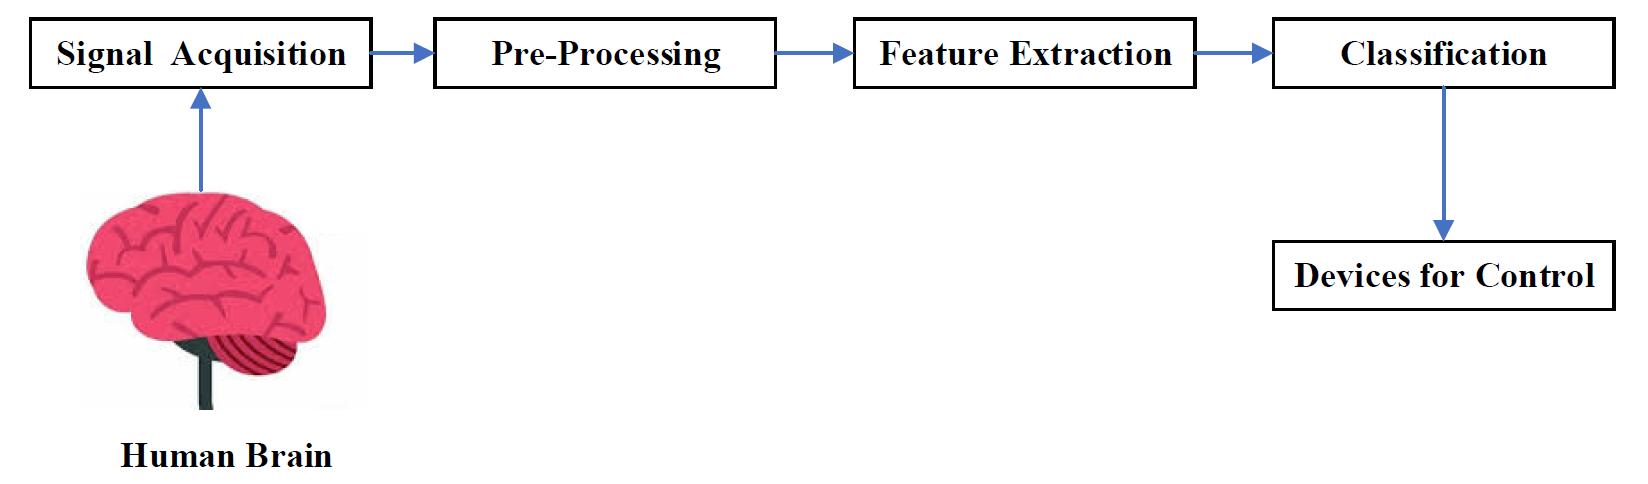
Figure 3: The BCI System
Signal Acquisition
It is a process of collecting electrical brain signals from the scalp/surface of human brain using electrodes. This can be done using invasive, partially invasive or non-invasive methods. Invasive BCI includes intracortical neuron recording. Partially invasive BCI includes ECoG. Non-invasive BCI includes EEG, MEG, PET, fMRI, fNIRS, SPECT. The strength of the electrical signals will be low and hence they need to be amplified.
Signal Pre-Processing
Signal pre-processing is also called as signal enhancement. The brain signals collected will contain artifacts and noise. Hence, they have to be detected and removed efficiently in the pre-processing stage to filter out the unwanted and irrelevant potentials which would otherwise corrupt the acquired brain signals. Examples of artifacts includes eye blink, muscular and eye movement, heartbeat. The signal acquired will be the input for the filter. Several filters like band pass, low pass, high pass and notch pass filters are used to eliminate the noise. Breathing process is a component which has a very low frequency. Such low frequency components with frequency of 0.5Hz and less are rejected with the help of high pass filters [10]. Noise components with frequency of 40–70 Hz are eliminated by using low pass filters. Components with null frequency of 50Hz are rejected by using notch filters.
Feature Extraction
The pre-processed signal is fed as input to the feature extraction stage. This technique will extract the necessary features of the signals which are required to further classify the signals. A feature of a signal is nothing but a distinct attribute of the signal. The human inner state can be assessed directly by recognizing the emotions from the electrical signals of the brain. There are various algorithms to perform feature extraction and some of them are mentioned below. Figure 4 shows the different algorithms used to extract the features of EEG signals.
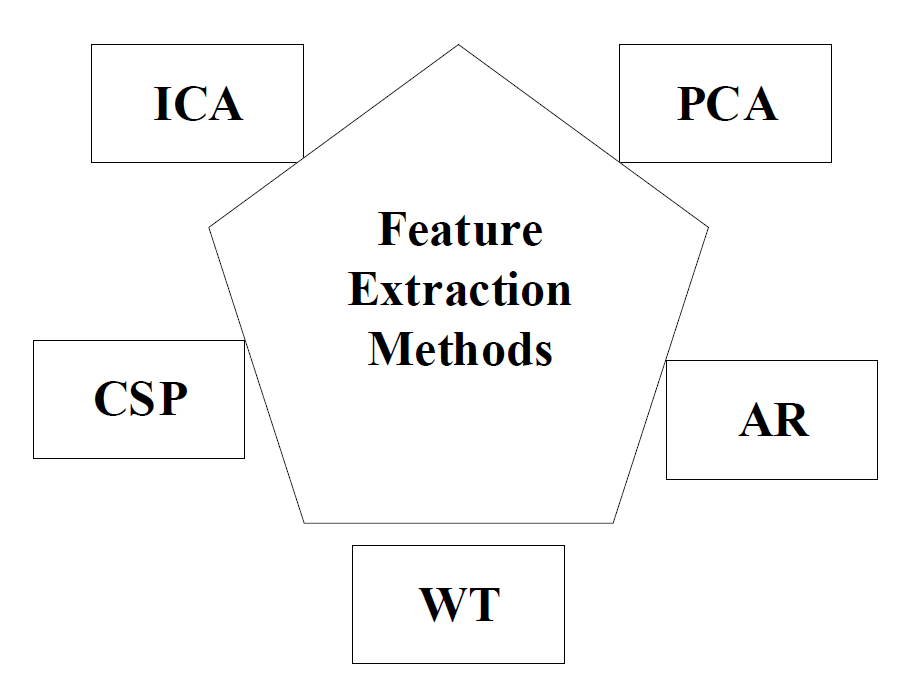
Figure 4: Feature Extraction Methods
Independent Components Analysis (ICA)
It is a mathematical and statistical technique which decomposes multiple signals into independent sub component signals. The prior information of the signal is not necessary for ICA. It is centered on the concept of components of the signal being statistically independent [11]. It reveals the factors hidden in the random variables. Several processes will generate different independent signals. Blind Source Separation problem is the major application of ICA. The source signal is multiplied by unknown mixing matrix to obtain the observation signal. The main aim of ICA is to reconstruct the source signal there by obtaining the un-mixing matrix. A significant amount of performance can be seen in ICA only if the size of the decomposing data is large. Several computations are required to decompose the signals.
Principal Component Analysis (PCA)
PCA is statistical and multivariate data technique used to reduce the dimension of the data set, increase the interpretability, minimize the loss of information and extract the unnecessary variables in the data [12].
The variables which are related to each other are transformed into variables which are linear and not correlated using orthogonal transformation. These uncorrelated components are called as Principal Components. Even though PCA is a classical, simple method, it effectively reduces the redundant data. A linear transformation is used to reduce the dimension of the signal by projecting to the lower dimensional space. PCA is commonly used to find the patterns in multi-dimensional data.
Fast Fourier Transform (FFT)
It is a technique which gives the data about the frequency of a signal. This algorithm involves many numerical calculations ranging from simple to real and complex and also ranging from mathematical to group theory. To decrease the operation time and increase the speed, FFT uses complex calculation and more time. The area of its application is found in the fields of digital signal processing, resolve differential equations and many more. FFT will convert the time domain signal to frequency domain signal by extracting the features of the signal [13]. Also, the discrete data can be converted into continuous data which are available at different frequencies. This algorithm is well suited for the processes which are linear and random in nature and also for the signals which are stationary.
Autoregressive Method (AR)
AR model has been widely used for EEG analysis. Using a parametric approach, Power Spectrum Density (PSD) of an EEG signal can be estimated by AR technique. Hence there is no spectral leakage problem and also the yield of the frequency resolution is high compared to the nonparametric approach. AR can be applied only to the stationary data. It works with an assumption that AR process can be used to approximate the real EEG signals. With this assumption, the AR model will choose its parameters in such a way that it closely fits the EEG signal measured. To identify and analyse the immediate changes occurring in the EEG signals, short epochs are chosen instead of long epochs. The FFT extracted spectra has less resolution than AR extracted spectra.
Wavelet Transform (WT)
This technique helps to extract the features of the signal in time-domain. It uses infinite number of wavelets to represent the function where every single wavelet will be having characteristics specific to the time-frequency. It is well suited to only stationary electrical signals. When compared to FFT and AR, it yields good performance as it merges time and frequency information. The size of the window used by WT varies so as to evaluate the high frequencies on shorter window and the low frequencies on longer window.
Common Spatial Pattern (CSP)
It is a two-class supervised, spatial filtering technique. CSP uses the training data which must be specific to the subject. The EEG signal is fed as input to the band filter to select the frequency. After filtering the frequency, spatial filtering is done. To distinguish the patterns of the recordings of the multiple channel EEG, spatial information is essential. To retrieve the spatial information from the EEG signal, the spatial filters are used. Such spatial filters are used by CSP to diminish the variance of one class and increase the variance of another class concurrently [14]. The EEG signals are non-stationary and hence they show remarkable inter and intra subject variations. The performance of the spatial filters for the data of the same subject collected at different time may not be up to the mark. By adding the regularization parameter to the training, the performance of CSP can be improvised (Table 1).
Table 1: Comparison of different Feature Extraction Methods
| Technique | Advantages | Limitations |
| Independent Component Analysis (ICA) | It works well when the signals are recorded from multiple channels It is a best solution for Blind Source Separation problem | The order, signs and precise amplitude of the ICA cannot be calculated |
| Principal Component Analysis (PCA) | The data overfitting is reduced Due to high variance, the visualization is improved | It is not a good choice to reduce the data if the variables have weak relationship between them The data has to be standardized before implementing PCA |
| Autoregressive Model (AR) | Frequency resolution achievement is good The spectral evaluation is reasonable for short segments | The model order must be selected properly to validate the model |
| Wavelet Transform(WT) | Exhibits an improved balance between window length and spectral resolution. It is a best option for dynamic signals | A suitable mother wavelet selection is needed |
| Common Spatial Pattern (CSP) | It is optimal for the analysis of the signals in multiple channels The frequency range can be tuned specifically for a subject | The periodic regularity cannot be handled It exhibits slow convergence. |
Classification and Computer Interaction
It is also called as translation module. The features extracted are given as input for this module. The signal features are then translated into the device commands in order to execute the intent of the user. It classifies the signals based on several parameters like frequency, shape etc. The main task of this module is to convert an independent feature component into a dependent feature component. This is accomplished by using an appropriate classifier for recognizing and detecting the emotions of the brain signals. The classifier will divide the given data into several classes and it also establishes a relationship between the emotion and the feature of an EEG signal. Several classifiers and algorithms are considered to attain precision in the system. Some of the classification algorithms used in BCI are listed as below. Figure 5 shows the different algorithms used to classify the EEG signals.
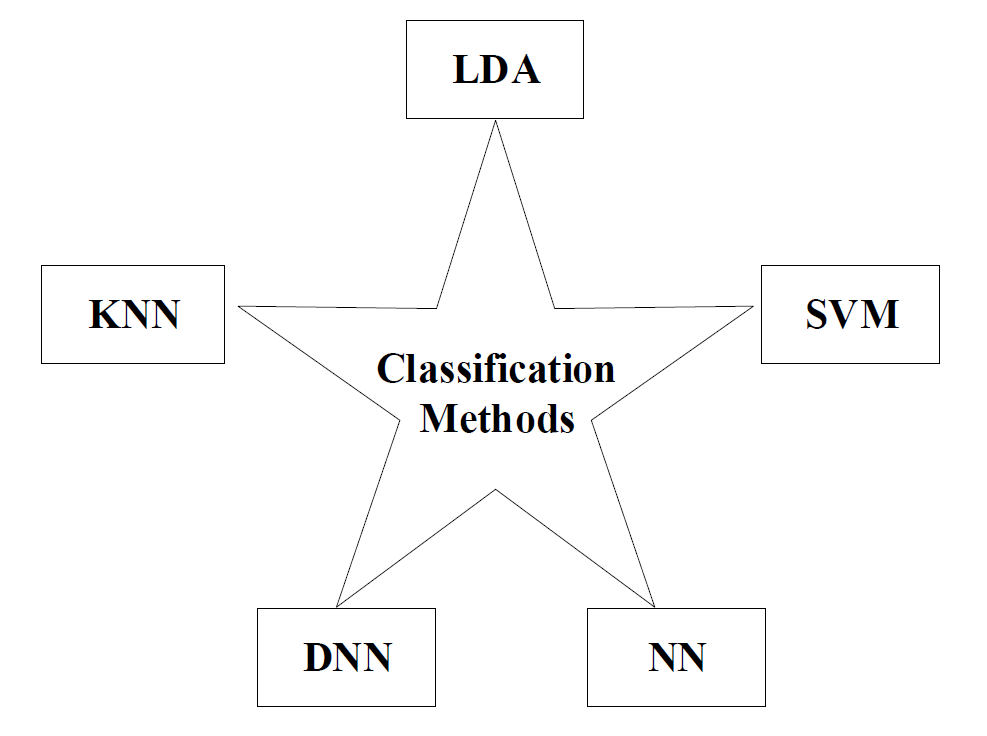
Figure 5: Classification Methods
Linear Discriminant Analysis (LDA)
It is a most commonly used, simple classifier with low computational requirement. This technique uses projection to project the data into the new space. With the assumption that the classes have normal distribution with equal matrices of covariance, LDA will classify two classes. By discovering the projection of the labelled training data, a separating hyperplane is found [15]. This will increase the interval between the means of the two classes and decreases the variance between them. The main aim of LDA is to discover the prime mixture of the features which can disconnect two or more types of events and objects. This helps in reducing the space dimension feature of the signal prior to the process of classification. A mixture of variables which are independent in nature can be represented by a variable which is dependent in nature.
When compared to KNN and SVM, LDA is said to be more robust because it is flexible in tuning the parameters and also it is less prone to the over fitting.
Support Vector Machine (SVM)
SVM is a binary classification algorithm. The physiological patterns of the EEG signal are detected using SVM. The vectors resting on the margin or the vectors which are on the separating hyperplane are identified as support vectors and they are used to describe the desirable hyperplane. SVM shows the differentiation between two classes using a discriminant hyperplane [16]. This is based on supervised learning. The hyperplane which has the largest margin is selected as the best hyperplane. This hyperplane amplifies the interval from the nearest training points. SVM is insensitive to the imprecation of dimensionality and overtraining. It also has good properties of generalization. A linear function is used as decision boundaries by the linear SVM and a kernel function is used to plot the data into the higher dimensional space by non-linear SVM.
Artificial Neural Networks (ANN)
It is a mathematical model which imitates the brain of the human in a simple mode. It is a complex structure constituting of artificial neurons which can take up many inputs and generate one output. ANN is made up of three sections namely input layer, hidden layer and output layer. In every layer of the ANN, a huge number of neurons called as nodes are connected each other with the help of weights [17]. As NN provides a classic trade off between the speed and accuracy, it is widely used in the field of BCI research. The neural signal based on time domain is taken as input and the classified user’s action is obtained as output. Finding an appropriate set of weight to use as an universal model must be the main aim of all the training algorithms. This will help in solving the problems of classification or regression.
Deep Neural Networks (DNN)
It uses a deep learning approach to provide high power and improved accuracy of the system. It provides a successful output in the area of computer vision. It is capable of learning information directly from the raw electrical signals of the brain. This reduces the time consumed in pre-processing the signals. The deep structures of DNN help to seize the latent dependencies and representative high-level features. The algorithms based on DNN are considered to be highly powerful compared to the classifiers such as SVM and LDA. Both the quantity and quality of the training data can be enhanced using the generative models of the deep learning. These models will reconstruct a group of EEG signal samples which help in enhancing the training set.
K-Nearest Neighbor (K-NN)
It is a very simple non-parametric, unsupervised learning method. The KNN algorithm will work in two steps. First step is to identify the total number of neighbours nearby. Second step is to classify all the data points in to distinct class. Euclidean distance is used to identify the nearest neighbour. From the given training set, it will select the nearest k samples. Then it will take the majority vote from the class [18]. To reduce the ambiguity, the k value must be an odd number. KNN is considered to be a lazy learner because it learns from memorized training data instead of the training data. Hence it is called an instance-based learning which do not incur any cost while learning. K-NN is very sensitive to the imprecation of dimensionality and this affects its performance. Hence good results are provided only with best feature selection and dimensionality reduction algorithms. It is very robust when the data is very noisy and large (Table 2).
Table 2: Comparison of Different Classification Methods
Technique | Advantages | Limitations |
Linear Discriminant Analysis (LDA) | It exhibits low computational requirement It is simple and more robust compared to KNN and SVM | It is not an appropriate choice for complex non-linear EEG signal |
Support Vector Machine (SVM) | Shows good properties of generalisation It is not sensitive to the imprecation of dimensionality | It is not appropriate to handle the sudden changes in the signal. |
Artificial Neural Networks (ANN) | A sensible trade-off is provided between speed and accuracy | At most care must be taken while choosing the weights |
Deep Neural Networks (DNN) | From the given raw EEG signal, it is capable of learning particular features and classifier concurrently | The process of training and testing will face huge computational complexity |
K-Nearest Neighbor (K-NN) | It is robust for large and noisy data | It is a lazy learner as it learns from the memorized data set |
Applications
The applications of BCI can be appreciated in several diverse domains of the research. The applications include and are not restricted to the below areas (Figure 6).
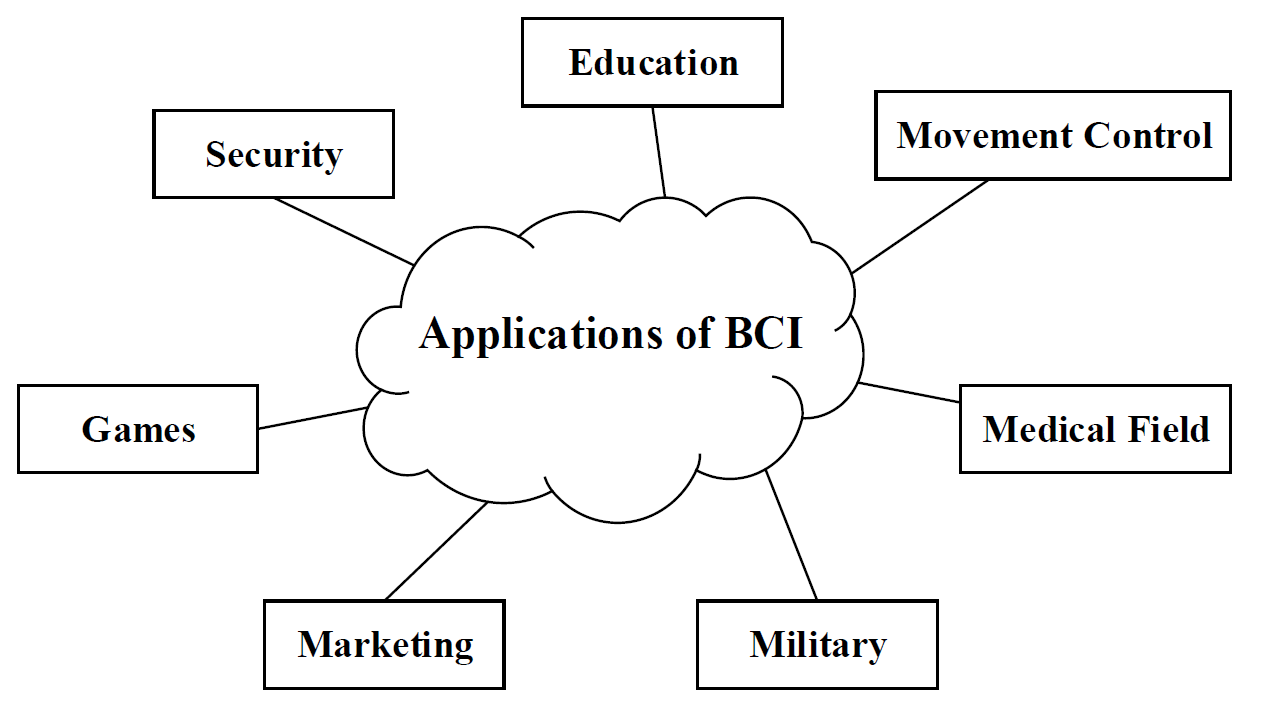
Figure 6: Applications of BCI
Education: BCI is a means to teach the disabled people how to learn spelling, use computer, play games and also applications like word processor etc. [19]. The neurofeedback which is collected in the form of electrical signals of the brain conquers the education systems to estimate the degree of clarity of the information studied. With this, a customized and individualized interaction can be achieved by every learner
Movement Control: The BCI plays a major role in the life of physically challenged people. The thoughts and opinions of such people can be expressed to the world using BCI systems thereby re-establishing their capability to communicate. They can also control many devices like computer, television, thermostat, mobile robots, wheelchair etc.
Medical Field: The BCI systems are useful in detecting and also predicting many human related health issues like epilepsy, brain tumours, sleep disorders, stroke etc. The brain structure of the people suffering from stroke can be reorganized through neuroplasticity. The prosthetic devices may be fixed to people without hand or leg. This assists them in performing their daily activities by regaining the normal functioning of the organs. BCI is also used to detect the human mood, analyse the sleep patterns, mental workloads and emotions
Military: BCI has also spread its wings in military and industry. A soldier may use BCI system to monitor the cognitive workload, to control a drone etc. BCI is a means to expand and enhance the bonding between human and machine
Marketing: The attention levels produced after watching commercial advertisements are evaluated by the BCI systems. This helps the company to plan its marketing strategies and gain profit in the market
Games: The games which are controlled by BCI aim in monitoring the level of user’s relaxation or consciousness. The results are used to design the components of the games effectively. It is also helpful in customizing and improving the experience of the player
Security: The security systems tend to be exposed to many flaws like insecure password, shoulder surfing etc. The brain signals used as source of identity information form the cognitive biometrics. And these cognitive biometrics will resolve all the vulnerabilities of the systems which involve authentication based on biometrics. It is used to generate a warning whenever an authorized user is under forced condition
Challenges
In spite of having many advantages, brain computer interface technology also faces several challenges in the field of healthcare as mentioned below:
Ethical Challenges: The ethical principle called autonomy is violated by BCI technology as it is near to impossible to get the consent from the individuals suffering from mental disability
Legal Challenges: BCI system has to collect the delicate information of the patients which need to be processed so that the brain activities are monitored. Hence these systems are vulnerable to eaves dropping, interception and data integrity which causes threat to the privacy of the patient. By processing the mental thoughts of motor disabled individuals, BCI helps them to control the devices like wheelchair, cursor, artificial limb etc. However, this is against the freedom of human though and right [20]
Interoperability: Since the data obtained from BCI cannot be exchanged using a common file format, the applications of BCI do not obey interoperability
Reliability: The signals extricated from the brain are of low strength. And hence the process of amplification has to be inculcated in the applications of BCI. Therefore, the reliability of many BCI systems is really poor
Accuracy: The brain signals are prone to error and are weak in nature. Hence the accuracy of the brain signals may not be high
Time Consuming: In order to operate and control the assistive devices, the patients need to acquire the skill set by undergoing the process of training. But the training process consumes considerable amount of time
Usability: The usability of the BCI systems is low due to the factors like aesthetics, life of the battery, heavy weight of the devices and the fatigue faced by the individuals while deploying the BCI. Hence the acceptance of BCIs by the society is low
High cost: High cost is incurred to acquire and maintain several BCI systems. Hence, they are usually not economical for motor disabled people
This paper provides an overview of BCI which acts as a channel between the human brain and external devices. Electrical signals can be captured from brain by invasive, partially invasive or non-invasive methods. The acquired signals need to be pre-processed in order to eliminate the unnecessary noises. Features are extracted using methods like ICA, PCA, AR, WT, CSP. Further the signals are classified using techniques like LDA, SVM, NN, DNN, KNN, based on some parameters. Finally, the signals are translated into the device commands in order to execute the intent of the use. Several applications of BCI and also the different challenges faced by BCI are explained in this paper.
Ramadan, R.A. et al. “Basics of Brain Computer Interface.”
Anupama, H.S. et al. “Brain computer interface and its types: A study.” International Journal of Advances in Engineering and Technology, May 2012, ISSN 2231-1963.
Ruth, R.A. et al.“Electrocochleography: Methods and Clinical Applications.”
Veena, N. and N. Anitha. “A review of non-invasive BCI devices.” International Journal of Biomedical Engineering and Technology, vol. 34, no. 3, 2020.
Glover, G.H. “Overview of functional magnetic resonance imaging.” Neurosurgery Clinics of North America, vol. 22, no. 2, April 2011, pp. 133–139.BMJ. “Positron emission tomography.” BMJ, vol. 326, no. 7404, June 2003, p. 1449, https://doi.org/10.1136/bmj.326.7404.1449.
Nicolas-Alonso, L.F. et al. “Brain computer interfaces, a Review.” 2012, https://doi.org/10.3390/s120201211.
León-Carrión, J. et al. “Functional Near-Infrared Spectroscopy (fNIRS): Principles and Neuroscientific Applications.” February 2012, https://doi.org/10.5772/23146.
“Introduction to Brain–Computer Interface.” NeuroTechEDU, learn.neurotechedu.com/introtobci/#fnirs.
Vaid, S. et al. “EEG Signal Analysis for BCI Interface: A Review.” Proceedings of the Fifth International Conference on Advanced Computing & Communication Technologies, 2015, https://doi.org/10.1109/ACCT.2015.72.
Mane, A.R. et al.“Review Paper on Feature Extraction Methods for EEG Signal Analysis.” International Journal of Emerging Trend in Engineering and Basic Sciences, vol. 2, no. 1, January–February 2015, pp. 545–552.
Mallick, A. and D. Kapgate. “A review on signal pre-processing techniques in brain computer interface.” International Journal of Computing and Technology, vol. 2, no. 4, April 2015.
Soni, B.K. et al.“Brain–computer interface: A survey on feature extraction techniques for brain signal.” International Journal of Innovative Research in Science, Engineering and Technology, vol. 5, no. 11, November 2016.
Song, X. and S.C. Yoon. “Improving brain–computer interface classification using adaptive common spatial patterns.” Computers in Biology and Medicine, vol. 61, June 2015, pp. 150–160, https://doi.org/10.1016/j.compbiomed.2015.03.023.
Aggarwal, S. and N. Chugh. “Signal processing techniques for motor imagery brain computer interface: A review.” August 2019, https://doi.org/10.1016/j.array.2019.100003.
Sreeshakthy, M. et al. “A Survey on Emotion Classification from EEG signal using various techniques and performance analysis.” I.J. Information Technology and Computer Science, vol. 12, December 2016, pp. 19–26, https://doi.org/10.5815/ijitcs.2016.12.03.
Gowri, M.S.G. and C.P.R. Raj. “A Survey on EEG feature extraction and feature classification methods in brain computer interface.” International Journal of Advanced Research in Computer and Communication Engineering, vol. 6, no. 4, April 2017, https://doi.org/10.17148/IJARCCE.2017.64133.
Bablani, A. et al. “Classification of EEG data using k-nearest neighbor approach for concealed information test.” Proceedings of the 8th International Conference on Advances in Computing and Communication (ICACC-2018), 2018, https://doi.org/10.1016/j.procs.2018.10.392.
Olaronke, I. et al. “Prospects and problems of brain computer interface in healthcare.” Current Journal of Applied Science and Technology, vol. 29, no. 6, 2018, pp. 1–17, https://doi.org/10.9734/CJAST/2018/44358.
Abdulkader, S.N. et al. “Brain computer interfacing: applications and challenges.” Egyptian Informatics Journal, vol. 16, 2015, pp. 213–230, https://doi.org/10.1016/j.eij.2015.06.002.
