+91 6002993949
submission@iarconsortium.org
Open Access
ISSN (Print) : 2788-9491
ISSN (Online) : 2788-9505
The current study aimed to investigate the mediating role of strategic behavior between strategic leadership and strategic success in Iraqi technical universities. This was prompted by a problem identified through several questions addressing the extent of the impact relationship between the variables in the field. The strategic leadership variable was measured through four dimensions: Entrepreneurial leadership, entrepreneurial thinking, entrepreneurial culture and strategic resource management. The strategic behavior variable was assessed through four dimensions: explorers, defenders, analyzers and responders. Meanwhile, the strategic success variable was evaluated based on three dimensions: survival, adaptability and growth. The study sample consisted of 253 faculty members from various administrative levels. A descriptive analytical approach was primarily adopted for presenting, analyzing and interpreting the study information. A questionnaire was used as the main tool for data collection and for statistical analysis, statistical programs (SPSS, SMART PLS 3) were employed. The study reached several conclusions, the most important being that the universities in the study sample are attentive to the dimensions of the study variables, indicating a correlation between strategic leadership and strategic behavior. Furthermore, there is a direct impact relationship between the strategic leadership variable and the strategic success variable. The current study culminated in a set of recommendations, the most significant being the necessity for the researched university administrations to clearly and accurately formulate the dimensions and strategies of strategic behavior, in addition to urging these administrations to prioritize strategic leadership due to its significant role in enhancing strategic success.
In recent years, there has been tremendous development in management thinking in general and strategic business thinking in particular, leading to a significant accumulation of knowledge and practical experience within organizations. Academic organizations play a prominent and important role in the global economy due to their extensive influence on public life. The ongoing developments and changes have affected the performance of many technical educational organizations. Strategic entrepreneurship has become a significant contemporary issue, garnering increased attention across all organizations, particularly technical universities. In the face of intense competition and rising risks among technical universities, many have recognized that the only path to achieving a competitive advantage in a changing work environment is through strategic entrepreneurship and adopting a deep strategic vision for the future. This vision aims to build a distinctive presence among competitors. Consequently, technical universities strive to identify what sets them apart from their competitors, especially under conditions of fierce competition, by proposing various alternatives to find the appropriate one that leads to achieving excellence and strategic success. This research will focus on discussing how to employ strategic entrepreneurship to achieve strategic success through the mediating role of strategic behavior, ultimately leading to some conclusions within the framework of knowledge movement to establish a strategic entrepreneurial theory.
Strategic Entrepreneurship
Strategic entrepreneurship is a new concept that originates from strategic management and entrepreneurship [1]. It refers to the integration of business (the behavior of seeking opportunities) and strategic management (the behavior of seeking advantages) [2]. Khan et al. [3] describes strategic entrepreneurship as a scientific theory within the framework of strategic management and entrepreneurship. In this context, Hitt et al. [4] clarified that strategic entrepreneurship is concerned with the simultaneous presentation of behaviors that seek opportunities and advantages, ultimately leading to greater value for individuals, organizations and society. Strategic Entrepreneurship (SE) can be considered an extension of the definition of formulating entrepreneurial strategy, integrating various strategies with the external environment.
Khan et al. [3] noted that Strategic Entrepreneurship (SE) is based on two fundamental principles: strategy formulation and implementation, which require entrepreneurial ideas such as alertness, creativity, governance and the search for opportunities (the main focus of entrepreneurship) as well as the search for advantages (the main focus of strategic management). Strategic Entrepreneurship (SE) promotes a dynamic approach that enhances sustainable business growth by integrating innovative and improved strategies.
Mazzei [5] describes strategic entrepreneurship as a conceptual field where decision-makers in organizations systematically explore creative possibilities within multifaceted dynamics. Strategic Entrepreneurship (SE) is seen as a cyclical process involving strategic entrepreneurial activities that begin with an entrepreneurial mindset to identify new opportunities. This process continues towards strategic behavior, leading the organization into the entrepreneurial movement through the adoption of creativity and innovation development [6]. Amadi and Edenkwo [7] define strategic entrepreneurship from an academic perspective as the analysis of how to explore, evaluate and exploit opportunities for creating future goods and services.
Thus, the integration of entrepreneurship with an understanding of strategic management leads us to strategic entrepreneurship. This concept encompasses the simultaneous search for opportunities (entrepreneurial orientation) and the behaviors aimed at seeking advantages (strategic orientation), resulting in high performance. Therefore, strategic entrepreneurship represents an activity with a strategic perspective. Alayoubi et al. [8] clarified that strategic entrepreneurship facilitates organizational activities by providing and employing optimal capabilities within the strategic plan, enabling rapid responses to various environmental changes. This contributes to enhancing the organization's ability to seize opportunities and mitigate future risks.
Strategic Behavior
Relationships among individuals are foundational to human life, as most human behavior occurs within the context of interactions with others. Psychologists share this view through the development of relational science, believing that the context of human relationships significantly influences individual behavior and development throughout life [9]. Thus, human behavior is defined as the manner in which an individual interacts with others, society or even objects that require specific handling [10]. Riedl et al. [11] note that strategic behavior enables organizations to gain additional opportunities to achieve their goals and understand the interconnections between strategic behaviors and the capabilities of competitors.
Hussein and Hafedh [12] emphasize that strategic behavior represents the responses of leaders to changes and developments in their environment, which inform the strategic decisions impacting organizations. Strategic behavior is a crucial topic in both strategic management and organizational behavior, focusing on the nature of behaviors adopted by top management in dealing with human resources within and outside the organization. These behaviors drive various strategic decisions related to future challenges, ensuring the organization's sustainability and operational continuity. The impact of strategic behavior extends to all stakeholders interacting with the organization, promoting alignment of interests and enhancing collaborative efforts to adopt desired strategic orientations, thus bolstering teamwork within the organization. Furthermore, strategic behavior positions managers at the forefront of new scientific knowledge, resulting from strategic management processes that occur upon adopting behavioral strategies. The survival and longevity of the organization increasingly depend on new knowledge and advanced technology. Therefore, selecting appropriate strategic behaviors will subsequently affect the organization’s outcomes [13]. Interest in the concept of strategic behavior has grown over the past five decades, with numerous researchers and writers in the field of strategy publishing scientific articles that highlight the importance of strategic behavior in organizations [14].
Thus, Svobodová and Rajchlová [15] argue that managers must be capable of identifying their customers and selecting strategic behaviors towards them to enhance their loyalty to the organization, especially in the most competitive sectors.
Strategic Success
Business organizations face significant challenges due to increasing competition and rapid changes in their operating environment. Consequently, many organizations have resorted to utilizing various modern management methodologies and philosophies to ensure their survival and success [16]. The concept of strategic success has gained considerable importance in strategic thought studies, as it relies on the extent to which an organization invests its actual capabilities in learning, transferring new knowledge and implementing it. Waldron and Antonio [17] indicated that strategic success is the organization’s ability to create added value in its operations in a way that enhances the value for stakeholders who influence and are influenced by the achievement of the organization’s goals.
David [18] affirmed that the success of any organization depends on its ability to formulate a strategy that aids in achieving long-term objectives, with this strategy needing to align with the organization's vision and mission to ensure effective implementation. Rainey [19] explained that strategic success represents the company's vision, strategic orientations and long-term goals. Gweh stressed that strategic success must be effectively implemented to promote growth and stability within the organization.
An organization can achieve strategic success by placing significant importance on market position, quality, positive change, social responsibility and both human and financial resources [20]. Orlov et al. [21] noted that strategic success depends on the organization’s ability to build its organizational capabilities and establish vital options that allow for high coordination in the efficient and effective use of available resources, contributing to outstanding results and ensuring superiority over competitors. Mahmoud [22] indicated that strategic success is reflected in the organization's ability to survive, adapt and grow in light of the objectives it seeks to achieve. The secret to strategic success lies in effective adaptability between the organization and its environment.
In summary, strategic success can be viewed as successful managerial leadership that aims to achieve the organization's goals while responding to the dynamics of the business environment. It reflects the organization's ability to achieve its strategic objectives by keeping pace with environmental developments and changes. Dawood posited that overall strategic success lies in the following aspects:
Success in formulating and implementing a strategy that significantly contributes to achieving the organization's goals
Achieving long-term success requires a holistic perspective that focuses on critical success factors or internal organizational factors, including vision and the development of intellectual capital and personnel. This ensures that the success of peer organizations is translated to the markets the organization engages with, seizing new opportunities and demonstrating the organization's ability to break boundaries and undertake high-achieving work, along with considering external factors
Research Problem
The research problem can be clarified through three aspects. First, there is the intellectual issue of interpreting the relationship between strategic leadership and strategic success, along with the mediating role of strategic behavior in that relationship. The ongoing intellectual debate regarding the current research variables has prompted researchers to delve into constructing a theoretical framework for these variables. The second aspect stems from the researchers' observations, through field visits and unstructured interviews, indicating a weak interest in the research variables within the studied sample. This suggests that strategic behavior, as a mediating variable between strategic leadership and strategic success, has not been adequately addressed. Moreover, the limited adoption of these topics in Iraqi institutions, including technical universities, has made it essential not to miss the opportunity to benefit from these insights. Therefore, this research aims to clarify the mediating role of strategic behavior in the relationship between strategic leadership and strategic success, based on the perspectives of the sample from four technical universities.
The final aspect focuses on transforming the researchers' formed perceptions into questions. Based on the above, the research problem is delineated through the following set of questions:
Does strategic behavior, in its combined dimensions, act as a mediating variable in the relationship between strategic leadership, in its combined dimensions and strategic success, in its combined dimensions, in the studied technical universities?
To what extent does strategic leadership, in its combined dimensions, influence the studied technical universities?
How significantly does strategic behavior, in its combined dimensions, affect the sample in the technical universities?
What is the level of achievement of strategic success, in its combined dimensions, in the studied technical universities?
What is the level and direction of the relationships of influence and correlation among the research variables?
Importance of the Research
The importance of this research lies in three areas. The first area pertains to the intellectual and philosophical significance of the three research variables. Researchers have engaged with these variables in study and analysis and this ongoing interest encourages further exploration by others. The second area relates to the application environment, which is crucial for all institutions (both public and private) employing qualified personnel in skills, intellect and psychology. This necessitates providing a work environment free from negative influences, positively impacting the quality of outcomes.
The third area concerns the potential contribution of this research to enriching knowledge on topics that are relatively lacking in the Arabic and specifically Iraqi literature, such as strategic leadership, strategic behavior and strategic success. This enrichment extends beyond the intellectual aspects of the variables to explore their potential interrelations through logical analysis and practical testing of various hypotheses. Additionally, this research builds on previous studies by highlighting the barriers governing these variables. It is hoped that the findings will benefit educational institutions in our country generally and the entities involved in the research sample specifically, by creating a comprehensive framework to identify strengths and weaknesses in strategic leadership and strategic behavior, as well as the importance of qualifications for strategic success, ultimately contributing to improvement efforts.
Hypothetical Framework of the Research
Figure 1 illustrates the research framework, highlighting the set of variables constituting the current study. It provides an initial overview of the correlation and influence relationships among the current research variables. This framework aligns with the research problem, its questions and the overall design. The research hypotheses have been formulated based on a confirmatory hypothesis approach, aiming to investigate and validate these relationships quantitatively.
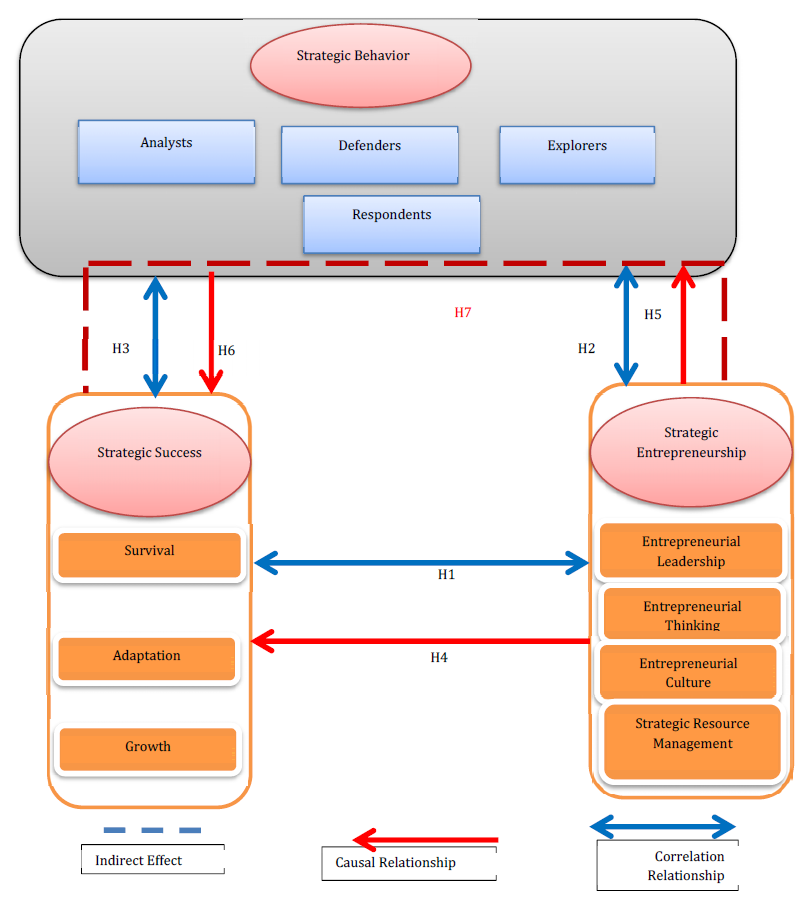
Figure 1: Hypothetical Diagram
Hypothetical Diagram
Research Hypotheses
There is a significant correlation between strategic entrepreneurship and strategic success
There is a significant correlation between strategic entrepreneurship and strategic behavior
There is a significant correlation between strategic behavior and strategic success
There is a statistically significant effect between the strategic entrepreneurship variable and the strategic success variable
There is a statistically significant effect between the dimensions of strategic entrepreneurship and strategic behavior
There is a statistically significant effect between the dimensions of strategic behavior and strategic success
Strategic behavior mediates the relationship between strategic entrepreneurship and strategic success
Research Boundaries
Spatial Boundaries: The four technical universities (Southern Technical University, Al-Furat Al-Awsat Technical University, Middle Technical University and Northern Technical University).
Human Boundaries
The human boundaries of this research are represented by the faculty members at Iraqi technical universities, totaling 253 faculty members.
Scientific Boundaries
The researcher relied on (Mansour et al.) to define and measure strategic entrepreneurship and its dimensions. For measuring strategic behavior and its dimensions, Martins et al. was referenced. Finally, Katz and Creen was used to measure the strategic success variable and its dimensions.
Temporal Boundaries
In line with the themes of the current research, the temporal boundaries included three time periods: The first period involved preliminary surveys of the universities in the research sample, which spanned from 02/01/2024 to 03/01/2024. The second period, related to the theoretical framework and field research
application, extended from 04/15/2024 to 06/15/2024. The final period focused on statistical analysis and research results, spanning from 06/20/2024 to 07/25/2024.
Statistical Results
Statistical Programs Used: The SPSS program was utilized to describe the nature of the variables by calculating the mean, standard deviation, frequencies and coefficient of variation. Additionally, PLS Smart 3 was used, a specialized program for path analysis based on partial least squares method, with a significance level of 5%.
Description of the Study Sample
We observe from the following Table 1:
The percentage of males in the sample was higher than that of females, with males constituting 67.6% while females accounted for 32.41%
Age: The highest age group in the study sample was the (30-40) age range, comprising 41.1%, followed by the (40-50) age group at 25%. The lowest percentage was for those aged 60 and above, at 2%
Position: The largest percentage in the study sample were faculty members, making up 76%, followed by department heads at 19.8%
Academic Title: The highest percentage was among those with the title of Assistant Lecturer, at 41.9%, followed by Associate Professors at 36.8%. The lowest percentage was for Professors, at 5.9%
Degree: The largest percentage of holders were Master's degree holders, accounting for 53%
Years of Service: The highest percentage among the sample members were those with 5-10 years of service, at 23.3%, followed by those with 25 years or more, at 19%
Table 1: The Distribution of the Sample Participants Based on General Information
Variable | Frequency | Percentage | |
Gender | Male | 171 | 67.6 |
Female | 82 | 32.4 | |
Age | 20-30 | 6 | 2.4 |
30-40 | 104 | 41.1 | |
40-50 | 65 | 25.7 | |
50-60 | 73 | 28.9 | |
60 and above | 5 | 2.0 | |
Position or Job Title | Faculty Member | 193 | 76.3 |
Department Head | 50 | 19.8 | |
Vice President | 5 | 2.0 | |
Dean or Assistant Dean | 5 | 2.0 | |
Academic Title | Professor | 15 | 5.9 |
Associate Professor | 93 | 36.8 | |
Lecturer | 39 | 15.4 | |
Assistant Lecturer | 106 | 41.9 | |
Degree | PhD | 118 | 46.6 |
Master's Degree | 135 | 53.4 | |
Years of Service
| 5-10 | 76 | 30.0 |
11-15 | 59 | 23.3 | |
16-20 | 35 | 13.8 | |
21-25 | 35 | 13.8 | |
25 and above | 48 | 19.0 | |
Total | 253 | 100.0 | |
Source: Prepared by the researcher using SPSS outputs
Description of the Study Sample Responses
Table 2 presents the average responses of the sample participants to the questionnaire items.
Table 2: Presents the Average Responses of the Sample Participants to the Questionnaire Items
Code | Item | Mean | Standard Deviation | Response Level |
Variable: Strategic Entrepreneurship | ||||
X1 | The university has a visionary leadership for both the organization and its staff. | 4.04 | 1.08 | Agree |
X2 | University leaders have the ability to make and implement strategic decisions. | 3.97 | 1.07 | Agree |
X3 | The leadership can address workplace issues effectively. | 3.96 | 1.11 | Agree |
X4 | University leaders strive to find innovative solutions to problems. | 3.65 | 1.17 | Agree |
X5 | There are indicators that reflect the satisfaction of stakeholders' desires and aspirations. | 3.57 | 1.06 | Agree |
X6 | Necessary metrics are available to assess the university's impact on the community and environment. | 3.70 | 1.23 | Agree |
X7 | The university seeks to achieve strategic entrepreneurship by providing opportunities for staff learning. | 3.67 | 1.03 | Agree |
X8 | Previous strategic decisions that proved effective are utilized in current decision-making. | 3.54 | 1.11 | Agree |
X9 | The university prioritizes understanding the components of organizational culture and the factors that influence it. | 3.66 | 1.13 | Agree |
X10 | Innovation is a fundamental part of the university's strategies. | 3.59 | 1.17 | Agree |
X11 | The university encourages initiative and risk-taking as essential practices. | 3.66 | 1.19 | Agree |
X12 | Employees are encouraged to share and express their ideas. | 3.71 | 1.22 | Agree |
X13 | The university aims for optimal resource investment to achieve strategic entrepreneurship. | 3.80 | 1.12 | Agree |
X14 | Efforts are made to minimize costs as much as possible. | 3.93 | 1.07 | Agree |
X15 | Processes and operating methods are monitored to ensure high performance levels. | 3.72 | 1.11 | Agree |
X16 | Continuous development of university operations is ensured to achieve strategic entrepreneurship. | 3.66 | 1.17 | Agree |
Variable: Strategic Behavior | ||||
Z1 | The university has the ability to identify opportunities that enhance its services. | 3.79 | 1.02 | Agree |
Z2 | The university continuously monitors competitors in the local and regional environment. | 3.66 | 1.18 | Agree |
Z3 | The university seeks to develop and improve its services. | 3.79 | 1.15 | Agree |
Z4 | Research and development are relied upon to face competition. | 3.65 | 1.21 | Agree |
Z5 | The university has the capacity to maintain its position in the business environment. | 3.83 | 1.10 | Agree |
Z6 | The university strives to consistently develop its service features, such as adopting electronic automation. | 3.94 | 1.08 | Agree |
Z7 | The university is focused on addressing risks that could hinder its current operations. | 3.75 | 1.09 | Agree |
Z8 | The university works to improve the efficiency of its existing processes. | 4.00 | 0.99 | Agree |
Z9 | University leaders possess high analytical capabilities. | 3.85 | 1.01 | Agree |
Z10 | University leadership considers the impact of competitors in the business environment. | 3.72 | 1.09 | Agree |
Z11 | University leadership is committed to maintaining the success of its current services. | 4.01 | 1.10 | Agree |
Z12 | Leadership analyzes decisions before making them to avoid risks. | 3.70 | 1.06 | Agree |
Z13 | University leaders are capable of responding to changes and circumstances. | 3.77 | 1.15 | Agree |
Z14 | Leadership responds to risks arising from environmental changes. | 3.75 | 1.06 | Agree |
Z15 | The university confronts its competitors based on ongoing adjustments. | 3.78 | 1.09 | Agree |
Z16 | University leadership seeks to understand the causes of environmental changes. | 3.66 | 1.15 | Agree |
Variable: Strategic Success | ||||
Y1 | The university's ability to remain competitive is a success in itself. | 4.14 | 1.02 | Agree |
Y2 | The university seeks to secure the necessary resources to continue providing the best services. | 4.01 | 1.05 | Agree |
Y3 | University leadership is committed to satisfying employees by providing a suitable work environment. | 3.75 | 1.22 | Agree |
Y4 | There is clarity among staff regarding the strategic goals the university aims to achieve in order to stay competitive. | 3.82 | 1.06 | Agree |
Y5 | University leadership aims to utilize modern technological techniques that enable adaptation to the environment. | 4.00 | 1.07 | Agree |
Y6 | The university is focused on adapting to sudden changes in the surrounding environment. | 3.88 | 1.21 | Agree |
Y7 | The university strives to adapt to environmental changes through modifications in structures and administrative procedures. | 3.92 | 1.12 | Agree |
Y8 | Employees adapt flexibly to changes in both the internal and external environments of the university. | 3.68 | 1.15 | Agree |
Y9 | Growth is a motivating factor for seizing opportunities. | 3.94 | 1.11 | Agree |
Y10 | The university aims to produce technically skilled graduates to meet the increasing demands of the job market. | 3.96 | 1.18 | Agree |
Y11 | The university's growth injects vitality and energy through the challenges it faces and the returns it generates. | 3.81 | 1.05 | Agree |
Y12 | Growth is one of the primary objectives the university seeks to achieve. | 4.03 | 1.07 | Agree |
Source: Prepared by the researcher using SPSS outputs
Descriptive Analysis of the Main Study Variables
Table 3 illustrates the descriptive analysis of the main study variables.
Table 3: Illustrates the Descriptive Analysis of the Main Study Variables
Main Variables | Mean | Std. Deviation | C.V |
Strategic Entrepreneurship | 3.74 | 0.96 | 25.60 |
Strategic Behavior | 3.79 | 0.96 | 25.40 |
Strategic Success | 3.91 | 0.97 | 24.87 |
Source: Prepared by the researcher using SPSS outputs
Normality Test
A normality test is conducted to determine whether the data follows a normal distribution, which is necessary for performing specific statistical tests for the research hypotheses (Table 4).
Table 4: Presents the Results of the Normality Test for the Study Data
Parameter | Kolmogorov-Smirnova | Shapiro-Wilk | ||||
Statistic | df | Sig. | Statistic | df | Sig. | |
Strategic Entrepreneurship | 0.103 | 253 | 0.000 | 0.900 | 253 | 0.000 |
Strategic Behavior | 0.141 | 253 | 0.000 | 0.893 | 253 | 0.000 |
Strategic Success | 0.183 | 253 | 0.000 | 0.845 | 253 | 0.000 |
Source: Prepared by the researcher using SPSS outputs
If the data is not normally distributed, alternative tests will be conducted to achieve the study's hypothesis. The null hypothesis for the normality test is:
Null Hypothesis: The data is normally distributed.
Alternative Hypothesis: The data is not normally distributed
SEM-PLS Methodology for Evaluating the Quality of the Research Model
This evaluation determines whether the model possesses better discriminant validity compared to other possible constructs and it involves two phases:
First: Assessing and testing the nature of the correlational relationships between the research variables and their corresponding indicators, referred to as the measurement assessment phase
Second: Evaluating the relationship and the goodness of fit of the model among the latent variables in the research model, known as the structural model assessment phase. The results of the SEM-PLS methodology are outlined as follows:
Measurement Model Assessment
The aim of this assessment is to ensure the validity and reliability of the variables and their indicators. Table 5 presents the criteria for evaluating the measurement model's reliability and convergent validity.
Table 5: The Criteria for Evaluating the Measurement Model's Reliability and Convergent Validity
Parameter | Variables | External Loadings: Should be greater than 0.7 | Variance Extracted (AVE): Should be greater than 0.5 | Cronbach's Alpha: The reliability coefficient should be greater than 0.7 |
Entrepreneurial Leadership | X1 | 0.928 | 0.856 | 0.944 |
X2 | 0.944 | |||
X3 | 0.923 | |||
X4 | 0.904 | |||
Entrepreneurial Thinking | X5 | 0.899 | 0.86 | 0.946 |
X6 | 0.876 | |||
X7 | 0.913 | |||
X8 | 0.811 | |||
Entrepreneurial Culture | X9 | 0.913 | 0.839 | 0.936 |
X10 | 0.926 | |||
X11 | 0.952 | |||
X12 | 0.916 | |||
Strategic Resource Management | X13 | 0.922 | 0.767 | 0.899 |
X14 | 0.874 | |||
X15 | 0.944 | |||
X16 | 0.912 | |||
Explorers | Z1 | 0.841 | 0.859 | 0.945 |
Z2 | 0.933 | |||
Z3 | 0.92 | |||
Z4 | 0.87 | |||
Defenders | Z5 | 0.92 | 0.834 | 0.934 |
Z6 | 0.949 | |||
Z7 | 0.932 | |||
Z8 | 0.908 | |||
Analysts | Z9 | 0.897 | 0.809 | 0.921 |
Z10 | 0.92 | |||
Z11 | 0.926 | |||
Z12 | 0.92 | |||
Respondents | Z13 | 0.908 | 0.862 | 0.947 |
Z14 | 0.868 | |||
Z15 | 0.904 | |||
Z16 | 0.917 | |||
Survival | Y1 | 0.953 | 0.836 | 0.935 |
Y2 | 0.919 | |||
Y3 | 0.922 | |||
Y4 | 0.92 | |||
Adaptation | Y5 | 0.927 | 0.856 | 0.944 |
Y6 | 0.92 | |||
Y7 | 0.896 | |||
Y8 | 0.915 | |||
Growth | Y9 | 0.925 | 0.795 | 0.914 |
Y10 | 0.946 | |||
Y11 | 0.945 | |||
Y12 | 0.883 |
Source: Prepared by the researcher using SMART PLS outputs
To assess convergent validity, we note that the external loadings should be greater than 0.7 for each indicator. If this condition is not met, indicators with external loadings less than 0.7 are removed and the model is reevaluated to achieve the best AVE value, aiming to ensure the items are closely related to each other.
From the table, we observe that the external loadings for all indicators and variables in the study are above 0.7, indicating that the model has high levels of convergent validity. Additionally, the AVE values for the latent variables, which should exceed 0.5, range from 0.76 to 0.89. This suggests that the variables (strategic entrepreneurship, strategic behavior and strategic success) and their indicators exhibit convergent validity. Furthermore, the Cronbach's Alpha values for all variables are above 0.7, indicating the model's reliability.
Discriminant Validity (Discriminatory Validity)
This criterion assesses whether the indicators measuring a specific latent variable do not measure another latent variable. Using the Fornell-Larcker criterion to calculate correlations, the results are shown in the following Table 6 and 7 (Figure 2).
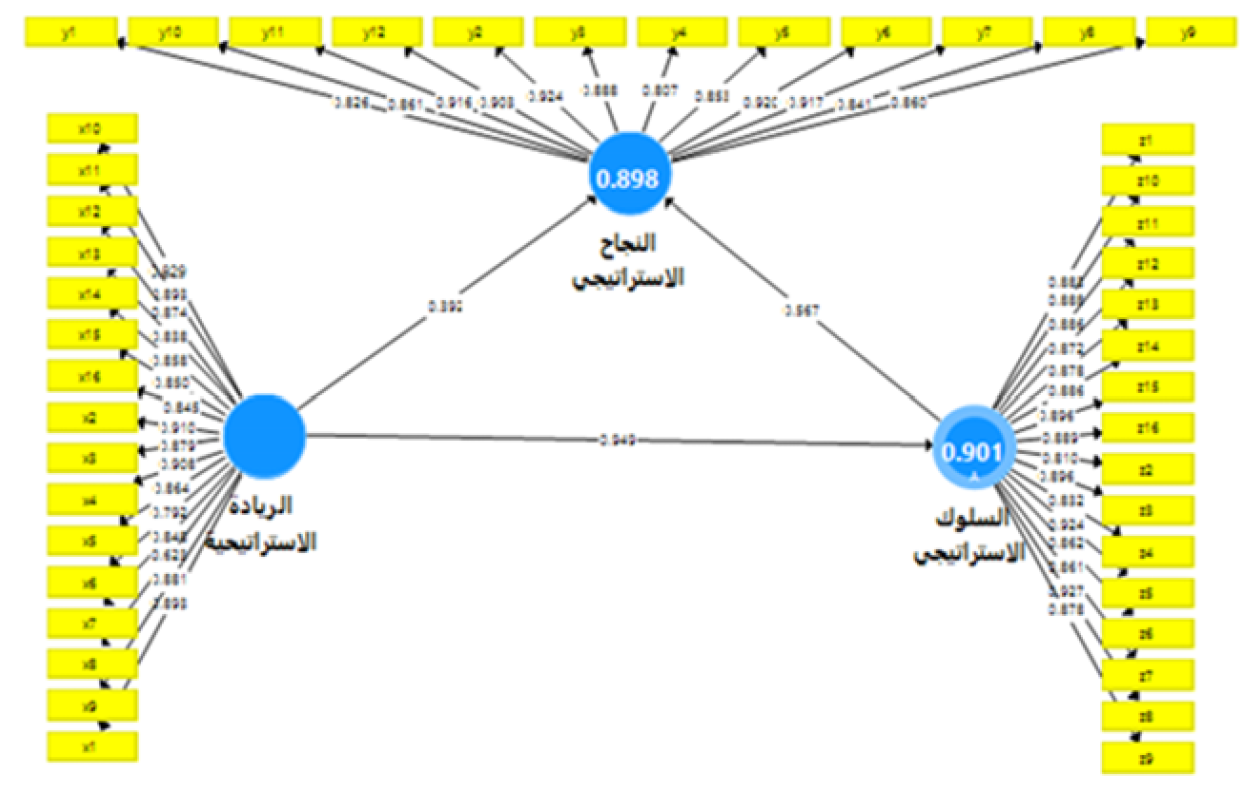
Figure 2: Discriminant Validity (Loading Coefficients)
Source: Prepared by the researcher using SMART PLS outputs
Table 6: The Correlation Coefficients Between the Study Variables, Indicating their Discriminant Validity
| Parameter | Entrepreneurial Leadership | Entrepreneurial Thinking | Entrepreneurial Culture | Strategic Resource Management | Explorers | Defenders | Analysts | Respondents | Survival | Adaptation | Growth |
Entrepreneurial Leadership | 0.89 |
|
|
|
|
|
|
|
|
|
|
Entrepreneurial Thinking | 0.83 | 0.87 |
|
|
|
|
|
|
|
|
|
Entrepreneurial Culture | 0.88 | 0.87 | 0.89 |
|
|
|
|
|
|
|
|
Strategic Resource Management | 0.87 | 0.85 | 0.84 | 0.88 |
|
|
|
|
|
|
|
Explorers | 0.89 | 0.84 | 0.78 | 0.78 | 0.83 |
|
|
|
|
|
|
Defenders | 0.87 | 0.80 | 0.81 | 0.76 | 0.84 | 0.81 |
|
|
|
|
|
Analysts | 0.87 | 0.83 | 0.85 | 0.76 | 0.82 | 0.82 | 0.80 |
|
|
|
|
Respondents | 0.81 | 0.87 | 0.86 | 0.87 | 0.84 | 0.88 | 0.84 | 0.83 |
|
|
|
Survival | 0.85 | 0.81 | 0.87 | 0.79 | 0.79 | 0.86 | 0.89 | 0.89 | 0.81 |
|
|
Adaptation | 0.88 | 0.88 | 0.87 | 0.86 | 0.84 | 0.88 | 0.87 | 0.80 | 0.81 | 0.83 |
|
Growth | 0.89 | 0.88 | 0.79 | 0.81 | 0.84 | 0.70 | 0.88 | 0.89 | 0.87 | 0.81 | 0.89 |
Source: Prepared by the Researcher using SMART PLS Outputs
Table 7: The Discriminant Validity (Loading Coefficients) for Cross-Loading
Parameter | Strategic Entrepreneurship | Strategic Behavior | Strategic Success | ||
Strategic Entrepreneurship
| Entrepreneurial Leadership
| x1 | 0.893 | 0.84 | 0.868 |
x2 | 0.91 | 0.832 | 0.836 | ||
x3 | 0.879 | 0.811 | 0.819 | ||
x4 | 0.908 | 0.846 | 0.861 | ||
Entrepreneurial Thinking
| x5 | 0.864 | 0.835 | 0.851 | |
x6 | 0.792 | 0.737 | 0.711 | ||
x7 | 0.858 | 0.84 | 0.813 | ||
x8 | 0.623 | 0.577 | 0.571 | ||
Entrepreneurial Culture | x9 | 0.881 | 0.814 | 0.816 | |
x10 | 0.829 | 0.749 | 0.748 | ||
x11 | 0.893 | 0.808 | 0.811 | ||
x12 | 0.874 | 0.773 | 0.81 | ||
Strategic Resource Management
| x13 | 0.859 | 0.767 | 0.835 | |
x14 | 0.858 | 0.844 | 0.84 | ||
x15 | 0.891 | 0.789 | 0.855 | ||
x16 | 0.845 | 0.77 | 0.833 | ||
Strategic Behavior
| Explorers | z1 | 0.814 | 0.851 | 0.813 |
z2 | 0.739 | 0.844 | 0.81 | ||
z3 | 0.881 | 0.899 | 0.866 | ||
z4 | 0.811 | 0.864 | 0.832 | ||
Defenders | z5 | 0.887 | 0.894 | 0.824 | |
z6 | 0.858 | 0.885 | 0.862 | ||
z7 | 0.868 | 0.896 | 0.861 | ||
z8 | 0.848 | 0.899 | 0.827 | ||
Analysts | z9 | 0.785 | 0.893 | 0.878 | |
z10 | 0.828 | 0.896 | 0.888 | ||
z11 | 0.814 | 0.823 | 0.816 | ||
z12 | 0.795 | 0.919 | 0.872 | ||
Respondents | z13 | 0.856 | 0.899 | 0.878 | |
z14 | 0.857 | 0.884 | 0.836 | ||
z15 | 0.85 | 0.878 | 0.832 | ||
z16 | 0.85 | 0.895 | 0.829 | ||
Strategic Success
| Survival | y1 | 0.786 | 0.826 | 0.883 |
y2 | 0.885 | 0.924 | 0.952 | ||
y3 | 0.855 | 0.888 | 0.866 | ||
y4 | 0.748 | 0.807 | 0.88 | ||
Adaptation | y5 | 0.808 | 0.853 | 0.893 | |
y6 | 0.825 | 0.92 | 0.948 | ||
y7 | 0.825 | 0.917 | 0.974 | ||
y8 | 0.819 | 0.841 | 0.883 | ||
Growth | y9 | 0.759 | 0.86 | 0.875 | |
y10 | 0.774 | 0.861 | 0.896 | ||
y11 | 0.839 | 0.916 | 0.935 | ||
y12 | 0.86 | 0.903 | 0.936 | ||
Source: Prepared by the researcher using SMART PLS outputs
Structural Model
To test the research hypotheses, SMART PLS 3 and SPSS were used for path analysis to verify that strategic behavior serves as a mediating variable between the relationship of strategic entrepreneurship and strategic success (Table 8).
Table 8: The Study Hypotheses and Measures the Effects of Direct and Indirect Relationships
| Hypotheses/Type of Effect | Relationship | Beta Coefficient | Sample Mean | Standard Deviation | t-test | p-value | Decision |
H1/Direct Effect | Strategic Entrepreneurship → Strategic Behavior | 0.943 | 3.73 | 0.957 | 39.437 | 0 | Accept H1 |
H2/Direct Effect | Strategic Entrepreneurship → Strategic Success | 0.392 | 3.789 | 0.962 | 46.66 | 0 | Accept h2 |
H3/Direct Effect | Strategic Behavior → Strategic Success | 0.567 | 3.911 | 0.972 | 42.85 | 0 | Accept h3 |
H4/Direct Effect | Strategic Entrepreneurship → Strategic Behavior through Strategic Success | 0.538 | 3.48 | 0.925 | 18.365 | 0 | Accept h4 |
Source: Prepared by the researcher using SMART PLS outputs
It is noteworthy that there are three types of mediation between variables: complete mediation, complementary partial mediation and competitive partial mediation. Complete mediation occurs when both direct and indirect effects are not statistically significant, meaning they have no impact. Complementary partial mediation occurs when both the direct and indirect effects are statistically significant. Competitive mediation occurs when the direct effect is significant while the indirect effect is not. Consequently, the type of mediation between strategic entrepreneurship and strategic success is complementary partial mediation and they both move in the same direction, indicating a positive effect.
The Figure 3 illustrates the nature of the relationships between the variables.
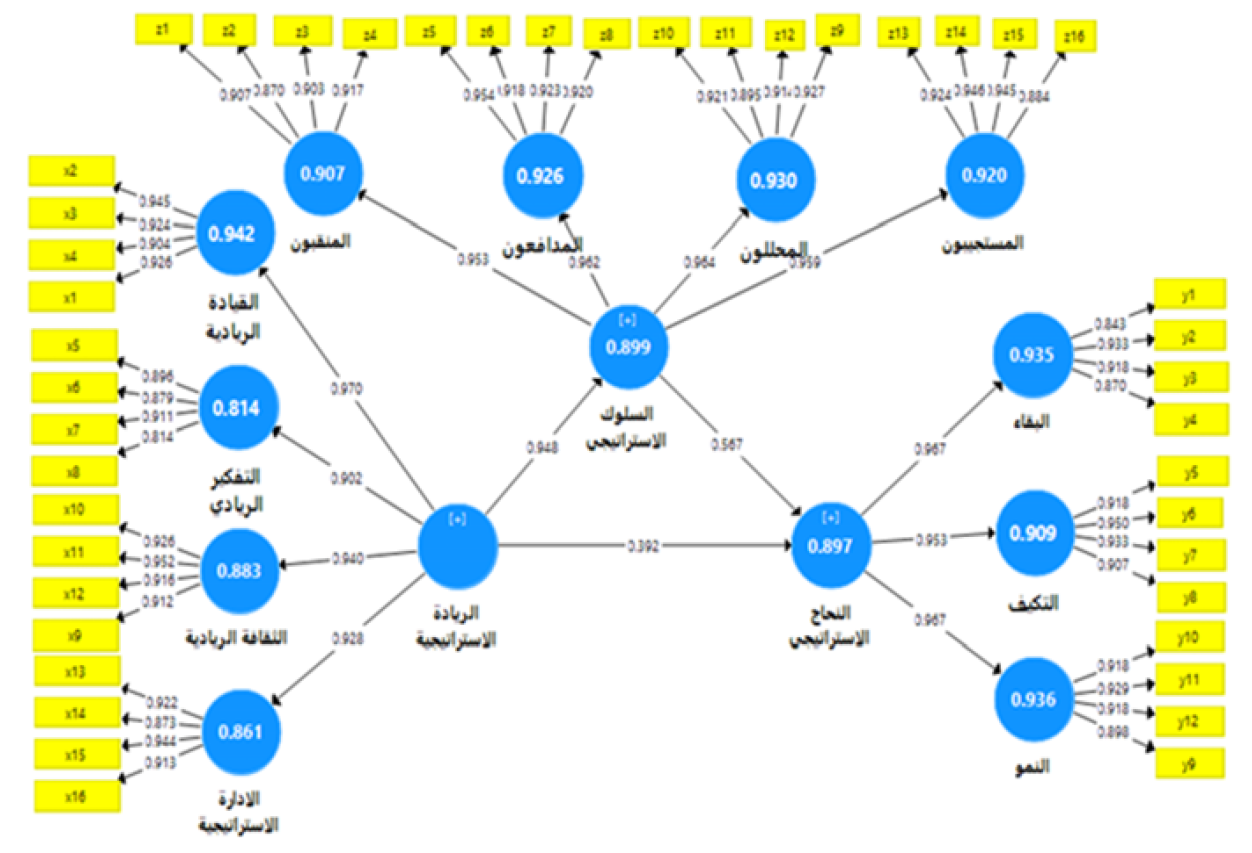
Figure 3: The Relationship Between the Study Variables
Interpretation of the coefficient of determination and effect size in Table 9.
Table 9: The Values of R2, f2 and Q2 for the Study Model
Variable | R2 | F2 | Q2 |
Strategic behavior | 0.89 | 0.532 | 0.347 |
Strategic success | 0.77 | 2.31 | 0.521 |
Source: Prepared by the Researcher, SMART PLS Outputs
Concerning the Responses of the Study Sample
From Table 2, we observe a description of the sample responses for the study variables, which shows that all the study indicators were agreed upon by the sample participants.
Descriptive Analysis of the Main Study Variables
When examining the study variables as a whole, we notice that the average for the strategic leadership variable tends towards agreement, as well as for the strategic behavior and strategic success variables. Additionally, we observe that the coefficient of variation is less than 30%, which indicates homogeneity and agreement among the sample participants on these responses.
Normality Test
From the results in Table 4, we observe whether the data follows a normal distribution. It is evident that the hypothesis is rejected, meaning that the data does not follow a normal distribution, which necessitates using PLS-SEM modeling through the SMART PLS 3 software.
Correlation Coefficient between the Study Variables
Table 6 demonstrates the strength of the correlation between the latent variables. This indicates that the model has discriminant validity, as all values are below the threshold level of 0.9 for each latent variable. This means there is no overlap between the variables and each variable represents itself. This also confirms the model's suitability for measurement and analysis. Additionally, we observe that the indicators within the constructs do not suffer from multicollinearity issues. For instance, the Fornell-Larcker criterion for the strategic leadership variable, one of the independent variables, showed a significance level of 0.89. Similarly, the "explorers" variable, one of the mediating variables, recorded 0.83, while "sustainability," one of the dependent variables, recorded 0.81.
Discriminant Validity (Cross Loadings)
Table 7 presents the external loadings of the variables. By comparing these with the cross-loadings of the other variables, it is evident that they recorded the highest values. As shown in the table, the items for each construct achieved the highest values compared to the other items. For instance, in the strategic leadership construct, values ranged between 0.623 and 0.91. In the strategic behavior construct, the values ranged between 0.823 and 0.919, while for strategic success, the values ranged between 0.875 and 0.974, as illustrated in Figure 2.
The Structural Model
Evaluation of the Study Hypotheses and Measurement of Direct and Indirect Effects: From the results in Table 8 and the outputs of the Smart PLS program, it is observed that there is a positive and statistically significant relationship between strategic leadership and strategic behavior, as the t-test value for the parameter significance was high (39.437). Consequently, the p-value was less than 0.05%, which means the null hypothesis is rejected and the alternative hypothesis is accepted, stating that there is a direct effect between strategic leadership and strategic behavior.
Additionally, the Table 8 shows that there is a direct effect relationship between the strategic leadership variable and the strategic success variable, which is positive and significant. The t-test value for parameter significance was 46.66, resulting in a p-value less than 5%. This leads to rejecting the null hypothesis and accepting the alternative hypothesis, which states that there is a direct effect relationship between the strategic leadership variable and strategic success.
Similarly, the table shows a direct effect relationship between the strategic behavior variable and the strategic success variable, which is positive and significant. The t-test value for parameter significance was 42.85, leading to a p-value of less than 5% and thus, the null hypothesis is rejected and the alternative hypothesis is accepted, stating that there is a direct effect relationship between strategic behavior and strategic success.
Furthermore, there is an indirect effect relationship between strategic leadership and strategic success, with strategic behavior as a mediating variable. The t-test value for parameter significance was 18.362, which is statistically significant at the 5% level. This means that the alternative hypothesis is accepted, stating that there is an indirect effect relationship between strategic leadership and strategic success, with strategic behavior as a mediating variable. The total effect value (direct effect+ indirect effect) was 0.329+0.538 = 0.867.
It is evident from Table 9 that the value of the R2 coefficient for the dependent variable, strategic success, is 0.89, which is considered high according to Falk and Miller. They explained that if the coefficient of determination is greater than 67%, it is considered high, if greater than 33%, it is considered moderate and if the value is less than 19%, it is considered low and is rejected. Therefore, the coefficient of determination for this model is considered high. The interpretation of the coefficient of determination shows that the strategic leadership variable could explain 77% of the variance in strategic success, while the combination of strategic leadership and strategic behavior could explain 89% of the variance in strategic success.
As for the F2 value, Cohen explained that if the model's results achieve 35%, the effect size is considered high. If the results range between 0.02 and 0.15, the effect size is considered small and anything lower is deemed to have no effect. From the Table 9, it is observed that the value was higher than 35%, indicating that the effect size was high.
In analyzing predictive ability, which refers to the model's capacity to predict the dependent variable, we observe from the table that the Q2 value is greater than zero, indicating an acceptable value.
Boudreaux, C.J. “The Importance of Industry to Strategic Entrepreneurship: Evidence from the Kauffman Firm Survey.” Journal of Industry, Competition and Trade, Vol. 20, pp. 93-114, 2020.
Ireland, R.D. et al.“Strategic Kauffman Firm Survey.” Journal of Industry, Competition and Trade, vol. 20, no. 1, 2023, pp. 93-114.
Khan, S. et al. “Analysing the Barriers of Strategic Entrepreneurship: A DEMATEL Approach.” Sustainability, vol. 16, no. 11, 2024.
Hitt, M.A. et al.“Strategic Entrepreneurship: Entrepreneurial Strategies for Wealth Creation.” Strategic Management Journal, vol. 22, no. 6-7, 2001, pp. 479-491.
Mazzei, M.J. “Strategic Entrepreneurship: Content, Process, Context and Outcomes.” International Entrepreneurship and Management Journal, vol. 14, 2018, pp. 657-670.
Alshagawi, M. and H. Mabkhot. “The Impact of Strategic Entrepreneurship and Entrepreneurial Marketing, Entrepreneurship Values on Small and Medium Enterprises’ Performance: Evidence from Saudi Arabia.” Cogent Business & Management, vol. 11, no. 1, 2024.
Amadi, K.I. and C.T. Edenkwo. “Strategic Entrepreneurship and Firm Performance: A Conceptual Discourse.” International Journal of Business, Economics and Entrepreneurship Development in Africa, vol. 13, no. 11, 2024.
Alayoubi, M. et al. “Requirements for Applying the Strategic Entrepreneurship as an Entry Point to Enhance Technical Innovation: Case Study-Palestine Technical College-Deir al-Balah.” International Journal of Business and Management Invention, vol. 9, no. 3, 2020, pp. 1-17.
Reis, H.T. et al. “The Relationship Context of Human Behavior and Development.” Psychological Bulletin, vol. 126, no. 6, 2000.
Tsauri, S. “Behaviour Modification.” Regional Training Seminar on Guidance and Counselling Module 4: Behaviour Modification, vol. 47, no. 2, 2000, pp. 495-523. https://doi. org/10.1177/10422587221111727.
Riedl, C. et al. “Strategic Behavior in Contests with Ability Heterogeneous Contestants: Evidence from Field Data.” SSRN Electronic Journal, 2020. https://doi.org/10.2139/ ssrn.3387056.
Hussein, H.W. and A.A. Hafedh. “Reflection of Strategic Behaviors in Scenario Planning.” International Journal of Research in Social Sciences and Humanities, vol. 10, 2020, pp. 141-144.
Kim, H.R. “Managerial Cognition, Strategic Behavior and Innovation: Biopharmaceutical R and D.” Pharmaceutical and Pharmacological International Journal, vol. 2, no. 1, 2015.
Ingram, T. et al. “Relationships between Miles and Snow Strategic Types and Organizational Performance in Polish Production Companies.” Central European Management Journal, vol. 24, no. 1, 2016, pp. 17-45.
Svobodová, Z. and J. Rajchlová. “Strategic Behavior of E-Commerce Businesses in the Online Industry of Electronics from a Customer Perspective.” Administrative Sciences, vol. 10, no. 4, 2020.
Abuzaid, A. “Employees’ Empowerment and Its Role in Achieving Strategic Success: A Practical Study on Jordanian Insurance Companies.” Jordan Journal of Business Administration, vol. 14, no. 4, 2018.
Waldron, D.G. “Transnationality: An Index of Strategic Success?” Journal of International Business Strategy, vol. 8, no. 2, 2008.
David, F.R. Strategic Management: Concepts and Cases. Prentice Hall, 2011. https://doi.org/10.1007/s10842-019-00310-7.
Rainey, D.L. Enterprise-Wide Strategic Management: Achieving Sustainable Success through Leadership, Strategies and Value Creation. Cambridge University Press, 2010.
Chankoson, T. “Multilevel Causal Factors Affecting the Strategic Success of Thai Export Businesses.” Polish Journal of Management Studies, vol. 19, 2019.
Orlov, O. et al. “Company’s Strategic Success as the Basis of Its Potential Sustainability.” E3S Web of Conferences, vol. 166, 2020.
Mahmoud, A.S.A. The Role of the Dyson Model for Strategic Development in Achieving Strategic Success: Case Study in Baghdad Municipality. 2021.
