+91 6002993949
submission@iarconsortium.org
Open Access
ISSN (Print) : 2788-9491
ISSN (Online) : 2788-9505
The research aims to test the extent of application of the Performance Focused Activity Based Costing (PFABC) and the effect of this system in reducing costs and improving product quality in the State Company for Drugs Industry and Medical Appliances-Samarra (SDI). To achieve the research objective, the researchers conducted a field study in this company (SDI) to test the extent of application of the PFABC and its impact on improving product quality. The results of the field research concluded that applying the PFABC leads to identifying strengths and weaknesses in performance and identifying unused (idle) resources, thus reducing costs and improving product quality. The PFABC also calculates the productivity of each activity by measuring effectiveness and efficiency and determining the deviation for each activity. In this way, the PFABC provides an opportunity for management to evaluate activities and exclude activities that do not add value while working on developing activities that add value to the product. This step leads to improving products. The research recommended the need to pay attention to the application of modern methods of cost accounting and management accounting, including the PFABC, due to the inability of traditional cost accounting and management accounting methods to keep pace with the information requirements of the modern environment. The research also recommended the need to continuously pay attention to meeting the desires and needs of customers and the need to reduce the costs of activities that do not add value to the product or service, since the customer is not willing to bear these costs, in addition to the need to pay attention to internal and external information about the environment surrounding the (SDI) company when making strategic decisions related to it.
The rapid changes in the business environment and the rapid developments in production and manufacturing technology have been mainly reflected in traditional cost accounting, especially on the cost structure. The focus on indirect costs has become more than direct costs in many industries and the cost of direct wages resulting from the decrease in the volume of direct labor has declined and has turned into a relationship between the worker and the machine. This has necessitated the development and modernization of traditional costing systems to rely on the allocation and distribution of indirect costs on loading rates that depend primarily on volume such as working hours or the number of units, to confirm that they are adaptive, interactive and responsive to the variables of the manufacturing environment through the activity-based costing system with its three generations represented by the Activity-Based Costing (ABC), the Time-Driven Activity-Based Costing (TDABC) and the performance focused activity-based costing (PFABC). In order to confirm this, this research has addressed one of the modern cost systems in cost management, which is the Performance Focused Activity Based Costing (PFABC), to study the possibility of this system in the optimal exploitation of resources in a way that improves the quality of products.
Traditional cost accounting provides a comprehensive overview of total production line costs, yet it cannot identify the specific points and timings of deviations. In contrast, modern costing techniques, such as the PFABC method, offer comprehensive information and details about each activity along the production line, focusing on costs and quality. This detailed information is essential for regulatory authorities, as it enables them to exercise effective control and thus reflects on both performance measures and quality standards. Additionally, it facilitates the early identification of deviations, allowing for prompt corrective actions and strategies to prevent future deviations.
Objective of the Research
The research aims primarily to calculate the product cost for each activity according to PFABC methods to rationalize the use of resources in a way that improves the quality of the company's products and to identify unused resources by applying PFABC steps and to show how these steps enable management to take actions and decisions in order to exploit resources in the best way through the accuracy of the information provided by this system. In addition the research aims to clarify the concept of PFABC, the mechanism of its application and its advantages as one of the modern systems used in the accurate allocation of costs.
Importance of the Research
The importance of the research is represented by developing cost management tools to serve companies in exploiting their resources in a way that enables them to improve the quality of their products, using PFABC, which makes the company (SDI) keep pace with the development in the modern manufacturing environment.
Problem of the Research
Economic units in Iraq suffer from high prices of their products due to high production costs, which leads to higher prices of products compared to the prices of similar products available in the market from global sources, as the prices of these global products are lower than the prices of local Iraqi products, which leads to the inability of these local units to compete with global products. Accordingly, the research problem lies in reducing the costs of Iraqi products. Here the following question can be asked:
“Does the use of the PFABC lead to reducing costs and improving the quality of SDI products? ”
Hypothesis of the Research
The research hypothesis is that PFABC in SDI Company (research sample) leads to reducing costs and improving product quality.
Spatial and Temporal Boundaries of the Research
The spatial boundaries of the research are represented by the State Company for Drugs Industry and Medical Appliances in Samarra (SDI), affiliated with the Iraqi Ministry of Industry and Minerals. The temporal boundaries are represented by the year 2023 only.
Theoretical Framework of PFABC
The Origin and Concept of PFABC: After the implementation of the Activity-Based Costing (ABC), which is the first generation, which faced many criticisms, including the high cost of its implementation and its neglect of unused energy, another system appeared, which is the Time-Driven Activity-Based Costing (TDABC), which is the second generation, which also faced many criticisms, including its focus on an one cost driver for the activity and the difficulty of measuring time for each activity. As a result of these criticisms that faced these two systems, a new system emerged, which is the Performance Focused Activity Based Costing (PFABC), which is the third generation [1]. This system appeared in early 2009 by Mohammad Namazi, a professor at Shiraz University in Iran. This system is symbolized by PFABC, which is an abbreviation for performance focused activity based costing. It combines the advantages of the Activity-Based Costing (ABC) and the Time-Driven Activity-Based Costing (TDABC). This new system works to avoid the shortcomings of the two previous systems and expands their scope by determining the actual costs of each activity in detail and accurately, by relying on the appropriate resource and cost driver. It does not rely on the cost driver based on time only but rather relies on other cost drivers that may be weight or volume. This contributes to providing the information necessary for monitoring and performance evaluation [2].
The PFABC system is a link between Activity-Based Costing (ABC) and Activity-Based Management (ABM) systems. It facilitates the identification of indirect costs associated with products and services while allowing for independent performance measurement of different departments. Additionally, it helps in identifying deviations related to rates, efficiency and production volume. It is a costing method distinguished by its precision in calculating the costs of each produced unit, thereby delivering accurate information for control purposes, performance measurement and management. Moreover, it enhances decision-making processes and offers an accurate representation of all activities and operations within the economic unit. This system is linked to all the operations and operational activities of the economic unit and includes the cost based on performance-focused activities of ABC in its analysis of activities. Due to the various factors influencing costs, precise identification of product costs and unused energy within an integrated system is essential for accurate cost calculation. The PFABC system serves as a foundational element in delivering precise information regarding the costs of products or services, along with the necessary data for control and performance evaluation. The information generated by the PFABC system facilitates continuous improvement and development processes, serving as an effective instrument for strategic decision-making. Additionally, it enhances production efficiency by minimizing operational costs and optimizing resource utilization [3].
The Performance Focused Activity Based Costing (PFABC) is defined as an advanced system that offers integrated information essential for performance monitoring, resolving some of the criticisms of ABC and TDABC and further developing the traditional activity-based costing system. PFABC is concerned with measuring costs as well as evaluating performance to enhance competitiveness. Therefore, managers must continuously manage two separate accounting systems, one to determine product expenses and the other to monitor and evaluate performance. The maintenance of these two systems has compelled management to confront significant expenses and challenges. Consequently, a unified system known as "Performance-Focused Activity-Based Costing" (PFABC) has been proposed. This system is grounded in a 9-step process for analyzing each cost item, to streamline operations and enhance efficiency [4]. The philosophy of PFABC extends to include interest in determining the behavior of the actual resources according to the subject of the cost measurement in two basic types of resources, which are flexible and mandatory resources.
PFABC is also known as “the system that determines the actual costs of each activity separately and with high accuracy and is used as the appropriate cost driver and time is not required to be the cost driver, meaning that this system provides flexibility, because some activities have cost drivers (kg, megabytes, etc.).” PFABC is a tool for determining cost, planning and evaluating performance, because it helps the company that adopts and works with it to identify cost deviations such as price deviation, efficiency and production volume [5].
Advantages of PFABC
PFABC has several advantages that help avoid the criticisms directed at traditional standard costing systems, including [6-8]:
The PFABC combines the advantages of both ABC and TDABC and avoids the shortcomings of each, especially in the process of allocating indirect costs to products or services
In PFABC, all company activities are subject to the evaluation process and provide information at the level of resource pools, meaning that it contributes to the transition from a general to a detailed view of cost control and deviation analysis
According to PFABC, indirect industrial costs are allocated and distributed to a group of cost pools that are homogeneous within the pool, then these costs are distributed to products according to cost drivers that do not depend on size but rather differ according to the method of resource consumption
The PFABC serves the manufacturing environment characterized by global competition and reliance on automation in operating processes. Indirect costs represent a large percentage of the costs of products of companies that have advanced systems in producing the information required to implement and measure costs based on activity
Under PFABC, resource consumption is monitored and deviations are analyzed by identifying the cause of resource consumption and then linking the effect to the cause when analyzing deviations, with the aim of making them more clear in a way that enables the system to raise the operational efficiency of the resources consumed by various activities to be used in producing and adding value to customers
The PFABC is used to make long-term decisions and focuses on industrial process analysis and strategic analysis
Steps to Implement PFABC
The economic unit follows several steps in order to implement PFABC and these steps are as follows [5,9,10]:
Step 1: Determine the Main Activities
This step is important for two reasons, the first is that the nature and behavior of the costs of each activity differs from the nature and behavior of the costs of other activities. The second reason is that this step is one of the most important main components of (ABC), so it must be maintained in order to draw the path of activities. Through this step, the nature and behavior of the costs of each activity are determined.
Step 2: Determine the Actual Resources Utilized for Each Activity
The PFABC works to determine the actual resources required for each activity through the employees assigned to a specific activity who determine the type and quantity of resources required for each activity, based on the behavior of resources or through the accounting information system of the economic unit. The resource that is determined may be time, the quantity of direct raw materials or any other preferred measures, provided that this measure reflects the cause-and-effect relationship with the cost objective, in a way that contributes to providing high flexibility in choosing the appropriate resource from among other different effective resources. This step also includes "determining the behavior of the actual resources required for the cost objective." Actual resources are classified according to their behavior into two categories: flexible resources and mandatory resources. The behavior of flexible resources is similar to the behavior of variable costs and the behavior of mandatory resources is similar to the behavior of fixed costs [11].
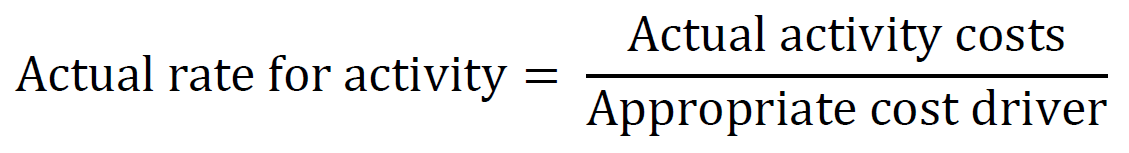
Step 3: Determine the Actual Loading Rate for Each Activity
In this step, the actual loading rate for each activity of the company is determined separately, depending on the information systems available in the company. Based on the actual data of the resources and their cost behavior, the actual loading rate for each activity is extracted by dividing the actual costs required by the appropriate cost driver.
Step 4: Measuring the Cost of Each Activity
The cost of each activity within PFABC is measured based on the behavior of the costs of the resources consumed in performing this activity. When measuring the activity costs of flexible variable resources (indirect costs AC), they are calculated by: (multiplying the number of flexible resource units consumed in completing the activity AR×the actual unit price of this resource AP). Then (the actual activity cost of flexible resources = the actual price of the consumed resources × the actual flexible resources consumed) is extracted.
To measure the cost of mandatory fixed resources, PFABC uses several methods to allocate mandatory costs such as "machine costs, information technology ... etc." using several methods such as "the allocation method based on flexible costs, the allocation method based on the cost driver, the weighted average method, the net realizable value and the multi-criteria decision model." The choice of any of these methods depends on the amount of information available, the degree of accuracy required in allocating costs, the preference of the responsible management for a particular method and the economic feasibility of applying each method.
Step 5: Calculating the Standard Rate of Activity Cost
In this step, the standard rate for each activity is estimated. This estimate can be achieved through various means and methods, including: Work measurement and evaluation techniques, market mechanisms, internal or external benchmarking and the application of statistical methods such as regression and time series analysis. This standard must be calculated with great precision and care, because it is used as a basis for comparison with actual rates and actual costs of operations. Although this step may be expensive, it adds appropriate accuracy to the model and provides it with a reliable basis for measuring various actual operations.
Step 6: Calculating the Deviation of the Activity Price
According to PFABC, cost managers should calculate the activity price deviation by calculating the actual resources required for each activity, by multiplying (the actual resource consumed by each activity) by (the standard price of the resources consumed) obtained in step five, then subtracting it from (the actual cost of each activity) to obtain the flexible resource price deviation. Fixed mandatory resources do not change, because their quantities and amounts are fixed. If the final result is positive (AC>FB), this means that there is an undesirable price deviation but if the final result is negative (AC<FB), this means that the price deviation is desirable and if the final result is zero (AC = FB), this means that there is no activity price deviation.
Step 7: Calculate the Costs of Executed Activities
It differentiates between flexible and fixed resources, because it takes into account the behavior of consumed resources and to calculate flexible resources. First, the standard quantity of resources consumed to accomplish a specific activity is determined, which will be compared with the actual quantity of resources consumed. The cost charged to flexible resources allocated to a specific activity is calculated by multiplying the standard cost required for the resource (SR) by the actual production quantity (AW) multiplied by the standard price of flexible resources (SP).
To calculate the fixed required resources, the planned Budget Level (BL) must first be determined. This level is fixed based on the practical production capacity, then the standard price for each consumed mandatory production capacity is extracted by dividing (the estimated costs of the planned activity) by (the budget level units actually consumed) and this is the cost of the mandatory resource. Then the cost of the applied mandatory resources is calculated using the following equation:
The cost of the executed mandatory or planned resource = (the standard resource required to produce one unit×the actual production quantity)×the standard rate of the mandatory resource [12].
Step 8: Measuring and Analyzing Deviation of the Quantity
This step is one of the basic steps in PFABC. Through this step, the performance of the production manager is measured to see if he has used more than the standard quantity allowed for the actual production of resources to produce a product or provide a service or is equal to or less than this quantity. If the production manager uses an actual quantity of consumed resources greater than the standard quantity allowed for the actual production of resources; this is evidence of an unfavorable deviation and the performance evaluation is negative. However, if the production manager uses an actual quantity of consumed resources less than the standard quantity allowed in the actual production process of resources; this indicates a favorable deviation and the performance evaluation is positive. If the two quantities (actual and standard) are equal; this indicates that there is no deviation and the performance evaluation is neither negative nor positive. The following equation is used to compare and determine deviations: (Actual quantity of consumed resources×Standard rate)-(Standard quantity allowed for actual production of resources×Standard rate).
Step 9: Calculate the Productivity of Each Activity
In this step, the sum of both efficiency and effectiveness appears, which represents profitability or productivity (Profitability = efficiency+effectiveness). The most important benefit of information for evaluating management processes is determining productivity.
The effectiveness of each activity can be determined by comparing the costs of the executed resources extracted from step five. Through this comparison, we face one of the following cases:
The first case: The costs of the executed resources are greater than the planned costs, which indicates the presence of a favorable deviation and positive effectiveness
The second case: The costs of the executed resources are less than the planned costs, which means the presence of an unfavorable deviation and negative effectiveness
The third case: The costs of the executed resources are equal to the planned costs, which indicates the absence of any deviation and the effectiveness is neither positive nor negative
Through this step, the productivity of each activity is calculated by summing the deviation of efficiency and the deviation of effectiveness, through the following equations:
The productivity of each activity = Efficiency deviation+Effectiveness deviation
Efficiency deviation = Price deviation+Quantity deviation
Effectiveness deviation = Executed activities costs-Planned activities costs
The Relationship Between PFABC and Products Quality
In the global competitive business environment, companies are working to face the challenges imposed based on competitive factors in the industrial and service sectors. These challenges are represented in the continuous improvement of quality and cost reduction. Therefore, companies have worked to improve their capabilities to retain their customers, obtain competitive advantages and gain customer satisfaction. The customer always wants to obtain better levels of services, especially in terms of quality and cost. In addition, he wants to acquire new and innovative products. Therefore, quality has become one of the most important competitive variables in the industrial and service sectors for all companies in a way that ensures their survival and growth in the business market [13].
Product quality is improved by producing products with engineering characteristics that are consistent with the customer's requirements and wishes. Based on these requirements, product production processes are planned in a way that leads to cost reduction, which leads to a reduction in the number of redesigns [14]. Quality costs are usually classified into prevention costs, evaluation costs, internal failure costs and external failure costs. Prevention costs encompass all expenses associated with measures taken to avoid failures and to maintain the quality of products and services. Evaluation costs refer to the expenses related to measurement and testing aimed at preventing failures. Failure costs, on the other hand, are those incurred to rectify issues in the quality of products and services. The former are the costs of conformity while the latter correspond to the costs of non-conformity. It is fairly common to divide failure costs into external and internal (by distinguishing between those costs that occur before the delivery of products/services and those that occur after delivery). It is interesting to point out through this division the particularly negative consequences of poor quality when it is discovered by the customers of the products/services. The costs of external failure are high and difficult to overcome, requiring costly and risky recovery procedures [15].
The effectiveness of PFABC consists of the relevance of cost driver, the accuracy of cost calculation, the reliability of cost information and the usefulness of cost reporting. The relevance of cost driver and the accuracy of cost calculation make employees able to understand different costs and accurate costs. Furthermore, the significance of cost driver and the dependability of cost information will be assessed through an analysis of costs, time of labor, time of production and usage of raw material. It may reduce the production of non-specification materials to distinguish between value-added and non-value-added activities. Focusing on these activities can enhance the efficiency of production processes than those that cannot be eliminated or reduced, leading to the overall efficiency of the production process. The relevance of cost driver, the reliability of cost information and the usefulness of cost reporting from the effectiveness of performance-based costing help management understand and analyze production processes and their impact on cost. Preferred cost drivers also reduce the time required to perform an activity, select low-cost activity and share activities with other products to achieve economies of scale. The use of cost reporting on each activity, materials in the product chain and activity analysis guides management to improve the process, which leads to improved efficiency of the production process [16].
The Practical Aspect
Description of the Research Sample-The State Company for Drugs Industry and Medical Appliances in Samarra (SDI): It is located at the company's headquarters in Samarra district. It includes five departments and these departments are considered essential in the company, in addition to two constructed buildings-one of which is nearing completion while the other remains operational-the company produces approximately 200 pharmaceutical preparations, including tablets, capsules, ointments, disinfectants and sterilizers, among others. SDI Company includes the following departments:
Ibn Sina Department: It produces antibiotic capsules of the penicillin type, powders and suspensions
Ibn Al-Nafis Department: It produces syrups and liquid suspensions, oral drops and the production of ionic water
Al-Zahrawi Department: It produces pills and tablets of various types and shapes
Ibn Hayyan Department: It produces antibiotic vials, eye drops, ampoules, capsules that do not contain antibiotics, oral rehydration salts, antacid powders, ointments and creams and suppositories
New Antibiotics Building: It produces capsules, suspensions and vials of the cephalosporin type
Application of PFABC in SDI Company
In this section, the PFABC will be applied, which includes nine steps. The financial data for the year 2023 has been selected, which pertains to the activity of producing one product of ointments, which is (Dermodin Cream) in the SDI company.
Step 1: Determine the Main Activities
In this step, the main and auxiliary activities for the production of ointment (Dermodin Cream) will be stated, as shown in the Table 1.
Step 2: Determine the Actual Resources Utilized for Each Activity
In this step, the amounts of actual resources used to complete each activity, whether main or auxiliary, are determined and the amounts paid for cost elements, which are materials, wages and indirect manufacturing costs, are determined.
Table 1: Dividing the Ointment Production Activities into Main and Auxiliary Activities
Main activities | ||
Activity | Activity Description | Resources used in the activity |
Preparation (mixing materials) | The materials needed to produce the ointment are mixed | Direct materials, workers |
Packaging | The ointment is filled in the form of a juice and the product is packaged in cardboard boxes to preserve it | Direct materials, workers, machines |
Auxiliary Activities | ||
Marketing Services | Marketing Products in Markets | Employees |
Administrative Services | Includes Services of Company Management and Accounts | Employees |
Source: The table was prepared by researchers based on field visits to the SDI company
Table 2: Actual Resources Used to Complete the Main and Auxiliary Activities
| Activities | Resources | Total | ||
Direct Materials | Wages and Salaries | Indirect Manufacturing Costs | ||
Main Activities | ||||
Preparation (mixing materials) | 1610800 | 174776 | 938816 | 2724392 |
Packaging | - | 190665 | 967600 | 1158265 |
Total | 1610800 | 365441 | 1906416 | 3882657 |
Auxiliary activities | ||||
Marketing Services | - | 612480 | 133544 | 746024 |
Administrative Services | - | 1329168 | 141440 | 1470608 |
Total | - | 1941648 | 274984 | 2216632 |
Source: The table was prepared by the researchers based on data from the Costs Division in the SDI company
Table 3: Calculating the Actual Rate for Main and Auxiliary Activities
| Activities | Cost elements | Cost driver | Equation for calculating the actual rate | Actual average |
Main Activities | ||||
Preparation (mixing materials) | Direct Materials | The amount of chemicals | 1610800/500g | 3222 |
Direct wages | Actual working hours | 174776/2112 | 83 | |
Indirect Manufacturing Costs | Actual working hours | 938816/2112 | 445 | |
Packaging | Direct wages | Actual working hours | 190665/3318 | 58 |
Indirect Manufacturing Costs | Actual working hours | 967600/3318 | 292 | |
Auxiliary Activities | ||||
Marketing Services | Direct wages | Actual working hours | 612480/ 2112 | 290 |
Indirect Manufacturing Costs | Sold units | 133544/8000 | 17 | |
Administrative Services | Direct wages | Actual working hours | 1329168/2112 | 629 |
Indirect Manufacturing Costs | Actual working hours | 141440/2112 | 66 | |
Source: The table was prepared by researchers based on data in Table 2
Table 2 shows that the actual resource for completing the main and auxiliary activities (direct materials and indirect manufacturing costs) was calculated by relying on the SDI company’s cost balance for 2023. Direct wages were calculated based on the SDI company’s wages lists.
Step 3: Determine the Actual Loading Rate for Each Activity
In this step, the actual rate is determined individually for each activity related to the resource and cost behavior by dividing the actual costs of the activities by the appropriate cost driver for each activity. Table 3 shows the actual rate for each activity by applying the following equation:
Step 4: Measuring the Cost of Each Activity
In this step, the actual cost of each activity, whether main or auxiliary, is determined by the following equation (Table 4):

Step 5: Calculating the Standard Average of Activity Cost
In this step, the standard average of the cost of the main and auxiliary activities will be calculated, as well as identifying the standard resources needed for each activity, as shown in Table 5 and 6.
Step 6: Calculating the Deviation of the Activity Price
The price deviation of each activity is determined by (Actual Resource*Standard Price) and then the result is subtracted from the actual cost of each activity. Then it is stated whether the activity price deviation is favorable or unfavorable, as shown in the Table 7.
Step 7: Calculate the Costs of Executed Activities
The costs of executed activities are calculated using the following equation (Table 8):
Costs of executed activities = (Standard resource* Executed actual work)×Standard average
Step 8: Calculating the Deviation of the Quantity
In order to measure the deviation of quantity for the main and auxiliary activities, the performance of the production departments is measured and the flexible budget and the executed budget are taken into account, from the following equation (Table 9):
Table 4: Determining the Cost of Each of the Main and Auxiliary Activities
Activities | Resources | Cost driver | Actual resources | Actual average | Actual cost |
Main Activities | |||||
Preparation (mixing materials) | Direct Materials | The amount of chemicals | 8800*0,15 g | 3222 | 4253040 |
Direct wages | Actual working hours | 8800*0,44 | 83 | 321376 | |
Indirect Manufacturing Costs | Actual working hours | 8800*0,44 | 445 | 1723040 | |
Packaging | Direct wages | Actual working hours | 8800*0,32 | 58 | 163328 |
Indirect Manufacturing Costs | Actual working hours | 8800*0,32 | 292 | 822272 | |
Auxiliary Activities | |||||
Marketing Services | Direct wages | Actual working hours | 8000*0,35 | 290 | 812000 |
Indirect Manufacturing Costs | Sold units | 8000 unit | 17 | 136000 | |
Administrative Services | Direct wages | Actual working hours | 2112 hour | 629 | 1328448 |
Indirect Manufacturing Costs | Actual working hours | 2112 hour | 66 | 139392 | |
Source: The table was prepared by researchers based on data in Table 3
Table 5: Standard Resources Needed to Complete the Main and Auxiliary Activities
| Activities | Resources | Total | ||
Direct Materials | Wages and Salaries | Indirect Manufacturing Costs | ||
Main Activities | ||||
Preparation (mixing materials) | 1744424 | 294776 | 1246780 | 3285980 |
Packaging | - | 268480 | 1285264 | 1553744 |
Total | 1744424 | 563256 | 2532044 | 4839724 |
Auxiliary activities | ||||
Marketing Services | - | 817744 | 163248 | 980992 |
Administrative Services | - | 1679843 | 174974 | 1854817 |
Total | - | 2497587 | 338222 | 2835809 |
Source: The table was prepared by the researchers based on data from the Costs Division and Planning Department in the SDI company
Table 6: Calculating the Standard Average of the Cost of the Main Auxiliary Activities
| Activities | Cost elements | Cost driver | Equation for calculating the standard average | Standard Average |
Main Activities | ||||
Preparation (mixing materials) | Direct Materials | The amount of chemicals | 1744424/650 | 2684 |
Direct wages | Standard working hours | 294776/3696 | 80 | |
Indirect Manufacturing Costs | Standard working hours | 1246780/3696 | 337 | |
Packaging | Direct wages | Standard working hours | 268480/4096 | 66 |
Indirect Manufacturing Costs | Standard working hours | 1285264/4096 | 314 | |
Auxiliary Activities | ||||
Marketing Services | Direct wages | Standard working hours | 817744/3696 | 221 |
Indirect Manufacturing Costs | Standard sold units | 163248/10000 | 16 | |
Administrative Services | Direct wages | Standard working hours | 1679843/3696 | 455 |
Indirect Manufacturing Costs | Standard working hours | 174974/3696 | 48 | |
Source: The table was prepared by researchers based on data in Table 5
Table 7: Calculation of Price Deviation for Main and Auxiliary Activities
| Activities | Cost elements | Price deviation = Actual Cost-(Actual Resource*Standard Price) | Deviation | The nature of the deviation |
Main Activities | ||||
Preparation (mixing materials) | Direct Materials | 4253040-(1320*2684) | 710160 | Non-favorite deviation |
Direct wages | 321376-(3872*80) | 11616 | Non-favorite deviation | |
Indirect Manufacturing Costs | 1723040-(3872*337) | 418176 | Non-favorite deviation | |
Packaging | Direct wages | 163328-(2816*66) | (22528) | Favorite deviation |
Indirect Manufacturing Costs | 822272-(2816*314) | (61952) | Favorite deviation | |
Auxiliary Activities | ||||
Marketing Services | Direct wages | 812000-(2800*221) | 193200 | Non-favorite deviation |
Indirect Manufacturing Costs | 136000-(8000*16) | 8000 | Non-favorite deviation | |
Administrative Services | Direct wages | 1328448-(2112*455) | 367488 | Non-favorite deviation |
Indirect Manufacturing Costs | 139392-(2112*48) | 38016 | Non-favorite deviation | |
Source: The table was prepared by researchers based on the data of Table 4 and 6
Deviation of quantity = (Actual quantity of the resource used* Standard Average)-(Standard quantity of actual production* Standard Average)
Step 9: Calculate the Productivity of Each Activity
This is the last step. The productivity of each activity is calculated, by adding the efficiency deviation with the effectiveness deviation through the following equations:
Productivity of each activity = Efficiency deviation + Effectiveness deviation
Efficiency deviation = Price deviation + Quantity deviation
Effectiveness deviation = Costs of executed activities - Costs of planned activities
It is clear from Table 10 that the productivity results for the main activities were negative for the packaging activity and also for all auxiliary activities, which indicates the factory's inefficiency in using its available resources and not exploiting these resources optimally. Therefore, the company management is required to address these deviations in the use of these resources correctly, so that the company can reduce the costs of the products and thus improve the quality of the products.
Table 8: Calculating the Costs of Executed Main and Auxiliary Activities
| Activities | Cost elements | (Standard resource*Executed actual work)× Standard average | Costs of executed activities |
Main Activities | |||
Preparation (mixing materials) | Direct Materials | (8800*0,14)×2684 | 3306688 |
Direct wages | (8800*0,38)×80 | 267520 | |
Indirect Manufacturing Costs | (8800*0,38)×337 | 1126928 | |
Packaging | Direct wages | (8800*0,30)×66 | 174240 |
Indirect Manufacturing Costs | (8800*0,30)×314 | 828960 | |
Auxiliary Activities | |||
Marketing Services | Direct wages | (8000*0,35)×221 | 618800 |
Indirect Manufacturing Costs | (8000*0,27)×16 | 34560 | |
Administrative Services | Direct wages | (2112*0,45)×455 | 432432 |
Indirect Manufacturing Costs | (2112*0,45)×48 | 45619 | |
Source: The table was prepared by researchers based on the data of Table 6
Table 9: Calculating the Deviation of Quantity for Main and Auxiliary Activities
| Activities | Cost elements | Calculating the deviation of quantity | Deviation | The nature of the deviation |
Main Activities | ||||
Preparation (mixing materials) | Direct Materials | (1320*2684) – (1232*2684) | 236192 | Non-favorite deviation |
Direct wages | (3872*80) – (3344*80) | 42240 | Non-favorite deviation | |
Indirect Manufacturing Costs | (3872*337) – (3344*337) | 177936 | Non-favorite deviation | |
Packaging | Direct wages | (2816*66) – (2640*66) | 11616 | Non-favorite deviation |
Indirect Manufacturing Costs | (2816*314) – (2640*314) | 55264 | Non-favorite deviation | |
Auxiliary Activities | ||||
Marketing Services | Direct wages | (2800*221) – (2800*221) | 0 | There is no deviation |
Indirect Manufacturing Costs | (8000*16) – (2160*16) | 93440 | Non-favorite deviation | |
Administrative Services | Direct wages | (2112*455) – (950*455) | 528710 | Non-favorite deviation |
Indirect Manufacturing Costs | (2112*48) – (950*48) | 55776 | Non-favorite deviation | |
Source: The table was prepared by researchers
Table 10: Calculating the Productivity of Main and Auxiliary Activities
| Activities | Cost elements | Productivity of each activity = Efficiency deviation+Effectiveness deviation | Deviation | The nature of the deviation |
Main Activities | ||||
Preparation (mixing materials) | Direct Materials | 946352 + (1413755) | (467403) | Non-favorite deviation |
Direct wages | 53856 + (27256) | 26600 | Favorite deviation | |
Indirect Manufacturing Costs | 596112 + (119852) | 476260 | Favorite deviation | |
Packaging | Direct wages | (10912) + (94240) | (105152) | Non-favorite deviation |
Indirect Manufacturing Costs | (6688) + (456304) | (462992) | Non-favorite deviation | |
Auxiliary Activities | ||||
Marketing Services | Direct wages | 193200 + (198944) | (5744) | Non-favorite deviation |
Indirect Manufacturing Costs | 101440 + (128688) | (27248) | Non-favorite deviation | |
Administrative Services | Direct wages | 896198 + (1247411) | (351213) | Non-favorite deviation |
Indirect Manufacturing Costs | 93792 + (129355) | (35563) | Non-favorite deviation | |
Source: The table was prepared by researchers based on the data of Table 8 and 9
Conclusions
SDI company still relies on traditional methods when measuring product costs, which makes it far from keeping pace with developments and changes in the business environment due to its failure to determine the cost correctly, especially the indirect industrial cost
There is a lack of knowledge among SDI company employees in PFABC, in addition to their following traditional methods that do not provide accurate and detailed information about product costs
The application of PFABC leads to the identification of strengths and weaknesses in performance and the identification of unused (idle) resources, thus reducing costs and improving product quality
The absence of protection of the national product and the flooding the market with large imported products, which affected the SDI company in selling its products. In addition to the increase in the cost of raw materials used in production, which are imported from outside the country, which led to an increase in the cost of the product price
Through PFABC, the productivity for each activity is assessed by measuring both effectiveness and efficiency, followed by calculating the deviation for each activity. In this way, PFABC provides an opportunity for management to evaluate activities and exclude activities that do not add value and work on developing activities that add value to the product. This step leads to improving products
From the practical side, it was noted that the productivity results of the main activities were negative for the packaging activity, as well as for all the auxiliary activities, which indicates the company’s inefficiency in using the resources available to it and not exploiting these resources optimally. Therefore, SDI company management must work to address these deviations in the use of these resources correctly, so that it can reduce product costs, thereby enhancing the overall quality of the products
Recommendations
The necessity of applying PFABC in SDI Company, because it leads to the best exploitation of available resources and preserving resources from waste and loss, in addition to its ability to provide information about all activities, as this information can be used in developing future plans, advancing the SDI company, developing its products, reducing costs and improving product quality
The necessity of providing distinctive offers so that the prices of products are competitive with the prices of similar products from other companies, with increasing production and searching for markets to sell these products
SDI Company management should provide training courses for its employees regarding the application of PFABC and explain its significant role in serving the company
SDI Company management should take the necessary corrective measures to address the causes of achieving unfavorable (negative) efficiency and support positive efficiency
SDI Company should periodically evaluate the performance of its activities, by relying on modern systems, especially PFABC, to evaluate the activities of the economic unit, by identifying strengths and working to support them and weaknesses and working to address them
Jaber, R.K. and S.M. Saad. “A Proposed Approach to Measuring Costs Using the Performance Focused Activity Based Costing (PFABC) Technique for the Purposes of Control and Performance Evaluation: An Applied Study in Rasheed Bank - Branch of 20th Revolution.” Journal of Financial and Accounting Sciences, special issue, 2022, pp. 1-28.
Al-Waili, A.A.A. and A.N.K. Al-Moussawi. “A Proposed Model for Using Performance Focused Activity Based Costing in Applying the Sustainable Balanced Scorecard.” Al-Kut Journal of Economics and Administrative Sciences, vol. 12, no. 38, 2020, pp. 451-481.
Aljuboori, I.S. and N.A. Agha. “The Efficiency of Using Attribute and Performance-Based Activity Methods to Raise the Level of Control Deviation: A Field Study in Jaber Bin Hayyan Factory.” Journal of Economics and Administrative Sciences, vol. 27, no. 130, 2021, pp. 256-271.
Sarokolaei, M.A. et al. “Fuzzy Performance Focused Activity Based Costing (PFABC).” Procedia - Social and Behavioral Sciences, vol. 75, 2013, pp. 346-352.
Kowsari, F. “Changing in Costing Models from Traditional to Performance Focused Activity Based Costing (PFABC).” European Online Journal of Natural and Social Sciences, special issue on Accounting and Management, vol. 2, no. 3, 2014, pp. 2497-2508.
Zhang, Y.I. et al. “Investigating the Empirical Effect of ABC Stages on the Performance of Companies.” Interdisciplinary Journal of Management Studies, vol. 10, no. 1, 2017, pp. 175-205.
Nouri, M.A. and A.M. Hassoun. “The Performance Focused Activity Based Costing (PFABC) and Its Role in Performance Evaluation: An Applied Study in the Leather Factory / Advanced Civilian Shoes Factory No. (7).” Al-Muthanna Journal of Administrative and Economic Sciences, vol. 10, no. 2, 2020, pp. 60-79.
Al-Hamrouni, M.M.A. “The Role of the Performance Focused Activity Based Costing (PFABC) System in Improving Competitive Performance in Industrial Establishments: A Field Study on the Petrochemical Industries in Libya.” Scientific Journal of Business and Environmental Studies, vol. 7, no. 1, 2016, pp. 358-429.
Namazi, M. “Performance-Focused ABC: A Third Generation of Activity-Based Costing System.” Cost Management, vol. 23, no. 5, 2009, pp. 34-46.
Hansen, D.R. and M.M. Mowen. Managerial Accounting. 8th ed., Thomson South-Western, 2007.
Jazzaa, S.F. and A.K. Al-Janabi. “The Role of the Performance Focused Activity Based Costing (PFABC) System in Achieving the Competitive Advantage of the Economic Unit: An Applied Study in the State Company for Electrical and Electronic Industries.” Tikrit Journal of Administrative and Economic Sciences, vol. 17, no. 56, 2021, pp. 77-98.
Saber, R.A. et al. “Performance Focused Activity Based Costing and Its Impact on Strategic Performance Evaluation: An Applied Study at Hawler Dairy Company in the Region of Kurdistan/Iraq.” Polytechnic Journal of Humanities and Social Sciences, vol. 4, no. 1, 2023, pp. 1056-1067.
Surur, M.J. Strategic Cost Management. 2nd ed., Dar Al-Jazeera for Printing, Publishing and Distribution, 2019.
Dhillon, B.S. Engineering and Technology Management Tools and Applications. Artech House, 2002.
Sá, Patrícia Moura. “Quality Cost.” Encyclopedia of Quality and the Service Economy, edited by Su Mi Dahlgaard Park, SAGE Publications, 2015.
Effiong, S.A. and A.E. Akpan. “Effect of Activity-Based Costing (ABC) on the Productivity of Manufacturing Company.” International Journal of Advanced Research, vol. 7, no. 1, 2019, pp. 753-765.
