
+91 6002993949
submission@iarconsortium.org
Open Access
ISSN (Print) : 2788-9378
ISSN (Online) : 2788-9386
Drinking water plays a great role in human Life. It must be within special specifications and standards. In addition, found many drinking water pollution problems in various areas of Al- Aziziyah City, Wasit governorate. The study objectives were to show the suitability of drinking water produced from basic filtration projects and compare it with the Iraqi and international standard for drinking water in order to investigate potential contamination. Therefore, physical, chemical and biological tests of drinking water were conducted at the drinking water treatment in the city of Al- Aziziyah City, Wasit Governorate from October 2020 to September 2021.for year. The samples were measuring the values and concentrations of water indicators. Water temperature was between 11-33°C and the turbidity values ranged 3-75 NTU, while the electrical conductivity values were between 939-1316 µS/cm. The values of the dissolved solids were 600.96-842.24 mg/L. The pH values recorded 7.1 - 8.1 with varying values of residual free chlorine 0.3- 3.5 mg/L. It was found that drinking water is hard. The total hardness values were 389–510 mg/L and as for the values of sulfate, they record 328 - 425 mg/L. For biological factors, the highest average of total bacterial numbers appeared in site R (raw water) during January 2021. It is reaching 450 cells/1 mL, while the lowest average in site E (water after treatment). It is also during March 2021 and it was zero cells/ 1 mL. The numbers of Escherichia coli bacteria, it was 0-340 cells/100 mL. About the drinking water produced from liquefaction projects, the results of the study showed that the values and concentrations of electrical conductivity, pH, dissolved solids and the standard specifications of Iraqi and international drinking water for all sites. The results showed that the concentrations of turbidity, free chlorine, total hardness, sulfates and total numbers of bacteria and E. coli bacteria in this study did not match the standard specifications of Iraqi [1] and international standards [2].
Water is one of the basic natural resources that everyone needs. In fact, water represents one of the strategic dimensions in creating life in all its forms and ensuring its continuity and permanence [3], from the World Health Organization (WHO) indicate that "any change in the natural, chemical and biological properties of water causes a change in its status, directly or indirectly ways. So, the water becomes less suitable for the natural uses designated for it, whether for drinking, domestic consumption, agricultural or other. Water is a carrier of disease including bacteria. The E. Coli is used as a bacterial evidence of fecal contamination in water and it is prominent in modern water contaminated with household waste [4]. In Iraq, the need for water resources is constantly increasing as a result of population growth and expansion.
Decreasing of rain, which led to water scarcity and the conditions that Iraq through led to a deterioration in its quality. It is a great source for the growth and reproduction of microorganisms [5]. Natural water is exposedto different degrees of pollutants. There are several sources of these pollutants, including agricultural, sewage and industrial waste water pollutants, which includes factories where it is released without treatment. Most studies conducted on the use of waste water for agricultural purposes indicate that there is a difference in the nature and contents of these materials [6]. There is an urgent need to identify waste water before use it. It could contain chemical pollutants that exceed the permissible limits, also, might contain pathogenic factors that causing environmental risks to plants and organisms [7].
In general, environmental pollutions have become a threat to the life of the human in particular and living organisms. Recently, this problem has emerged as a result of industrial progress and population increasing [8]. It has been achieved a great industrial development and established a huge number of industrial facilities and accomplished a great agricultural development accompanied by interference in agricultural yields by artificial methods that are not commensurate with the mechanism of natural environmental development that has been subjected to great cases of distortion due to the introduction of various chemical systems harmful to the environment [9]. Population growth needs necessitates striving towards securing increasing needs of water and food [10].
Water is an important our environment and it has a great role in all the vital processes that occur within organisms. Therefore, its pollution leads to severe damages with serious dangers to humans and a disruption of the ecosystems that will have no value if the properties of its main component are affected [11]. Laboratory test of water supplies began in the early years for the purpose of distinguishing and verifying the presence of some chemicals in 1858 in London. It is including regular chemical tests and analyzes of water supplies [12,13]. The drinking water in most societies are surface water such as streams, rivers and lakes and this water is always exposed to pollution as undesirable chemicals and microbes enter it, causing a change in the quality of water and affecting its environment. Therefore, the ecosystem may be exposed in the environment of this water is dangerous, as this same water is used for drinking and cleaning as well as in agriculture purpose. So, drinking water becom es in great danger unless it is treated carefully and equipment is controlled with care and precision [14,15].
A lot of scientific research have been conducted that dealt with the levels of water pollution in Iraq from various aspects, the extent of its impact on human health and how to treat it and reduce the risks [16-18]. The aims of the study are to indicate the importance of drinking water and the lack of research and studies related to the quality of local domestic drinking water, this study came to aim at the following:
Identify the pathogenic content (bacteria) in liquefied water, due to its wide spread and importance in causing diseases in Al-Aziziyah City, Wasit Governorate
Estimate the physical and chemical pollutants, identifying pollutants that affect water and reaching conclusions and proposals that lead to maintaining water quality
Study the qualitative and quantitative standards for drinking water pollution and compare them with international and local standards
Description of Study Areas
Al-Aziziyah is an Iraqi city located in Wasit Province, on the left bank of the Tigris River. Located approximately 80 kilometers northwest of Kut, it is witnessing a rapid population growth in this city. Therefore, improving the infrastructure, especially drinking water purification plants will improve the economic and social level of the population as well as support the health level for people. Al-Aziziyah station was studied, which is the largest and most important drinking water supply station in the city; as this station is providing drink water for 80% of the city's population.
The station is located on the Tigris River on GPS (32° 54′ 30″ N, 45° 4′ 0″ E) as shown in Map No. 1. The total area of the station is about 3200 m2 and the total design capacity is 2300 m3/h. Due to a few of studies and scientific research in this field and the fact that liquefied water (drinking water) is important in people and its pollution is a danger to human life, especially children. The spread of diseases and epidemics and inefficiency of stations in treating drinking water was studied. The study sites described as follows (Figure 1):
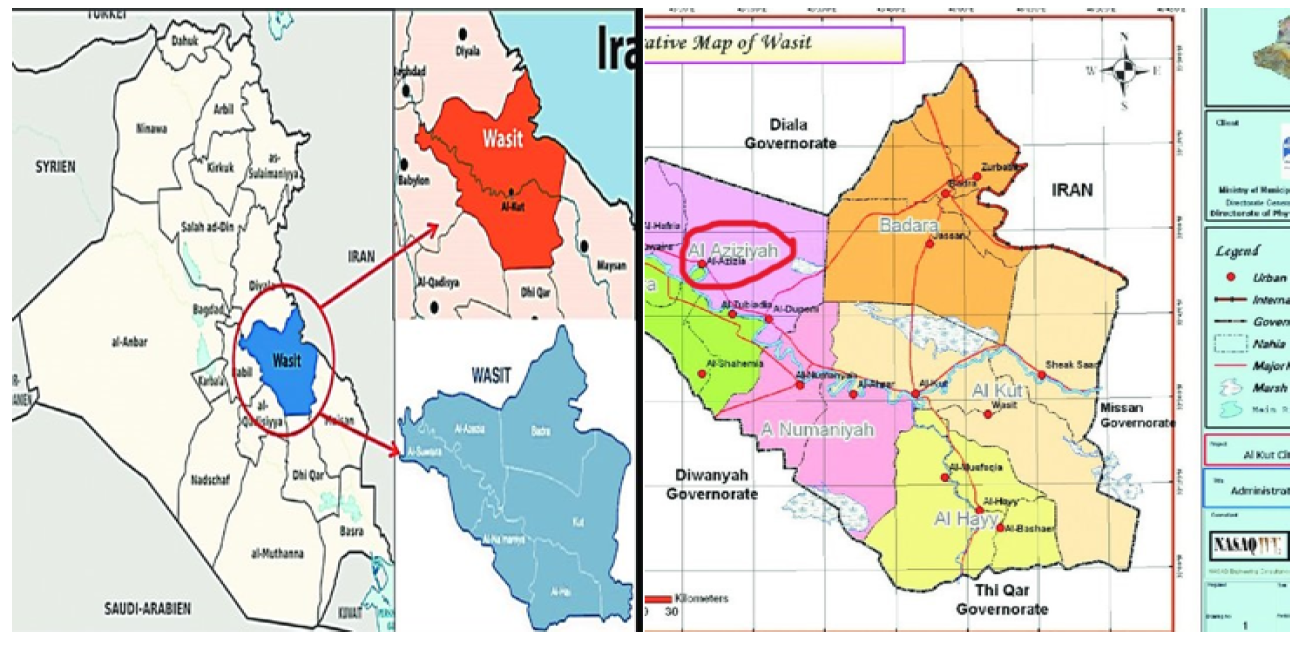
Figure 1: Location of Drinking Water Treatment Plants in Al- Aziziyah city
Raw water (the middle of the river) (R)
Water coming out of the filter complex (E)
Water for the first house in the network (N1)
Water for the last house in the network (N2)
Collect the Samples
Water samples were collected from October 2020 to September 2021 for year., with an average of two sets of samples per month. Through all stages of filtration up to the homes and each set of samples includes the following:
Raw water (the middle of the river) (R)
Sample coming out of the filter complex (E)
Sample for the first house in the network (N1)
Sample for the last house in the network (N2)
For collecting the samples, two sets of bottles were used. The first group was 250 mL and is intended for collecting water samples for microbial tests. It is bottles with tight stoppers containing 0.2 mL of sodium thiosulfate solution with concentration of 10% to neutralize the effect of residual chlorine. It was sterilized by sterilizer at 121°C for 30 mins. The second group were plastic bottles of 500 mL with a tight lid. They washed with soap and then diluted hydrochloric acid to remove sediment from the inner surface of the bottle. Then, they were homogenized with distilled water three times to remove the trace of acid. It is intended for collecting the samples for physical and chemical tests.
Physical and Chemical Tests
These tests were carried out according to the methods that smentioned below:
Temperature measured by mercury thermometer by immerses it directly in the specified location for taking the sample. It is fixed in Celsius
The pH was measured by pH meter (Hana) according to
EC measured using a Portable Conductivity Meter of the (Bischof L17),
The Dissolved Solids (TDS) can be calculated in terms of the electrical conductivity of water as in the following equation: TDS mg/l = E.C. μS/cm X 0.64
Turbidity measured by using a Turbidity Meter 355
Free Chlorine was measured by using the chromatographic method and using the DPD Free, Total & Combined Chlorine Test Kit Model SL-26
The sulfate SO4 was measured using the turbidity method by a spectrophotometer with a wavelength of 450 nm and it was expressed in (mg/L) according to.
Total Hardness was measured by slagging method using (EDTA) according to Lind, 1979
Bacteriological Measurements
The total number of bacteria in water was calculated using the plate counting method by planting 1mL of the stock or diluted sample (1:10, 1:100, 1:1000), on Nutrient agar medium using power plate method and incubated at 35°C for 48 h. Then, the number of colonies in 1 mL was calculated according to WHO
CFU/mL = No. of colony× volum of sample
Dilution
The total number of E. Coli bacteria was calculated using the Most Probable Number (MPN) method of. According to a special table, the most likely number of E. coli bacteria is estimated in 100 mL of the stock sample. The confirmatory examination was conducted by inoculating three groups of tubes that it contains Macunkey broth mono-concentrated by lube. It is making secondary cultures of tubes with positive reactions from the previous examination and incubated at 44 °C for 24 h. Then, the number of positive tubes was calculated according to a special table. The most likely number of fecal coliform bacteria is found in 100 mL in the samples.
Water Temperature
The growth of microorganisms is increasing with the increase in water temperature. Thus, temperature plays a great role in determining many physical, chemical and biological properties of water [19,20]. Figure 2 show that the temperature values during the study period. The water temperature of the river water ranged 15-33 °C and an average of 26 °C. For drinking water, the water temperature values were 11-32 °C, at a rate of 24 °C. It was noted that a few local changes in water temperatures in different locations and during the same month. This difference may be due to the time of collecting and test the samples in Wasit Governorate. This study agreed with [21], as well as the study of [22], that studied bacterial contamination of drinking water in Wasit Governorate.
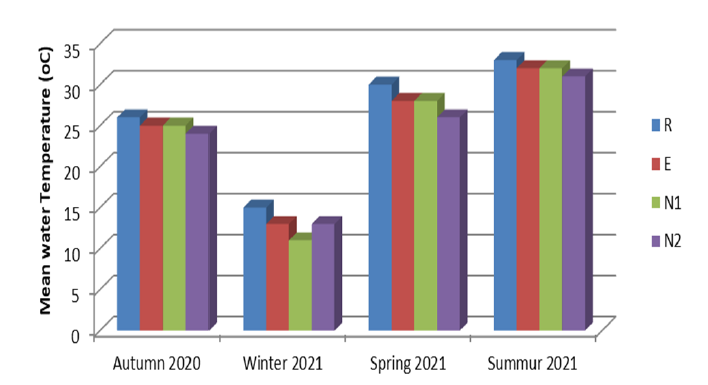
Figure 2: Mean Water Temperature Values of Raw and Drinking Water Samples in Al- Azizia Plant During Study
pH Value
International and Iraqi standards indicate that the pH value should be 6.5-8.5 for potable water [23-26]. In general, Iraqi waters tend to be slightly alkaline due to the presence of carbonates and bicarbonates. The pH values shown in Figure 3, ranged between 7.3-8.1 for river water. For drinking water, the pH values were 7.1- 7.9 and at a rate of 7.5, which are within the permissible limits. It is known that determining of the pH value of the water entering the filtration complexes is important because of its impact on the process of treatment, especially in the case of a high or low pH value.
However, the treatment process does not change the pH value except in the case of adding basic or acidic substances. Based on that, the research finds that the table of pH values is close, because no acidic or basic substances were added during the treatment process.
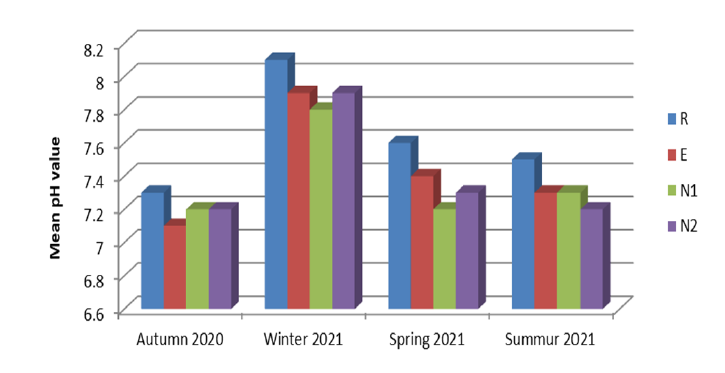
Figure 3: Mean PH Value of Raw and Drinking Water Samples in Al- Azizia Plant During Study Period
Free Residual Chloride
The free residual chlorine remaining in the water is a distinctive feature that may make choosing it in the filter stations to ensure safe water while passing through the distribution networks and until it reaches to the consumer. The filtration process does not work efficiently to remove bacteria and viruses due to the small size of these organisms, which needs to add chlorine to ensure their elimination [24-27]. The permissible limits of residual free chlorine concentrations should be 0.2-3.5 mg/L. If this percentage is lower, the possibilities of water contamination with microorganisms are increased, especially when there is leakage or cracks in the water networks. If the percentage of chlorine increases, this will constitute a danger due to the union of chlorine with organic compounds. It greats compounds that have a health effect [28]. Results of Figure 4 showed that the concentration of free residual chlorine ranged 0.2-3.5 with at a rate of 1.85 mg/L, which is outside the Iraqi and international standards. This warns of the possibility of biological contamination of water. For the sites that recorded a concentration of less than 0.3 mg/L, this is due to either adding low concentrations of chlorine or not adding it to the water. Therefore, the water leaving this station is subject to biological contamination.
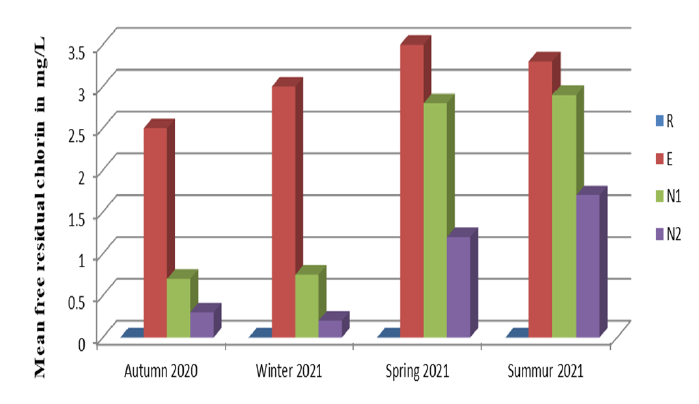
Figure 4: Mean Free Residual Chloride Values of Raw and Drinking Water Samples in Al- Azizia Plant During Plant Study Period
Electrical Conductivity (EC)
Electric conductivity is the ability of the water model to connect electricity. It is usually measured by room temperature 25 °C. The value is influence by the temperature and the type of ions and concentration of water. The Electric conductivity measurement is a sign of changes in the concentrations of the total solid materials and the concentrations of dissolved salts such as sulfate and chlorides salts. As well as, concentrations of calcium ions, magnesium and others. The electric conductivity is often linked with the total of solids in the water. The unit of Electric conductivity is µS/cm. Figure 5 shows that the electrical conductivity values during the study period, the electrical conductivity for the river water reached 947-1310 µS/cm with an average 1128.5 µS/cm. For the drinking water, the electric conductivity values was reached 939-1316 µS/cm with an average 1127.5 µS/cm. From the results, it can conclude that the water quality after treatment depends on the quality of raw water, especially with regard to pollutants. It cannot be removed in traditional treatment station, as this station does not contain the removal mechanism of salt. The comparing of the results with the Iraqi standard determinants 2009 of drinking water, which was determined by 2000 µS/cm and the WHO, which was set by 2500 µS/cm It notes that all the studied samples did not exceed the permissible limits.
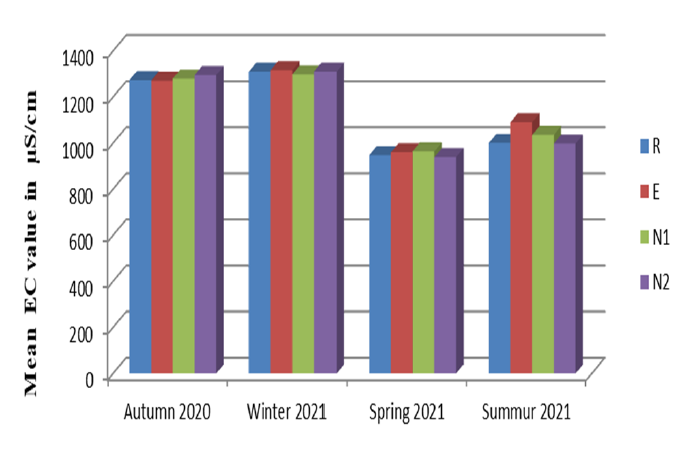
Figure 5: Electric Conductivity Values of Raw and Drinking Water Samples in Al- Azizia Plant During Study Period
Total Dissolved Solids (TDS)
Total Dissolved Solids (TDS) are defined as all dissolved solids in water, whether they are ionized or not and do not include suspended or colloidal substances [29,30]. The amount of TDS and concentration are important for the quality of the water and it depends on the validity of the water for domestic, industrial and agricultural purposes and these salts have an effect on the appearance of the unpalatable taste that appears after a concentration of 600 mg/L. The research finds that the TDS values of raw water ranged 606 - 838.4 mg/L with an average of 722.2 mg/L, while the results of drinking water values ranged 600.9-842.3 mg/L, with an average of 721.6 mg/L (Figure 6).
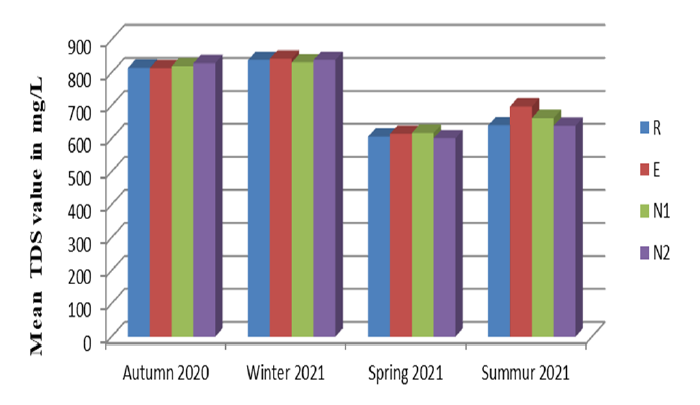
Figure 6: Total Dissolved Solids Value of Raw and Drinking Water Samples in Al- Azizia Plant During Study period
The months of high consequences in the solid materials that dissolve in their water are the most rainy when they are in particular in the populated cities and the industrial areas with which the pollutants in the atmosphere are carried out in the atmosphere and the solids and the solution of these raids to the exhaust [31,32].
Turbidity (NTU)
Turbidity is a measure of the degree of water transparency and it expresses the optical property of the scattering and absorption of light during its passage through the water sample by suspended particles [33]. It is also responsible for protecting organisms’ things from the effects of sunlight and toxic substances such as chlorine. Figure 7 show that the turbidity values during the study period. The turbidity of the river water was 30-75 NTU as a turbidity unit and average of 52.5 NTU. For drinking water, the turbidity values were 3-11 NTU and at a rate of 7 NTU. For the comparing the results with the Iraqi standard determinants, which were specified with 5 NTU and the determinants of the World Health Organization, which were specified by 0-50 NTU. The most of the studied samples exceeded these limitations.
The increase and decrease of turbidity in drinking water depends on the turbidity of the river water and the amount of alum added, the method of operation and the quality of maintenance operations. The status of stations has a significant impact on the turbidity rates in drinking water. The results of the current study agreed with [34] and the study [35], on the quality of work of sand filters.
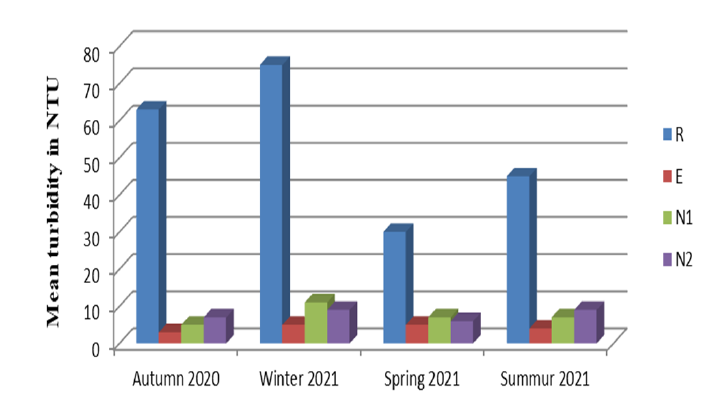
Figure 7: Turbidity Values of Raw and Drinking Water Samples in Al-Azizia Plant During Study Period
Total Hardness (TH)
Hardness is one of water quality and suitability indicator for human use. Hardness is not caused by the effect of a single substance, but by various polyvalent mineral ions. The positive calcium and magnesium ions are the dominant ions, as well as other positive ions such as barium, iron, manganese and zinc that participate in hardness of water [36].
The results record that the hardness values ranged 389-507 mg/L. It is known that Iraqi water is considered hard water because of the high concentration of calcium and magnesium in it. However, the results of raw water tests showed that water is very hard according to the classification of [24,25]. For the results of drinking water, the values ranged 393-510 mg/L, with an average of 451.5 mg/L. Results recorded increase in hardness values in the winter months. This is may be due to the erosion of pollutants into the river from the industrial wastes near the river and the agricultural flows from the nearby lands led to the high rates of hardness. To compare these results with the standard determinants, some samples appeared that exceeded the limits allowed by the Iraqi specifications, which was 500 mg/L and the World Health Organization (WHO), which was 500 mg/L (Figure 8).
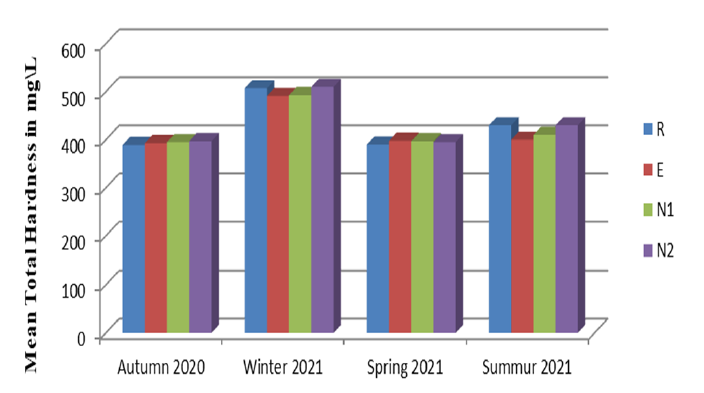
Figure 8: Total Hardness Values of Raw and Drinking Water Samples in Al-Azizia Plant During Study Period
Sulfate (SO4)
Figure 9 show the sulfate values during the study period. The sulfate values of river water ranged 328-417 mg/L and with a rate of 372.5 mg/L. For drinking water, the sulfate values ranged 331-425 mg/L with a rate of 378 mg/l, which did not match the Iraqi standard specifications, as it ranged 400 mg/L Specification No. 417 for drinking water for the year 2001 and the international standard specifications for drinking water.
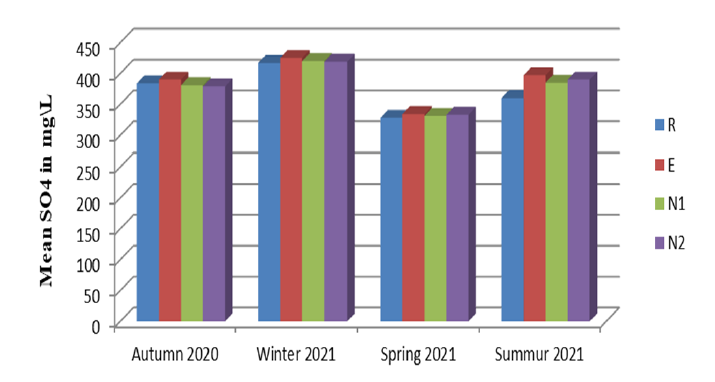
Figure 9: Sulphate Values of Raw and Drinking Water Samples n Al-Azizia Plant During Study Period
Through the results of the current research, it appears that the increase in the amount of sulfates in drinking water may be due to several reasons. This is including, the sulfates cannot be removed by traditional filtration processes in water distribution stations, or due to the inaccurate addition of percentages of alum and this was mentioned by [37]. There is a degree of contamination of drinking water with sewage water in some areas due to the aging and erosion of water distribution networks, or as a result of groundwater leaching processes [38]. The reasons for the increase in sulfate concentrations in water may be due to the gypsum nature of sedimentary soils, which is a direct source of sulfate dissolved in natural waters [39]. The nature of the agricultural area surrounding the river and its use of fertilizers, as these materials contain a good proportion of sulfates [40].
Total Bacterial Count (TBC)
The presence of bacteria in water is very normal, as it is part of the ecosystem. Their numbers and types increase when there is any source of organic pollution. It may help us in sterilization operations at filter stations. It is possible to measure and know the degree of feeding the river through the presence of these bacteria in the water. These bacteria increase in rivers containing high concentrations of nutrients [41].
Aerobic bacteria are one of the most common pollutants in water. Their numbers in raw water models ranged 130-450 cells/1 mL, while in drinking water was 0-17 cells/1 mL. The results indicate that they were the highest numbers during January 2017. The lowest was during November 2020. This is consistent with [24,25] who confirmed the higher rates of aerobic bacteria numbers during the winter season than during the summer season.
The total numbers of bacteria were not in conformity with the standard specifications of Iraqi drinking water Specification No. 417 for drinking water of 2001 amounting to 10 cells/1 mL and the global number was 5 cells/1 mL (Figure 10 and Table 1). The presence of some types of resistant aerobic bacteria may be due to the effectiveness of Chlorine [42].
Table 1: Physical, Chemical and Bacteriological Mean Values of Raw Water and Water Network in the Drinking Water Treatment Plant in Al- Aziziyah City for the Period from October 2020 to September 2021
| Season | Location | Temperature °C | pH | EC µS/cm | TDS mg/L | Free Cl mg/L | NTU | T.H mg/L | SO4 mg/L | TBC cell/1 mL | E. coli cell/100mL |
Autumn 2020
| R | 26 | 7.3 | 1273 | 814.72 | 0 | 63 | 389 | 384 | 130 | 210 |
E | 25 | 7.1 | 1271 | 813.44 | 2.5 | 3 | 393 | 390 | 7 | 0 | |
N1 | 25 | 7.2 | 1280 | 819.2 | 0.7 | 5 | 395 | 381 | 10 | 2 | |
N2 | 24 | 7.2 | 1295 | 828.8 | 0.3 | 7 | 397 | 379 | 11 | 4 | |
Winter 2021
| R | 15 | 8.5 | 1310 | 838.4 | 0 | 75 | 507 | 417 | 450 | 340 |
E | 13 | 7.9 | 1316 | 842.24 | 3 | 5 | 491 | 425 | 5 | 0 | |
N1 | 11 | 7.8 | 1298 | 830.72 | 0.75 | 11 | 493 | 420 | 8 | 4 | |
N2 | 13 | 7.9 | 1310 | 838.4 | 0.2 | 9 | 510 | 419 | 17 | 7 | |
Spring 2021
| R | 30 | 7.6 | 947 | 606.08 | 0 | 30 | 390 | 328 | 210 | 230 |
E | 28 | 7.4 | 960 | 614.4 | 3.5 | 5 | 398 | 334 | 0 | 0 | |
N1 | 28 | 7.2 | 964 | 616.96 | 2.8 | 7 | 397 | 331 | 5 | 4 | |
N2 | 26 | 7.3 | 939 | 600.96 | 1.2 | 6 | 395 | 333 | 9 | 6 | |
Summer 2021
| R | 33 | 7.5 | 1000 | 640 | 0 | 45 | 430 | 360 | 170 | 200 |
E | 32 | 7.3 | 1090 | 697.6 | 3.3 | 4 | 400 | 397 | 5 | 0 | |
N1 | 32 | 7.3 | 1035 | 662.4 | 2.9 | 7 | 410 | 385 | 11 | 3 | |
N2 | 31 | 7.2 | 998 | 638.72 | 1.7 | 9 | 430 | 390 | 15 | 5 |
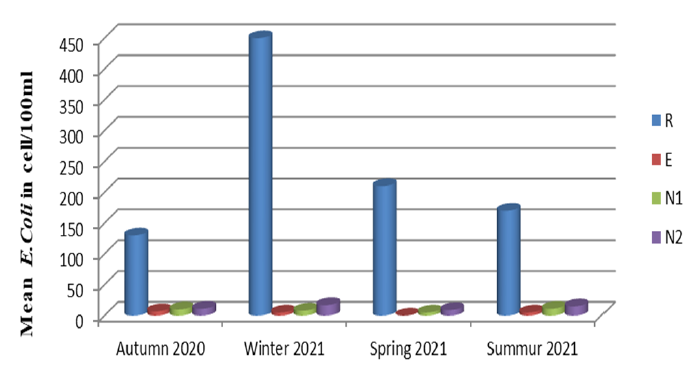
Figure 10: Total Bacterial Count Values of Raw and Drinking Water Samples in Al-Azizia Plant During Study Period
Escherichia Coli Bacteria
Escherichia coli are a clear microbial indicator to identify the quality and suitability of drinking water, it is important for public health and evidence of fresh water contamination with sewage water. This may be due to the ease of detection of these bacteria even at its lowest levels [43]. The concentrations of coliform bacteria in the raw river samples ranged 210- 340 cells/100 mL, while the drinking water was 0-5 cells /100 mL. The highest value was in January 2021 and the lowest was in November 2020 (Figure 11 and Table 2).
Table 2: The Maximum Limits of the Iraqi, American and World Health Organization (WHO) Standards for the Validity sof Drinking Water
| Tests | Iraqi standard, ICS 417/2001 | American standard USEPA, 1994, CDPHE – WQCD, 2000, 2006 | WHO standard,2015 |
| pH | 6.5-8.5 | 6.5-8.5 | 7-8.5 |
| E.C | - | - | 2000 |
| Free Cl- | 2 | 3 | 2 |
| Turbidity (NTU) | 5 | 4 | 5 |
| T.H (mg/l) | 500 | - | 500 |
| (SO = 4) | 200 | 250 | 400 |
| TDS (mg/l) | 1500 | 1000 | 1500 |
| T.P.C cell/1mL | 10 | 10 | 10 |
| E.Coli cell/100mL | 0 | 0 | 0 |
The reason for the increase in the numbers of fecal coliform bacteria and E. coli bacteria may be due to the lack of control over the quantities of alum and chlorine added to the water in the station. The addition of alum in an uncalculated manner depending on the estimate may also contribute to the lack of quality of that station in reducing the numbers these bacteria [44]. As comparing these results with the Iraqi standard determinants and the WHO [2], determinants of drinking water, which were Zero cells/100 mL, the results found that there are many samples that exceed these determinants.
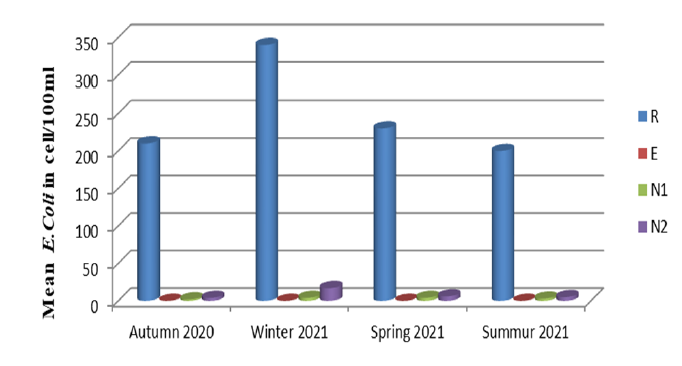
Figure 11: Escherichia coli Bacteria Values of Raw Drinking Water Samples in Al- Azizia Plant During Study Period
The turbidity was too high during the study period for all stations, which indicates the inefficiency of the stations in reducing turbidity, as well as not adding alum in a scientifically calculated
Most of the physical and chemical tests for drinking water were in accordance with the Iraqi and international standards
In drinking water, the total numbers of E Coli bacteria in most of the stations did not match the Iraqi and international standards
The results record that most of the samples taken from the areas whose water depends on liquefaction projects are polluted. The percentage of pollution was increases in the winter and autumn seasons and decreases in the spring
ICS. Iraqi criteria and standards of water’s chemical limits. ICS 13.060.20, no. 417/2001, first update 2011, www.sciepub.com/reference/226364.
World Health Organization. Guidelines for drinking-water quality. 4th ed., WHO, 2017, apps.who.int/iris/handle/10665/254637.
Anju, A. et al. “Water pollution with special reference to pesticide contamination in India.” Journal of Water Resource and Protection, 2010.
Al-Azawi, A.J. “Evaluation of microbial quality of the drinking water of Al-Bashaar Water Treatment Plant in Wasit Province, southern Iraq.” Engineering and Technology Journal, vol. 36, no. 2, part C, 2018.
Shandookh, F.K. “Ecological study of some physical and chemical parameters of Al-Gharraf River and one water treatment plant in Wasit Province, Iraq.” Journal of Wassit for Science & Medicine, vol. 11, no. 1, 2018.
Al-Tmemy, W.B. et al. “Microbial quality and some physicochemical properties evaluating of drinking water in Al-Haay City south of Iraq.”
Nasir, K.S. et al. “Study of physical and chemical characterization and pathogenic microbial pollution in Euphrates River in Al-Nasiriya City during 2018–2019.” IOP Conference Series: Materials Science and Engineering, 2020.
Al-Mayah, W.T. et al. “Microbiological quality assessment of drinking water at Al-Hayy City, southern Iraq.” Wasit Journal of Science and Medicine, vol. 10, no. 2, 2017, pp. 20–38.
Duruibe, J.O. et al. “Heavy metal pollution and human biotoxic effects.” International Journal of Physical Sciences, vol. 2, no. 5, 2007, pp. 112–118.
Namany, S. et al. “Sustainable energy, water and food nexus systems: A focused review of decision-making tools for efficient resource management and governance.” Journal of Cleaner Production, vol. 225, 2019, pp. 610–626.
Rockström, J. et al. “The unfolding water drama in the Anthropocene: Towards a resilience-based perspective on water for global sustainability.” Ecohydrology, vol. 7, no. 5, 2014, pp. 1249–1261.
Chorus, I. et al. Toxic cyanobacteria in water: a guide to their public health consequences, monitoring and management. Taylor and Francis, 2021.
Gal, J. “The discovery of biological enantioselectivity: Louis Pasteur and the fermentation of tartaric acid, 1857—a review and analysis 150 years later.” Chirality, vol. 20, no. 1, 2008, pp. 5–19.
Pedley, S. et al. Pathogenic mycobacteria in water: a guide to public health consequences, monitoring and management. World Health Organization, 2004.
Yadav, B. et al. “Introduction to wastewater microbiology: Special emphasis on hospital wastewater.” Current Developments in Biotechnology and Bioengineering, Elsevier, 2020, pp. 1–41.
Gleick, P.H. “Water and conflict: Fresh water resources and international security.” International Security, vol. 18, no. 1, 1993, pp. 79–112.
Maibach, E.W. et al. “Communication and marketing as climate change intervention assets: a public health perspective.” American Journal of Preventive Medicine, vol. 35, no. 5, 2008, pp. 488–500.
Tung, T.M. et al. “A survey on river water quality modelling using artificial intelligence models: 2000–2020.” Journal of Hydrology, vol. 585, 2020, article 124670.
Graf, R. et al. “Detecting patterns of changes in river water temperature in Poland.” Water, vol. 12, no. 5, 2020.
Lintern, A. et al. “Key factors influencing differences in stream water quality across space.” Wiley Interdisciplinary Reviews: Water, vol. 5, no. 1, 2018, article e1260.
Al-Mayah, W.T. et al. “Application of overall index of pollution (OIP) for the evaluating of the water quality in Al-Gharraf River southern of Iraq.” Iraqi Journal of Science, 2018, pp. 660–669.
Chabuk, A. et al. “Application ArcGIS on modified-WQI method to evaluate water quality of the Euphrates River, Iraq, using physicochemical parameters.” Proceedings of the Sixth International Congress on Information and Communication Technology, 2022.
Jabar, M.A. et al. “Chemical pollution risks for many drinking water sources in Baghdad City, Iraq.” Polish Journal of Environmental Studies, vol. 30, no. 2, 2021.
Al-Mayah, W.T. “Chemical and microbial health risk assessment of drinking water treatment plants in Kut City, Iraq.” Materials Today: Proceedings, vol. 42, 2021, pp. 3062–3067.
Al-Mayah, W.T. et al. “Water quality assessment in terms of water quality index (WQI): a case study of the Tigris River, Baghdad, Iraq.” IOP Conference Series: Earth and Environmental Science, 2021.
Moyel, M.S. et al. “Water quality assessment of the Shatt al-Arab River, southern Iraq.” Journal of Coastal Life Medicine, vol. 3, no. 6, 2015, pp. 459–465.
Toma, J.J. et al. “Application of water quality index for assessment water quality in some bottled water Erbil City, Kurdistan Region, Iraq.” Journal of Advanced Laboratory Research in Biology, vol. 4, no. 4, 2013, pp. 128–134.
Daniel, D. et al. “Combining sanitary inspection and water quality data in western Uganda: Lessons learned from a field trial of original and revised sanitary inspection forms.” Resources, vol. 9, no. 12, 2020, article 150.
Butler, B.A. et al. “Evaluating relationships between total dissolved solids (TDS) and total suspended solids (TSS) in a mining-influenced watershed.” Mine Water and the Environment, vol. 37, no. 1, 2018, pp. 18–30.
Walton, N. “Electrical conductivity and total dissolved solids what is their precise relationship?” Desalination, vol. 72, no. 3, 1989, pp. 275–292.
Colburn, A.S. et al. “High total dissolved solids water treatment by charged nanofiltration membranes relating to power plant applications.” Industrial & Engineering Chemistry Research, vol. 55, no. 14, 2016, pp. 4089–4097.
Zhang, C. et al. “Analysing the correlations of long-term seasonal water quality parameters, suspended solids and total dissolved solids in a shallow reservoir with meteorological factors.” Environmental Science and Pollution Research, vol. 24, no. 7, 2017, pp. 6746–6756.
Davies-Colley, R. et al. “Turbidity, suspended sediment and water clarity: a review.” JAWRA Journal of the American Water Resources Association, vol. 37, no. 5, 2001, pp. 1085–1101.
Lambrou, T.P. et al. “A nephelometric turbidity system for monitoring residential drinking water quality.” Proceedings of the International Conference on Sensor Applications, Experimentation and Logistics, 2009.
Kitchener, B.G. et al. “A review of the principles of turbidity measurement.” Progress in Physical Geography, vol. 41, no. 5, 2017, pp. 620–642.
Gyamfi, E. et al. “Chemical analysis of potable water samples from selected suburbs of Accra, Ghana.” Proceedings of the International Academy of Ecology and Environmental Sciences, vol. 2, no. 2, 2012, pp. 118.
Hussain, T.S. et al. “Remove chemical contaminants from potable water by household water treatment system.” Civil Engineering Journal, vol. 6, no. 8, 2020, pp. 1534–1546.
Majzlan, J. et al. “Speciation of iron and sulfate in acid waters: Aqueous clusters to mineral precipitates.” Environmental Science & Technology, vol. 39, no. 1, 2005, pp. 188–194.
Christophersen, N. et al. “Sulfate budget and a model for sulfate concentrations in stream water at Birkenes, a small forested catchment in southernmost Norway.” Water Resources Research, vol. 17, no. 2, 1981, pp. 377–389.
Al-Mayah, W.T. et al. “Evaluation of water quality using water quality index (WQI) method and GIS in Al-Gharraf River southern of Iraq.” 2009.
Krailas, S. et al. “Effect of inlet mass loading, water and total bacteria count on methanol elimination using upward flow and downward flow biofilters.” Journal of Chemical Technology & Biotechnology, vol. 75, no. 4, 2000, pp. 299–305.
Warqa’a, N.M. et al. “Pollutionary effect of the Medical City wastewater on the Tigris River bacterial indicators in Baghdad City.” Iraqi Journal of Science, vol. 55, no. 1, 2014, pp. 106–112.
Alwash, M.S. et al. “Antibiotic resistance patterns of diverse Escherichia coli phylogenetic groups isolated from the Al-Hillah River in Babylon Province, Iraq.” The Scientific World Journal, 2019.
Hussein, K.M. et al. “Assessing water quality for Al-Diwaniyah River, Iraq using GIS technique.” Engineering and Technology Journal, vol. 37, no. 7, 2019, pp. 256–264.
