+91 6002993949
submission@iarconsortium.org
Open Access
ISSN (Print) : 2708-6259
ISSN (Online) : 2708-6267
Mobiles have become an integral part of life as we depend on it right from communication to marketing. Most of the students are using mobile phones for their study purpose. The present study was conducted to know about the consumer satisfaction and brand preference of mobile phones. An exploratory research design was adapted with a sample size of 15 respondents from Home Science College by using simple random sampling technique. Structured interview schedule was developed to collect the data. Results revealed that most of the respondents were satisfied with their mobiles and brand name, durability; features and price of the mobile phone have the great influence on students brand preferences. Majority of the respondents associated the mobile phone price with quality of phone while culture had less impact on choice of mobile phones.
Modern technology plays a vital role in everyday life in the developed world. Mobile phone is the considered as status symbol. People want their mobiles to be loaded with top end features but in affordable costs. The purpose of this study is to understand the interplay among technology, a specific aspect of society and the family. This study tried to examine how home science college students prefer the mobiles and their satisfaction about phones and also to understand the use of technology in mobile phones and smart-phones to communicate with their families and for social updates. For the purpose of this study, smart-phone is defined as a mobile phone with an internet connection that allows for email, social networking, and other forms of communication anywhere the user goes.
Acer, Amazon, Apple, BlackBerry, Cleon, Huawei, Lava, Lenovo, Miramax, Microsoft, Nokia, Oppo, Samsung, Panasonic, Siemens, Sony, etc. are some branded smart phones available in the market and each holds different qualities and features. One may prefer Oppo and other may prefer iPhone or, Samsung. A good knowledge of students’brand preference in Smartphone would help in understanding how brand shapes students’ buying decision and preferences.
Objectives Of the Study
The objectives of the present study on consumer satisfaction and brand preference of mobile phones among M.Sc. students of Home Science College, were as follows:
To identify the brand preference of the mobiles by M.Sc. Students of Home Science College
To identify the influencing factors in buying a mobile
To determine the student satisfaction towards the brands of the mobile phones
Review of Literature
A study conducted by Neeta Rath revealed that people in Virar city preferred MI brand of mobile phone as it delivers the higher value of money than the competing brands. Most of the mobile users got information about brands from television, newspaper and internet. Most of them had used mobile for playing games, browsing and chatting.
Rajesh [1] had conducted a study on brand preference for mobile phones by students in Chennai. The study revealed that Vivo/Oppo was the most preferred brand by UG students in the study area. Mobile features were considered as important factors while choosing the mobile. Nushrat [2] studied the students’ brand preferences towards smartphone.
An exploratory research design was used. The total sample contains 15 students from Home Science College who were selected by using simple random sampling technique. Structured questionnaire was prepared to collect information about the demographic profile of the respondents, brands of mobile phones used by them, source of information about the brands, reasons for purchasing a particular brand, motivating factors in buying the mobiles, money spent on mobiles, purpose of using mobiles etc.
Results were presented under the following headings. The Table 1 shows that majorities (60%) of the respondents were under the age of 22 years and 40 per cent of the respondents were at the age of 23 years. All the respondents were pursuing their Master’s degree programme.
Table 1: Frequency Distribution of Age of The Respondents
Age | Frequency (N=15) | Percentage (%) |
22 years | 9 | 60.00 |
23 years | 6 | 40.00 |
Most of the respondents were unmarried (93%) and only one respondent was married (7%) (Table 2).
Table 2: Frequency Distribution of Marital Status of the Respondents
Marital status | Frequency (N=15) | Percentage (%) |
Unmarried | 14 | 93.00 |
Married | 1 | 7.00 |
Figure 1depicts that about 46.66 per cent of the respondents’ monthly family income was Rs. <30000 followed by 40 per cent of the respondents belonged to the families whose monthly income was Rs. >50000 and only 13.33 per cent of the respondents’ families were earning Rs. <50000 per month.
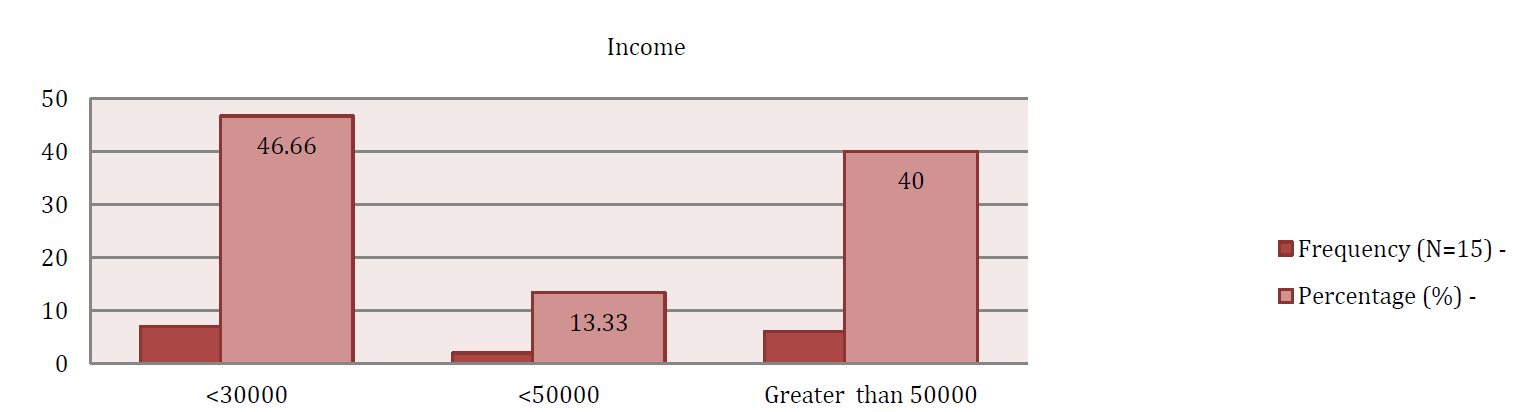
Figure 1: Distribution of Respondents by Monthly Income of the Family
Table 3 reveals that nearly one-fourth of the respondents’ families were indulged in agriculture, about one-fifth of them were government employees and 13.33 per cent were self-employed while a negligible percentage was involved in business. From the Figure 2 it was found that 46.66 per cent of the respondents were using Redmi, mi, Moto-G, Access, L.G, Huawei etc. A clear segment of 26.66 per cent were using vivo while, oppo was used by 13.33 per cent of the respondents. An equal percentage of the respondents were using either iPhone or Samsung (6.66%).
Nushrat [2] reported that, most of the people were using Samsung.
Table3: Distribution Of Respondents by Occupation of the Family
Occupation | Frequency | Percentage (%) |
Self employed | 2 | 13.33 |
Govt. employee | 3 | 20.00 |
Business | 1 | 6.66 |
Agriculture | 4 | 26.66 |
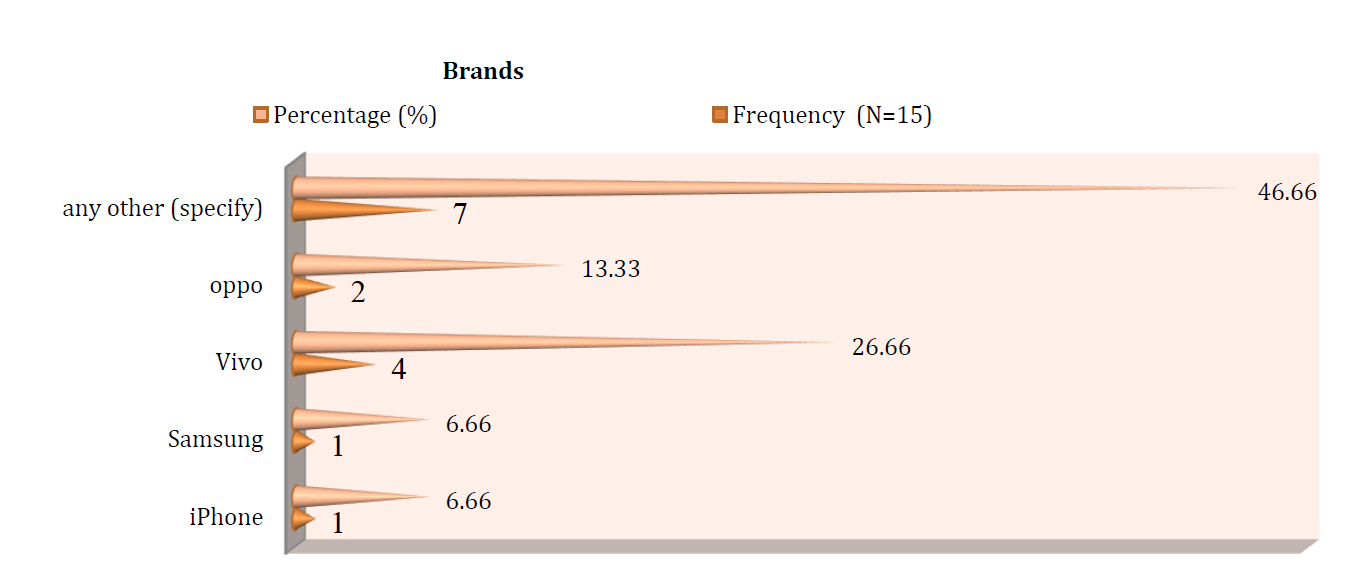
Figure 2: Distribution of respondents by Brands of mobile phone used
Table 4 depicts that 60 per cent of the respondents were influenced by features of mobile phones while purchasing followed by one-fifth of them considered price as an important factor, 13.33 per cent of them considered the availability of that particular brand in the store and 6.66 per cent of them were influenced by size of the phones.
Table4: Factors Influenced in Purchasing of Mobile Brand
| Frequency (N=15) | Percentage (%) |
Price | 3 | 20.00 |
Available in stores | 2 | 13.33 |
Different size | 1 | 6.66 |
Features | 9 | 60.00 |
The Figure 3 reveals that iPhone was their preferred brand (46.6%), vivo as favourite brand by 26.66%, and oppo by 20 per cent. Only 6.66 per cent specified their favorite brand as Mi.
Kumari and Rao [3] revealed that, most of the respondents preferred Sony Ericson.
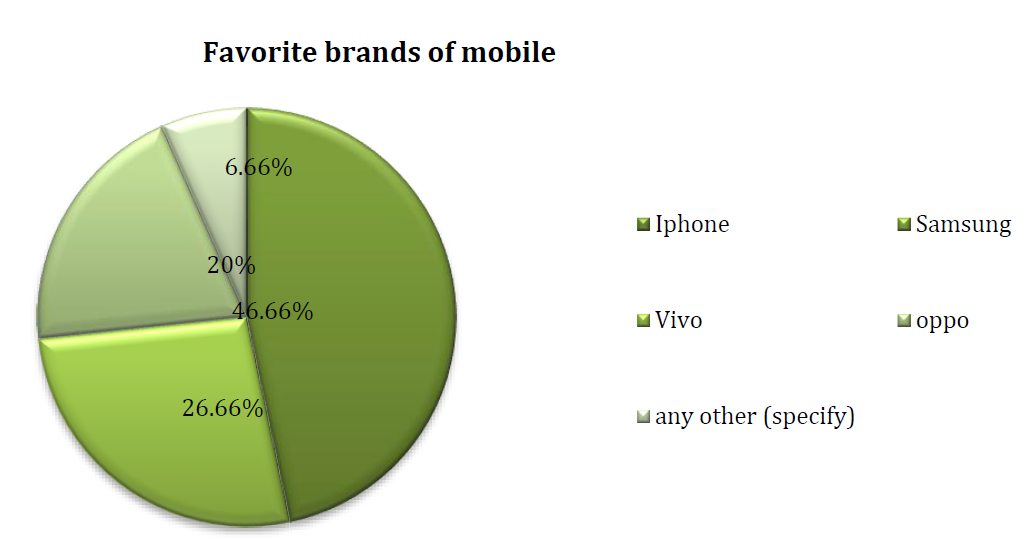
Figure 3: Frequency Distribution of Favorite Brands of Mobiles
Table 5 indicates that majority (53.33%) of the respondents preferred for mobile quality and negligible proportion (6.66%) of them preferred for mobile appearance. However brand image was considered for brand preference by 20 per cent while function of the mobile was the reason for preference by 13.33 per cent of the respondents. Jagadeesh (2013) reported that role of mobile phones configuration was important in retaining and increasing the company’s market.
Table5: Reasons For Brand Preference
| Frequency (N=15) | Percentage (%) |
Function | 2 | 13.33 |
Appearance | 1 | 6.66 |
Quality | 8 | 53.33 |
Brand image | 3 | 20.00 |
Majority (73.33%) of the respondents had spent Rs.10000-20000 for mobile phones and an equal percentage of the respondents (13.33%) had spent either Rs.<10000 or Rs.20000-30000/- (Table 6 ).
Table 6: Amount Spent on Mobile Phones
Amount in Rs. | Frequency | Percentage (%) |
<10000 | 2 | 13.33 |
10000-20000 | 11 | 73.33 |
20000-30000 | 2 | 13.33 |
Table 7 indicates that 80 per cent of the respondents agreed that prolonged use of mobile phones was causing health problems followed by 13.33 per cent mentioned that no harm was experienced due to the use of mobile phones and only 6.66 per cent said no comments about health problems due to mobile usage.
Table7: Prolonged Use of Mobile Phones Causing Health Problems
| Frequency | Percentage (%) |
Yes | 12 | 80.00 |
No | 2 | 13.33 |
No comment | 1 | 6.66 |
About 66.66 per cent of the respondents were satisfied with their present mobile. While 33.33 per cent of the respondents were not satisfied with their mobile because of poor battery performance, camera resolution, price etc (Table 8).
Table 8: Satisfaction With Their Mobile
| Frequency | Percentage (%) |
Yes | 10 | 66.66 |
No | 5 | 33.33 |
Respondents were questioned about the source of information that influenced the purchase of their present mobile. It was observed from the table 9 that 46.66 per cent of them got to know about mobile through T.V advertisements, 40 per cent were aware of the presently using mobile through the internet and only 6.66 per cent had got the information from magazines.
Table 9: Source Of Information About the Mobile
Source of information | Frequency | Percentage (%) |
Magazines | 1 | 6.66 |
News paper | - | - |
T.V | 7 | 46.66 |
Online | 6 | 40.00 |
The Figure 4 indicates that the main purpose of using mobile was for internet surfing (57.33%), for talking purpose (26.66%) followed by social media updates (13.33%) and for using it as a camera (6.66%).
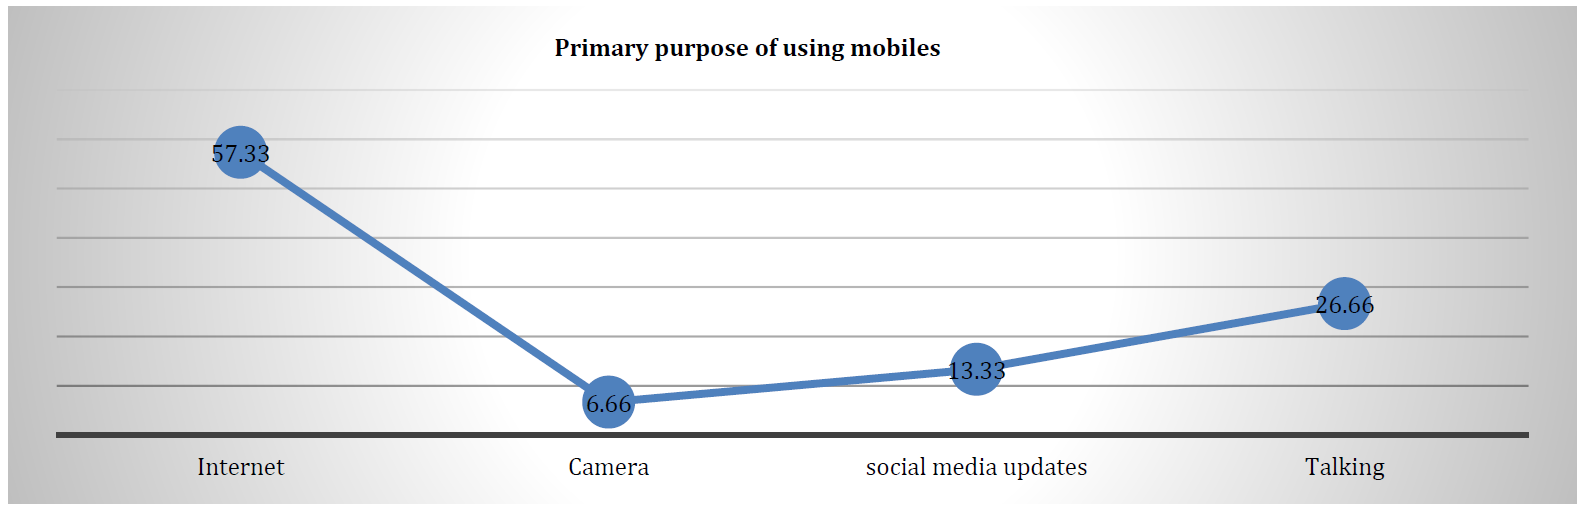
Figure 4: Frequency Distribution for Primary Purpose of Using Mobiles
The table 10 reveals that 80 per cent of the respondents have chosen their mobile by their own choice, 13.33 per cent purchased due to the influence of advertisements and negligible percentage had (6.66%) chosen by referrals.
Table10: Motivating Factors to Buy Mobiles
| Frequency | Percentage (%) |
advertisement | 2 | 13.33 |
own choice | 12 | 80.00 |
referrals | 1 | 6.66 |
Table 11 had thrown light on factors influencing the selection of mobile brands. It was found that results related to mean scores obtained by the respondent’s for brand popularity, price and social influence while selecting a mobile phone brands. Respondents were asked to give their response on a 5 point scale which comprised of 7 statements i.e. 1- Strongly disagree, 2- Disagree, 3- Neutral, 4- Agree and 5- Strongly agree. Maximum mean score (15.5) was obtained for the statement that association of mobile phone price with quality of phone and least mean score (7.25) was obtained for the statement that culture had an impact on the choice of mobile phone. Other important factors that had influenced the choice of mobile phone in descending order were associating the brand popularity with mobile phone quality (15.25), mobile is good value for the money paid (13.75), price is important while choosing a mobile (11.4) and social status influenced the brand of mobile preferred (11.25).
Table 11: Factors Influencing the Purchase of Mobiles
Statements | Strongly dis agree | Disagree | Neutral | Agree | Strongly agree | Mean scores | |
1. | Brand popularity: |
|
|
|
|
|
|
consider brand popularity when choosing a mobile phone | 2 | 2 | 9 | 28 | 10 | 10.2 | |
2. | associate brand popularity with mobile phone quality | - | 2 | 3 | 36 | 20 | 15.25 |
Price: |
|
|
|
|
|
| |
3. | price is important when choose a mobile phone | 1 | 2 | 9 | 20 | 25 | 11.4 |
4. | mobile is good value for the money paid | - | 4 | 9 | 32 | 10 | 13.75 |
5. | associate mobile phone price with quality of phone | - | 2 | 3 | 32 | 25 | 15.5 |
Social influence: |
|
|
|
|
|
| |
6. | social status influenced the brand of mobile preferred | 3 | 4 | 6 | 32 | - | 11.25 |
7. | culture had an impact on the choice of mobile phone | 3 | 4 | 6 | 16 | - | 7.25 |
Most of the respondents (students) were purchasing the mobile phones for internet usage. This study found that most of the respondents were satisfied with their mobiles. Mobile phone brand name, durability, features and price have the great influence on students’ brand preferences. Income level of the family also influenced their brand preference. Some of the respondents were not satisfied with their mobile because of poor battery performance, camera resolution, and price and only few of the respondents were satisfied with their mobile.
Majority of the respondents were motivated to buy mobile as they associated mobile phone price with quality of phone and culture also had less impact on choice of mobile phones. Very few respondents were considering brand popularity when choosing a mobile phone. Thus, it can be concluded that students have independent thinking in choosing their mobiles and gave importance to the quality rather than appearance and brand popularity.
iPhone was the most preferred brand though only negligible percentage owned. It implies that since students are dependent on parents, they are purchasing the mobiles within their budget but aspiring for high end mobiles like iphone. Home science students seem to be more rational consumers than impulse purchasers which is a good sign. It is recommended that similar study can be conducted on other stream of students to find the variation.
Rajesh, M. “Brand preference for mobile phones among the students in Chennai.” International Journal of Research and Review, vol. 6, no. 11, 2019, pp. 445–449.
Nushrat, A. “Students’ brand preferences towards Smartphone.” Journal of Business and Management, vol. 19, 2017.
Kumari, P. and K. Rao. “Consumer brand preference towards mobile phone.” Journal of Business and Management, 2016.
