
+91 6002993949
submission@iarconsortium.org
Open Access
ISSN (Print) : 2708-5155
ISSN (Online) : 2708-5163
The Sitalakhya river is the life line of the capital city of Bangladesh, being the source of surface water for the largest drinking water treatment plant in the country which supplies potable water to almost 4.5 million dwellers daily. The raw water quality is a concern for sustainable water supply. The present study was carried out to assess ten of the physicochemical water quality parameters of raw water of Sitalakhya river extracted from the intake of the largest drinking water treatment plant during 2013 to 2017 in the dry months of the year. Furthermore, statistical studies have been carried out by calculating correlation coefficients between different pairs of parameters to identify one single most important dominating water quality parameter, if possible, which can be surrogate for other parameters. The measured concentrations of the physicochemical quality parameters of water samples under study were compared with the national guideline values of Bangladesh. Almost all the physicochemical parameters under test are beyond the maximum permissible limit set by national guidelines for extraction which needs attention. Regression analysis of these data suggests that COD of this river water is an important parameter which holds an appreciable significant positive correlation with pH, colour, DO, turbidity, TSS, E. coli and conductivity, indicating that it can surrogate the other parameters under study thus can save time and money by not determining the surrogate parameters all the times. It may be suggested that this water quality can be managed effectively by controlling the COD of the water.
Water is the most abundant yet most unevenly distributed over the earth and indispensable for the sustenance of life and economic development. The environment, economic growth and developments are all highly influenced by water-its quality and availability over time and space.
The quality of surface water within a region is governed by natural processes such as precipitation rate, weathering processes and soil erosion and anthropogenic effects such as urban, industrial and agricultural activities and the human exploitation of water resources. However, the surface water resources are now being heavily polluted especially in the developing countries due to extensive urbanization, increased industrial activities, intensive farming and overuse of fertilizers in agricultural productions, discharge of untreated wastewater and sewage outlets into the river [1]. In order to control source pollution and improve water quality, it is important to know the spatiotemporal characteristics of contaminant concentrations in affected receiving waters [2-6].
The quality of water may be described according to their physicochemical and microbiological characteristics. For effective maintenance of water quality through appropriate control measures, continuous monitoring of a large number of quality parameters is essential. It is a cumbersome task to regularly monitor all the parameters even if adequate manpower and laboratory facilities are available. Therefore, in recent years an easier and simpler approach based on statistical correlation, has been developed using mathematical relationship for comparison of physicochemical parameters. Extensive research has been carried out on statistical analysis to assess the surface water quality in different country [7-14]. Correlation is the mutual relationship between the two variables. A direct correlation exists when an increase or decrease in the value of one parameter is associated with a corresponding increase or decrease in the value of other parameters [15].
The correlation coefficient measures the degree of association and the closeness of the relationship that exists between two variables, one taken as dependent variable. The greater the value of the regression coefficient, the better is the fit and more useful the regression variables [15].
There exist strong correlations among different water quality parameters and a combined effect of their inter-relatedness indicates the water quality. The developed regression equations for the parameters having significant correlation coefficients can be successfully used to estimate the concentration of other constituents. A systematic study of correlation and regression coefficients of the water quality parameters not only helps to assess the overall water quality but also to quantify relative concentration of various pollutants in water and provide a necessary cue for implementation of rapid water quality management programmes [15].
Bangladesh is historically a riverine country. The capital city Dhaka is surrounded by a peripheral river system comprising of rivers Buriganga, Dhaleswari, Shitalakhya, Balu, Turag and Tongi canal. The Sitalakhya river is the lifeline of Dhaka city. At least 4.5 million denizens are directly dependent on the drinking water produced and supplied through this river by treating in the largest treatment plant at Dhaka. Raw water quality of this river is very vital to the sustainable development of the city as well as the sustainable supply of drinking water to the citizens. But for the past three decades the quality of this river water especially in the dry months of the year (November-April) near the intake of the largest treatment plant of the country is being deteriorated to such an extent that it became a concern for the water utility operator [15]. Trustworthy information on the characteristics of water quality is direly needed so as to control pollution effectively and manage sustainable water resources. As a consequence, it is necessary to assess this river water regularly. Furthermore, the analysis of water quality on frequent basis, sometimes, in the acute dry season, is necessary on daily basis even sometimes round the clock to prevent likely water quality problem in the treated water from the drinking water treatment plant. Although several reports on the assessment of water quality based on physicochemical and bacteriological quality distributions in the Sitalakhya river have been published by several researchers but very few with correlation study particularly with the raw water from the intake of the largest treatment plant of the country [15]. The present baseline information of the physicochemical properties of the river water derived from this study would be a useful tool for further ecological assessment and monitoring of the river quality and to demonstrate to all stakeholders regarding our unabated atrocity in polluting this valuable water source.
The Importance of the selected of water quality variables for this study are briefly described as follow.
COD (Chemical Oxygen Demand)
The Chemical Oxygen Demand (COD) is a parameter that measures all organics: The biodegradable and the non-biodegradable substances [16]. COD is important as an indicator of how much oxygen will be required to treat the incoming raw water from the streams, which in turn drives the use of aeration equipment and ultimately electricity. Knowing what the COD levels are allows users to fine-tune their power usage and avoid excess energy bills. COD is commonly used as an estimator of Biological Oxygen Demand (BOD) because the test is much simpler and more robust. In well-understood applications, the ratio of BOD to COD is established and it’s relatively simple to extrapolate a BOD concentration from a COD test.
Turbidity
Materials that contribute to turbidity are silt, clay, organic material, or micro-organisms. These colloidal and finely dispersed turbidity-causing materials do not settle under quiescent conditions and are difficult to remove by sedimentation. Turbidity is a key parameter in water supply engineering, because turbidity will both cause water to be aesthetically unpleasant and cause problems in water treatment processes, such as filtration and disinfection. Turbidity is also often used as indicative evidence of the possibility of bacteria being present.
Total Suspended Solids (TSS)
SS are typically comprised of fine particulate matter with a diameter of less than 62 mm though for the majority of cohesive solids, research has demonstrated that transport frequently occurs in the form of larger aggregated flocs. All streams carry some SS under natural conditions. However, if concentrations are enhanced through, for example, anthropogenic perturbations, this can lead to alterations to the physical, chemical and biological properties of the water body. Physical alterations caused by SS include reduced penetration of light, temperature changes and infilling of channels and reservoirs when solids are deposited. These physical alterations are associated with undesirable aesthetic effects, higher costs of water treatment. Chemical alterations caused by SS include the release of contaminants, such as heavy metals and pesticides and nutrients such as phosphorus, into the water body from adsorption sites on the sediment. Furthermore, where the SS have a high organic content, their in-situ decomposition can deplete levels of dissolved oxygen in the water, producing a critical oxygen shortage which can lead to fish kills during low-flow conditions.
Colour
The colour of water is attributed to the presence of organic and inorganic materials. Waters which obtain their colour from natural organic matter usually pose no health hazard. However, because of the yellowish-brown appearance of such waters, the consumers may not find the water aesthetically acceptable. Where water is abstracted for human consumption and chlorinated, the chlorine can react with the organic materials to produce undesirable Trihalomethanes (THMs) in the drinking water.
Chlorophyll
Chlorophyll provides an indirect measure of algal biomass and an indication of the trophic status of a water body. It is important for the management of water abstracted for drinking water supply, since excessive algal growth makes water unpalatable or more difficult to treat.
The growth of planktonic algae in a water body is related to the presence of nutrients (principally nitrates and phosphates), temperature and light. Therefore, concentrations of chlorophyll fluctuate seasonally and even daily, or with water depth, depending on environmental conditions.
pH
pH is key water quality parameters in environmental engineering practice. In the water supply and treatment fields, this parameter has great influence on the chemical coagulation, disinfection and softening processes and corrosion control for water distribution pipe networks. A high pH makes the taste bitter and decreases the effectiveness of the chlorine disinfection, thereby causing the need for additional chlorine [17]. Effective chemical coagulation of water, for instance, occurs only within a specific pH range. High pH values tend to facilitate the solubilization of ammonia, heavy metals and salts. The precipitation of carbonate salts is encouraged when pH levels are high. Low pH levels tend to increase carbon dioxide and carbonic acid concentrations.
DO (Dissolve oxygen)
Dissolved Oxygen (DO) is considered to be one of the most important parameters of water quality in streams, rivers and lakes. It is a key test of water pollution. The higher the concentration of dissolved oxygen, the better the water quality. Oxygen is slightly soluble in water and very sensitive to temperature. The actual amount of dissolved oxygen varies depending on pressure, temperature and salinity of the water. Dissolved oxygen has no direct effect on public health but drinking water with very little or no oxygen tastes unpalatable to some people.
E. coli (Escherichia coli)
The most common risk to human health associated with water stems from the presence of disease-causing micro-organisms. Therefore, contamination of water bodies by animal or human excrement introduces the risk of infection to those who use the water for drinking, food preparation, personal hygiene and even recreation.
Sewage, agricultural and urban run-off and domestic wastewaters are widely discharged to water bodies, particularly rivers. Pathogens associated with these discharges subsequently become distributed through the water body presenting a risk to downstream water users. Methods for detection of the presence of faecal material have been developed which are based on the presence of “indicator” organisms, such as the normal intestinal bacterium Escherichia coli. Escherichia coli (E. coli) is the major species in the fecal coliform group. Of the five general groups of bacteria that comprise the total coliforms, only E. coli is generally not found growing and reproducing in the environment. Consequently, E. coli is considered to be the species of coliform bacteria that is the best indicator of fecal pollution and the possible presence of pathogens.
Conductivity
Conductivity is sensitive to variations in dissolved solids, mostly mineral salts. Conductivity is related to the concentrations of total dissolved solids and major ions. The conductivity of most freshwaters ranges from 10-1,000 µS cm⁻1 but may exceed 1,000 µS cm⁻1, especially in polluted waters, or those receiving large quantities of land run-off. It is a rough indicator of mineral content when other methods cannot easily be used, conductivity can be measured to establish a pollution zone, e.g., around an effluent discharge, or the extent of influence of run-off waters.
Temperature
Temperature is an important water quality and environmental parameter because it manages the kinds and types of aquatic life, controls the maximum dissolved oxygen concentration of the water and effects the rate of chemical and biological reactions [18].
The temperature of surface waters is influenced by latitude, altitude, season, time of day, air circulation, cloud cover and the flow and depth of the water body. In turn, temperature affects physical, chemical and biological processes in water bodies and therefore, the concentration of many variables. Localized elevated temperatures can occur where there are discharges such as industrial cooling waters, sewage treatment plant discharges.
Objective of the Study
With this background, this study was initiated, whose primary objective was to analyze quantitatively the existing concentration levels as well as their trend over a period of sixty months continuously (2013-2017) of ten of the water pollution indicators namely COD, Colour, DO, pH, turbidity, temperature, conductivity, E. coli, chlorophyll and TSS for a specific surface water source, river Sitalakhya which is the source of the largest surface water treatment plant in Dhaka, Bangladesh by comparing with the water quality guidelines in use. In addition, establish regression equations among them and also calculate correlation coefficients between different pairs of parameters in order to identify, if possible, one single most important dominating water quality parameter, which can be surrogated for other parameters under study.
Thus knowing, if possible, a single dominating parameter one can estimate other parameters complimentarily among themselves, which might save time, money of testing large numbers of parameter frequently and can give instantaneous water quality information as required.
Study Area
The study area is Dhaka the capital city of Bangladesh with a population of more than fifteen million located in the central part of Bangladesh. The city has a distinct monsoonal season, with an annual average temperature of 26°C and monthly means varying between 19°C in January and 29°C in May, sometimes reaching to 40°C. Approximately 87% of the annual average rainfall of 2,123 millimeters occurs between May and October. Dhaka is located at 23°42′N 90°22′E, on the banks of the Buriganga river and surrounded by other peripheral rivers. The largest treatment plant of the country is situated beside the river Sitalakhya in the eastern periphery of Dhaka city at Latitude N 23°43' 11.25" and Longitude E 90°26' 14.25" [15]. The raw water from the intake of this plant was collected and used for this study (Figure 1).
Figure 1: Raw Water Source and its Transmission Network From Sitalakhya River to WTP
Sample Collection and Analysis
Though the climate of Bangladesh is mainly sub-tropical monsoon, i.e., warm and humid; Bangla calendar year is traditionally divided into six seasons: Grisma (summer), Barsa (rainy), Sarat (autumn), Hemanta (late autumn), Shhit (winter) and Basanta (spring). Each season comprises two months but some seasons flow into other seasons, while others are short. Actually, Bangladesh has three distinct seasons: the pre-monsoon hot season from March through May, rainy monsoon season which lasts from June through October and a cool dry winter season from November through February. The water quality parameters were grouped in two distinct periods (rainy and winter season). From the operational experience of the Dhaka treatment plant, it is revealed that river water quality can be grouped broadly for two distinct period of the year in terms of quality and quantity of water available at the river intake, namely dry season (November-April) and wet season (May-October).
During dry period (November-April) water quality is very poor and in wet period (May-October) it is comparatively better accompanied by very low flow and large flow at the river respectively. It is evident also from the time vs stage graph of the river near the intake point (Figure 2).
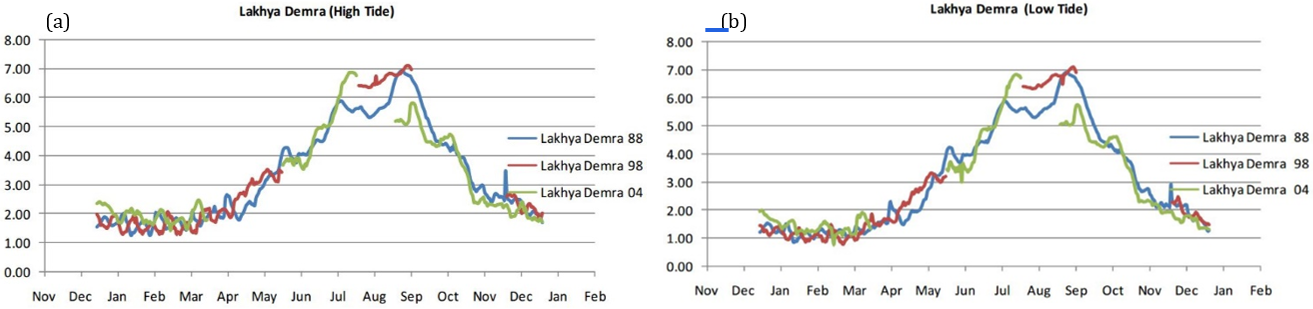
Figure 2(a-b): Water Level Data (mPWD) at Demra Water Level Recorder under (a) High Tide Condition and (b) Low Tide Condition
Water samples were collected from the first 20-30 cm of the water column along the plant intake during both dry and wet seasons covering all the months round the year using a pre-sterilized two-liter plastic bottle, repeatedly washed with water from that site and tested for some physical, chemical and bacteriological water quality parameters which are required for this study. Water samples were collected during the years 2013-2017 (November 2012-April 2017).
The collected samples were transferred to the laboratory of the plant, by following the precautions laid by standard methods [19]. pH, DO, temperature, turbidity, chlorophyll, conductivity was determined within the field of collection and cross checked later on, the other parameters like COD, Colour, TSS, E. coli etc., were analyzed in the laboratory within the stipulated period following the standard method. For correlation analysis the monthly average data is used. Total five years’ seasonal data is used for statistical analysis.
Statistical Analysis
Statistical analysis was conducted by using analytical Statistical tools available built in the Excel program. The physico-chemical parameters for all the study were analyzed by calculating Pearson’s correlation coefficient (r) value in order to assess the relationship between water quality variables. The degree of association that exists between two variables is measured by the correlation coefficient (r) where one taken as dependent variable and is the mutual relationship between two variables. When increase or decrease in the value of one parameter is associated with a corresponding increase or decrease in the value of other parameter than direct correlation exists between these two variables [20,21]. In terms of the strength of relationship, the value of the correlation coefficient varies between+1 and -1. When the value of the correlation coefficient lies around ±1, then it is said to be a perfect degree of association between the two variables. As the correlation coefficient value goes towards 0, the relationship between the two variables will be weaker. The direction of the relationship is simply the+(indicating a positive relationship between the variables) or -(indicating a negative relationship between the variables) sign of the correlation. After that correlation for significance was tested by applying p-value [11,22]. The variations are significant if p<0.05, p<0.01 and non-significant if p>0.05. The significance is considered at the level of 0.01 and 0.05 (2-tailed analysis). Correlation is a bivariate analysis that measures the strengths of association between two variables and the direction of the relationship [23,24].
The concentration of ten important physicochemical and bacteriological water quality parameters is determined taking the raw water samples of the Sitalakya river extracted at the intake of the largest water treatment plant of Bangladesh in Dhaka. The study covers a period of five years from 2013 to 2017 specifically for the dry period of the year, from November to April and the monthly average, maximum and minimum values of concentration of all the ten parameters in each year are analyzed. This study gives a comprehensive picture of the overall raw water quality as well as of a number of important individual quality parameters for a treatment plant over a long period of time covering all the critical months of the year in the context of water treatment. All the test result values are utilized in this analysis, some of the very important results are shown in figures, some in description and others are in tabular form for the ease of understanding and page limitation respectively. This vast information extracted almost daily basis covering a number of important water quality variables necessary for a drinking water treatment plant and beyond covering a period of continuous sixty months in a plant environment was never found to be done in recent time in Dhaka. The outcome gives a firm base to answer the research question and quest. The global number of the sample tested in this study period is around 1400 comprising almost equally in each year covering all seasons in detail for ten parameters. The protocol of the tests performed is given in Table 1. This paper deals with only the dry periods (November-April) of the year.
Table 1: Analytical Raw Water Sampling Programme
| Serial No. | Parameter tested | Frequency during November-April | Frequency during May-October | Drinking water guideline values |
| ECR (1997) | ||||
1 | COD | Daily | Daily | 4 mg/L |
2 | Turbidity | Daily | Daily | 10 NTU |
3 | TSS | 3 times a week | Daily | 10 mg/L |
4 | Colour | 3 times a week | 2 times a week | 15 pt-co. |
5 | Chlorophyll | Depending on situation | 2 times a week | μg/L |
6 | PH | Daily | Daily | 6.5-8.5 |
7 | DO | Daily | Daily | 6 mg/L |
8 | E.Coli | Daily | Daily | 0 number/100ml |
9 | Conductivity | 3 times a week | 2 times a week | 2500 µS/cm |
10 | Temperature | Daily | Daily | 20-300C |
The results of the water quality analysis for the monthly average concentration values for all the parameters used as test data during study period are presented in Table 2 and the Maximum, minimum and average values during this specific study period is given in Table 3.
Table 2: Monthly Average Concentration in the Dry Months (November-April) of the Year
| Seasonal Variation | Dry Season (All Average) | ||||||||||
| Years | Months | COD (mg/L) | Turbidity (NTU) | TSS (mg/L) | Colour (PtCo) | Chlorophyll (µg/L) | pH | DO (mg/L) | E. coli (CFU/100 mL) | Conductivity (μS/cm) | Temperature (°C) |
| 2013 | Nov (2012) | 10 | 5.33 | 2.6 | 46 | 20.52 | 7.14 | 2.75 | 1731 | 265 | 27.4 |
| 2013 | Dec (2012) | 19.2 | 7.78 | 0 | 38.83 | 23.65 | 7.34 | 2.65 | 29893 | 392 | 23 |
| 2013 | Jan | 22.7 | 12.1 | 11.8 | 34 | 14.42 | 7.5 | 1.4 | 62250 | 577 | 22 |
| 2013 | Feb | 46.2 | 43.7 | 24 | 35 | 39.46 | 7.6 | 1 | 85925 | 737 | 22.5 |
| 2013 | Mar | 59 | 54.6 | 23.7 | 58 | 75.71 | 7.6 | 0.4 | 122200 | 983 | 27.4 |
| 2013 | Apr | 53 | 64.8 | 23.8 | 63 | 80.04 | 7.6 | 0.9 | 75000 | 1040 | 30 |
| 2014 | Nov (2013) | 10.63 | 8.4 | 7.4 | 11 | 22.41 | 7.2 | 2.1 | 2825 | 301 | 27.2 |
| 2014 | Dec (2013) | 14.5 | 10.8 | 9.3 | 18 | 27.77 | 7.4 | 1.4 | 44800 | 471 | 24.2 |
| 2014 | Jan | 25 | 30.5 | 18.2 | 28 | 18.5 | 7.4 | 1 | 76250 | 635 | 22.1 |
| 2014 | Feb | 46.2 | 58.1 | 27.4 | 43.3 | 32.7 | 7.6 | 0.8 | 95925 | 880 | 23.7 |
| 2014 | Mar | 56.2 | 85.8 | 32.1 | 61.5 | 38.1 | 7.6 | 0.5 | 142200 | 1048 | 27.8 |
| 2014 | Apr | 53.5 | 75.4 | 31.9 | 80 | 81.5 | 7.6 | 0.7 | 151250 | 1175 | 31.5 |
| 2015 | Nov (2014) | 11.92 | 6.2 | 6.8 | 13 | 26.77 | 7.3 | 1.6 | 3550 | 321 | 28.2 |
| 2015 | Dec (2014) | 20 | 15.7 | 9.9 | 17.4 | 25 | 7.3 | 0.8 | 171250 | 476 | 23.3 |
| 2015 | Jan | 26.7 | 28 | 15.4 | 21.7 | 33 | 7.4 | 1 | 162500 | 595 | 21.8 |
| 2015 | Feb | 45.8 | 76.1 | 22.5 | 37.3 | 48.5 | 7.5 | 0.5 | 255750 | 831 | 23.9 |
| 2015 | Mar | 56.9 | 73.2 | 19.2 | 83.9 | 35.9 | 7.6 | 0.3 | 235000 | 1088 | 28 |
| 2015 | Apr | 45.6 | 59.9 | 19.8 | 41 | 50.4 | 7.6 | 0.8 | 51250 | 905 | 29.7 |
| 2016 | Nov (2015) | 18 | 12.9 | 12 | 14 | 34.2 | 7.3 | 1.3 | 9833 | 381 | 28 |
| 2016 | Dec (2015) | 24.3 | 23.6 | 24.1 | 19 | 29.3 | 7.4 | 0.7 | 46650 | 494 | 24.2 |
| 2016 | Jan | 33 | 36.4 | 17.4 | 26 | 27.6 | 7.43 | 0.5 | 42500 | 606 | 22 |
| 2016 | Feb | 52 | 61.5 | 23.3 | 58 | 29.4 | 7.5 | 0.2 | 148000 | 812 | 24.8 |
| 2016 | Mar | 64.5 | 43.1 | 24.8 | 109 | 28.6 | 7.4 | 0.2 | 146667 | 1023 | 28.2 |
| 2016 | Apr | 50.6 | 54.9 | 23.2 | 51 | 67 | 7.4 | 0.4 | 137250 | 905 | 30.2 |
| 2017 | Nov (2016) | 14.7 | 5.2 | 5.2 | 17 | 21.4 | 7.23 | 1.1 | 10750 | 409 | 27.5 |
| 2017 | Dec (2016) | 22.8 | 14.2 | 8.3 | 24 | 19.4 | 7.37 | 0.8 | 118250 | 540 | 24.8 |
| 2017 | Jan | 36.8 | 29.5 | 14 | 30.8 | 28.5 | 7.4 | 0.8 | 134000 | 722 | 22.7 |
| 2017 | Feb | 76.3 | 47.4 | 18.4 | 100.1 | 16.6 | 7.4 | 0.4 | 302500 | 1033 | 24.9 |
| 2017 | Mar | 68.6 | 56.4 | 20.5 | 112.5 | 13.8 | 7.6 | 0.4 | 170000 | 1246 | 27.1 |
| 2017 | Apr | 32.2 | 17.3 | 10.3 | 36 | 37.7 | 7.4 | 1.2 | 73400 | 667 | 29.8 |
Table 3: Descriptive Statistics of Water Quality Parameters of Sitalakya River in the Study Period
Water quality parameters (unit) | Minimum | Maximum | Mean | Std. Deviation |
COD (mg/L) | 6.0 | 127.0 | 37.23 | 8.98 |
Turbidity (NTU) | 1.1 | 158.0 | 37.29 | 14.4 |
TSS (mg/L) | 1.8 | 45.0 | 16.91 | 4.09 |
Color (PtCo) | 0 | 211.0 | 44.28 | 14.7 |
Chlorophyll (µg/L) | 4.8 | 180.5 | 34.92 | 19.06 |
pH | 6.86 | 7.9 | 7.44 | 0.09 |
DO (mg/L) | 0 | 4.8 | 0.95 | 0.39 |
E.Coli (CFU/100mL) | 1000 | 350,000 | 103,645 | 77405.72 |
Conductivity (µS/cm) | 169 | 1407 | 719 | 283.35 |
Temperature (°C) | 18 | 34 | 26 | 1.57 |
The maximum COD concentration was found to be 127 mg/L in the month of February 2017 and the minimum is 6 mg/L found in the month of November 2013, the minimum monthly average was found to be 10.0 mg/L in the month of November 2012, maximum monthly average was found 76.3 mg/L in the month of February 2017 and the average of monthly average values was found to be 37.23 mg/L.
There is no maximum guideline value for COD of the river water to be extracted for drinking purpose in Bangladesh; however, there are guideline values for BOD. From a recent study [15] we can calculate the corresponding value of COD from the correlation study, and the guidance value for COD stands to 14 mg/L for the surface water under study. All the monthly average values of COD except November of 2012-14 are found above the allowable 14 mg/L limit of COD for surface water as per any guideline lest the drinking water guidelines value.
The maximum monthly average value of COD (76.3 mg/L) occurred in the month of February 2017. It is notable that in every year January to April is the most critical months in terms of COD concentration in the river water. It can be seen that every year (except 2017) March is the most critical months in terms of highest average COD concentration which varies in between 56-69 mg/L. The minimum monthly average value of COD occurred in the month of November 2012. The curves in the Figure 3(a) show a general trend of increase in the average monthly values with ascending years.
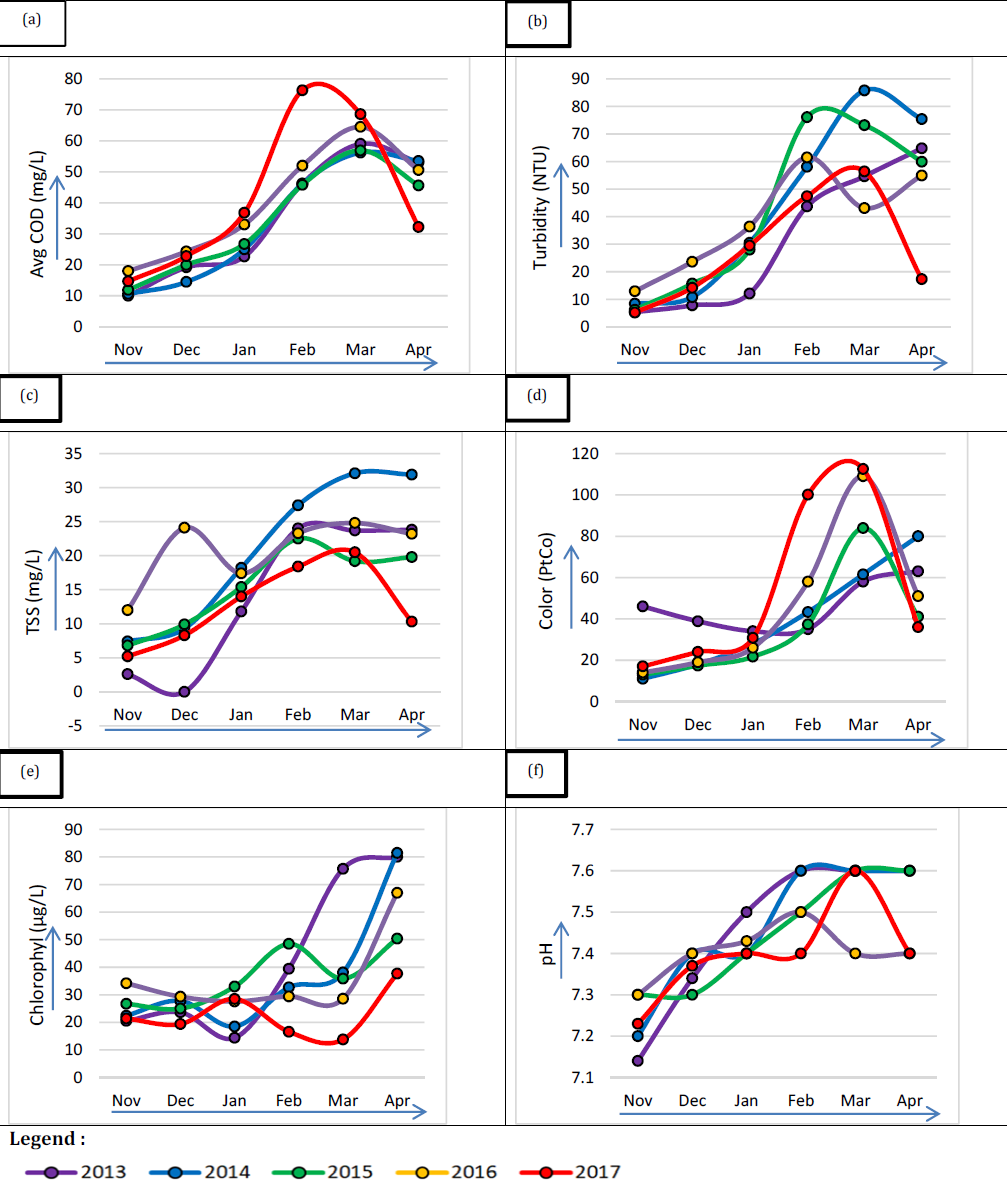
Figure 3: Yearly Trend of Average Monthly Concentration of Different Water Quality Parameters During Dry Months
The yearly average values for the dry months calculated from the monthly average values of COD shows an increasing trend of concentration. In 2013 yearly average COD concentration is found 35.00 mg/L and it reaches to 40 and 42 mg/L in 2016 and 2017 (Figure 3a). The average of all average concentration of COD is 37.23 mg/L which is almost 3 times more than the targeted value of 14 mg/L for the surface water. The minimum monthly average concentration of COD is 10.00 mg/L in November2012 and the maximum monthly average was 76.3 in February 2017. The COD value was never equal or lower than the drinking water guideline value.
Similarly, Figure 4(a) refers to the yearly monthly average values of DO. It has a general trend of gradual declining advancing with years symmetrical to COD curves. In November, 2012, Avg. DO concentration was 2.75 mg/L which reaches to 1.1 mg/L in November 2016. It can be seen that every year March is the most critical months in terms of lowest DO concentration which varies in between 0.2 to 0.5 mg/L. The average of all average concentration of DO is 0.95 mg/L which is almost 6.5 times lagging than the targeted value of 6 mg/L for the surface water as well as drinking water. The minimum concentration of DO is 0.00 mg/L in January 2013 and the maximum concentration was 4.8 mg/L in December, 2012.
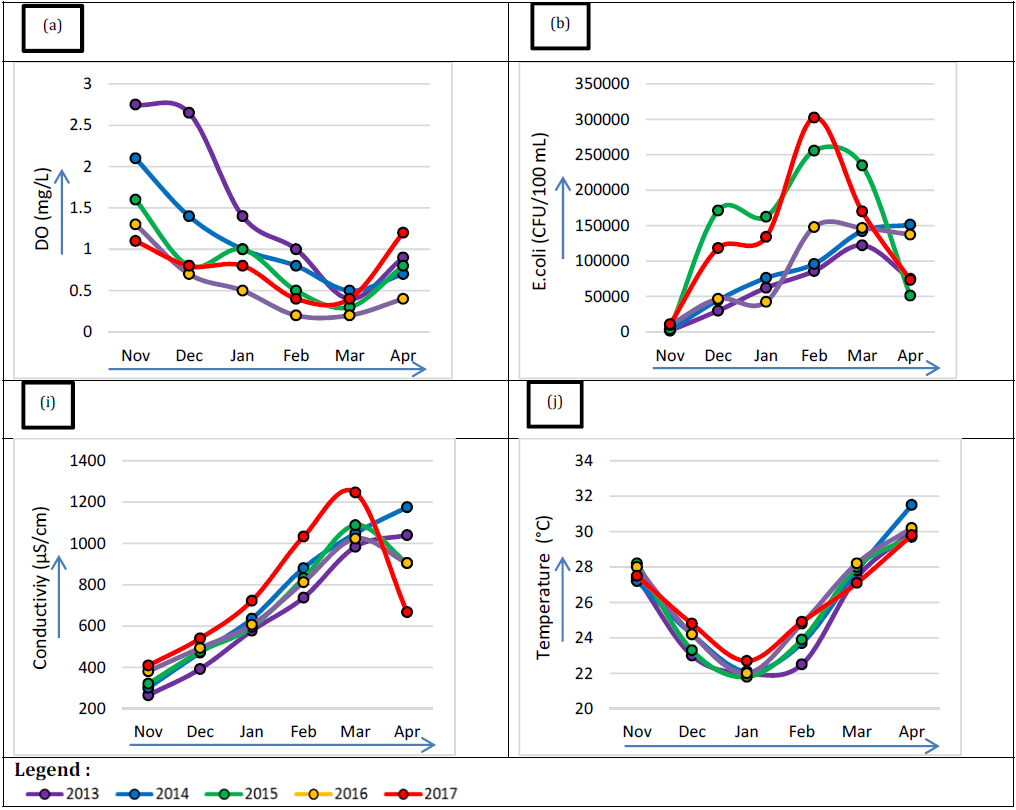
Figure 4: Yearly Trend of Average Monthly Concentration of Different Water Quality Parameters During Dry Months
For DO values in any part of the year the concentration level never reach the targeted guideline value of 6 mg/L of surface water which clearly signifies unabated anthropogenic willful pollution. Even the maximum values of DO at any time of the year never reach the targeted guideline value of 6 mg/L.
Figure 3(b, c) shows the trend of monthly averages of turbidity and TSS concentration. The pattern of the curve does not show a general trend of increase with time as was observed in cases of COD, DO. The average of all average concentration of Turbidity and TSS is respectively 37.3 NTU and 16.91 mg/L which is almost 4 times higher than the targeted drinking water value of respectively 10 NTU and 10 mg/L. The minimum monthly average concentration of turbidity is 5.2 NTU and for TSS 0.0 mg/L in November 2016 and December 2012 and the maximum monthly average was respectively 85.8 NTU in March 2014 and 32.1 mg/L also in March 2014. The minimum concentration of turbidity is 1.1 NTU in January 2014 and TSS is 1.8 mg/L in December 2014 and April 2017 and the maximum turbidity was158 in April 2015 and maximum TSS is 45 mg/L in December 2015 and March 2014.
The monthly average turbidity over the study period shows that the concentration was in most of the months more than the drinking water allowable concentration.
The trend of monthly average colour (Figure 3d) has almost a similar pattern to that of COD, having a general trend of increasing over time. Almost all the average values are much beyond the drinking water guideline value of 15pt-co. of GOB.
The average of all average concentration of colour is 44.27 pt-co which is almost 3 times higher than the targeted drinking water value of 15 pt-co. of GOB. The minimum monthly average concentration of colour is 11.0 pt-co in November 2013 and the maximum monthly average was 112.5 pt-co in March 2017.
It can be seen from Figure 3(d) that monthly averages of the colour concentration gradually increases over the years. In February 2013 the average value was 35 pt-Co which was found to be 100 in 2017, similarly in March 2013 it was 58 which increases to 113 pt-Co. Generally, February and March are the most critical months of the year when the colour concentrations are found maximum. The maximum concentration of colour was 211 pt-Co in March 2016 and the minimum 0.0 pt-Co in November 2013.
Figure 3(f) shows the trend of pH over the study period. The monthly averages of pH over the years are more or less stable; it varies between 7.14-7.6. All the values of pH in the study period are well within the guideline values of 6.5-8.50.
The trend of monthly average conductivity (Figure4c) has fairly a similar pattern to that of COD, having a general trend of increasing over the study period. The maximum conductivity concentration was found to be 1407 in the month of March 2017 and the minimum is 169 found in the month of November 2013, the minimum monthly average was found to be 265 in the month of November 2012, maximum monthly average was found 1246 in the month of March 2017 and the average of monthly average values was found to be 719. The trend of monthly average E. coli has fairly a similar pattern to that of COD, having a general trend of increasing over the study period (Figure 4b).
The maximum E. coli concentration was found to be 350,000 number/100 ml in the month of February 2017 and the minimum is 1000 number/100 ml found in the month of February and December 2012, the minimum monthly average was found to be 1731number/100 ml in the month of November 2012, maximum monthly average was found 302,500 number/100 ml in the month of February 2017 and the average of monthly average values was found to be 103644 number/100 ml (Figure 4b).
Figure 3e shows the trend of chlorophyll over the study period. It does not show any definite pattern over the study period. The average of monthly averages is found to be 35 μg/L, minimum of monthly average is 13.8 μg/L in the month of March 2017 and the maximum of monthly average is 81.5 μg/L found in April 2014. The maximum and the minimum concentration of chlorophyll is found 180.5 μg/L and 4.8 μg/L, respectively found in February 2015 and March 2017.
Figure 4j shows the trend of temperature value. The monthly average values over the study period vary between 21 to 32°C. Each monthly average does not show significant variations.
If we look on the yearly average values of raw water through 2013-2017 we observed that out of ten physiochemical parameters only two parameters namely pH and temperature are within the allowable drinking water level guidelines.
An extensive statistical regression and correlation study was carried out to relate all the ten-water quality parameter tested with each other and to identify, if any, a common surrogate parameter for the parameters tested. In total 45 nos of regression analysis were conducted. Correlation coefficients, coefficient of determination and p-values during the dry months of the study period of all the parameters, each other are shown in Table 4. It can be seen from the Table 4 by observing R2 values that no single parameter except COD has overall strong correlation with all the rest parameters. COD has remarkably good correlation with all other quality parameters and all the R2 values are >0.50 with the exception of temperature (R2 = 0.074) and chlorophyll (R2 = 0.156).
Table 4: Correlation Among Different Parameters of Sitalakhya River Raw Water
| COD R/R2/p | Turbidity | TSS | Colour | Chlorophyll | PH | DO | E. coli | Conductivity | Temperature |
COD | 1 | 0.84/0.71** | 0.76/0.59** | 0.87/0.75** | 0.39/0.16* | 0.73/0.54** | 0.74/0.55** | 0.73/0.53** | 0.95/0.91** | 0.27/0.074 |
Turbidity | - | 1 | 0.88/0.77** | 0.63/0.40** | 0.58/0.33** | 0..82/0.67** | 0.69/0.48** | 0.63/0.40** | 0.89/0.79** | 0.0.29/0.08 |
TSS | - | - | 1 | 0.52/0.27* | 0.55/0.30* | 0.79/0.62** | 0.75/0.57** | 0.49/0.24* | 0.80/0.65** | 0.20/0.04 |
Colour | - | - | - | 1 | 0.03/0.19 | 0.0.25/0.5* | 0.23/0.47 | 0.37/0.61** | 0.70/0.83** | 0.14/0.37 |
Chlorophyll | - | - | - | - | 1 | 0.255/0.5* | 0.087/0.11 | 0.017/0.13 | 0.24/0.49 | 0.31/0.56** |
PH | - | - | - | - | - | 1 | 0.38/0.62 | 0.19/0.44 | 0.68/0.82** | 9E-05 |
DO | - | - | - | - | - | - | 1 | 0.45/0.67** | 0.55/0.74** | 0.053 |
E.Coli | - | - | - | - | - | - | - | 1 | 0.47/0.69** | 0.004/0.06 |
Conductivity | - | - | - | - | - | - | - | - | 1 | 0.12/0.35 |
Temperature | - | - | - | - | - | - | - | - | - | 1 |
R = Correlation coefficient, R2 = Coefficient of determination, p = probability, **Correlation is significant at the 0.01 level (2-tailed), *Correlation is significant at the 0.05 level (2-tailed)
Out of other 9 parameters conductivity has R2 values more than 0.5 in six cases, turbidity and TSS have R2 values more than 0.5 in three cases, colour has in two cases, pH, DO, E. coli each has one and chlorophyll and temperature has none.
The obtained result allows a clear assumption that during the dry period of the year if high COD concentration are found in water, then high concentration of colour, turbidity, pH, TSS, E. coli, conductivity and lower concentration of DO will also be expected. And from COD measurements the colour, turbidity, pH, TSS, E. coli, conductivity and DO concentration and vice versa could be calculated for an emergency requirement.
The correlation equations of COD with other parameters along with R values are shown in Table 5. All R values are more than 0.70 except with temperature. A representative graph showing regression between COD and Conductivity is shown in Figure 5.
Table 5: Correlation Equations Between a Single Most Important Dominating Water Quality Parameter with Other Water Quality Parameters
Water quality parameters | Correlation Equation | Correlation coefficient (R) |
COD and Turbidity | Turbidity = 0.64 COD+13.29 | R = 0.84 |
COD and TSS | TSS = 1.75 COD+7.67 | R = 0.76 |
COD and Colour | Colour = 1.29 COD-3.79 | R = 0.87 |
COD and Chlorophyll | Chlorophyll = 0.39 COD+20.57 | R = 0.87 |
COD and pH | pH = 0.005 COD+7.24 | R = 0.73 |
COD and DO | DO = -0.0251 COD+1.89 | R = 0.74 |
COD and E.coli | E. coli = 2942 COD+20.57 | R = 0.73 |
COD and Conductivity | Conductivity = 14.06 COD+195.36 | R = 0.95 |
COD and Temperature | Temperature = 0.41 COD+24.39 | R = 0.27 |
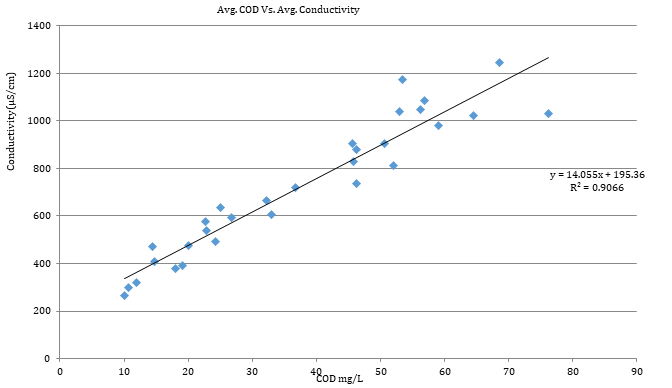
Figure 5: Regression Curve Between COD and Conductivity
It may be mentioned that the correlation equations were developed covering the hot dry seasonal months of the years which gives the most polluted water quality of the year. This correlation study is site and season-specific as such similar study may be continued for other location of the river as well as for other rivers. This might help to understand the trend of changes in the equations, if any, over time and space.
It is a widely discussed fact that in general, this river is being polluted by the discharge of untreated industrial effluent, urban wastewater, agrochemicals, sewage water, storm runoff, solid waste dumping, oil spillage, sedimentation and also illegal encroachment of canals and rivers which is increasing with the increase of population [25].
Estimation reveals that there was a decade ago over 12,000 industries in Dhaka metropolitan area located mostly in three clusters, namely, Hazaribagh, Tejgaon and Dhaka Narayanganj-Demra dam area. However, among all these the dyeing factories are the main polluters of the rivers. It is found that the untreated liquid waste originates around 61 percent from industrial and 39 percent from domestic sources. Seventy percent of the population of the city does not have access to improved sanitation facilities. At present, the industry owners under pressure are constructing Effluent Treatment Plants (ETPs) to comply with the rules of the Department of Environment [25]. However, they are reluctant to operate them because of a high recurring cost of imported ETPs and untreated wastes are discharged into the water bodies.
It has become long overdue that all stakeholders have to be careful regarding future man-made willful reckless pollution. The continuous pollution by the vested quarter is uninterruptedly going on making the water system operation a challenge for the water authority and nightmare for the denizens of the city.
The monthly averages of the water quality concentrations over the dry months of the year (November-April) of COD, DO, Turbidity, TSS, E. coli, conductivity and colour shows an increasing trend in deterioration of water quality over the years. The present concentration of most of the water quality variables studied are higher than the allowable drinking water guideline values of Bangladesh. Some parameters are even higher than the allowable limit of extracted water as a source of drinking water. The rivers surrounding Dhaka are the lifeline of this capital city and which future will determine the destiny of the citizens of the city. This research portrait a comprehensive picture of some of the important water quality parameters and trend of the raw water quality of the Sitalakhya river, the source water of the largest treatment plant of Bangladesh. Study on this particular surface water quality with a continuous quality data for five years covering each and every week of the year is probably conducted for the first time in Dhaka. This is a concerted approach to share the picture of the water quality of raw water source with the mass people as well as the policymakers.
An excellent linear correlation ship is illustrated between COD with Turbidity, TSS, colour pH, Do, E. coli and conductivity in water from Sitalakhya river at the intake of Dhaka plant in the dry months of the year. Thus, COD can be identified as most important dominating water quality parameter which can surrogate other water quality parameters under study.
It is to be remembered that this correlation has been done for a specific surface water source, river Sitalakhya that is the source of the largest surface water treatment plant in Dhaka, Bangladesh and for hot dry seasons of the study period (November-April). The relationship will be different for every water source i.e., the same correlation from one site could not be used in another site. Similar study may be taken for other different reaches of the same river as well as different reaches of other rivers.
Acknowledgment
A number of Engineers and technical staffs from the Dhaka plant and a number of experts from M/s SUEZ International, the constructor of Dhaka Plant project, especially Dr. Jean Claude Seropian, assisted in the study and this co-operation are greatly appreciated.
Conflict of Interest
The authors declare no conflict of interest.
Ajibade, W.A. et al. “Water Quality Parameters in the Major Rivers of Kainji Lake National Park, Nigeria.” African Journal of Environmental Science and Technology, vol. 2, no. 7, 2008, pp. 185-196.
Serajuddina, M. et al. “Dhaka City Surface Water Source: A Case Study on the Quality Status and Trend.” Global Science and Technology Journal, vol. 6, no. 2, 2018, pp. 15-34.
Fulazzaky, M.A. et al. “Assessment of Water Quality Status for the Selangor River in Malaysia.” Water, Air, & Soil Pollution, vol. 205, 2010, pp. 63-77.
Reddi, K.R. et al. “Tidal Fluctuations in Relation to Certain Physicochemical Parameters in Swarnamukhi River Estuary, East Coast of India.” Indian Journal of Marine Sciences, vol. 22, 1993, pp. 222-234.
Waeles, M. et al. “Seasonal Variations of Dissolved and Particulate Copper Species in Estuarine Waters.” Estuarine, Coastal and Shelf Science, vol. 62, nos. 1-2, 2005, pp. 313-323.
United States Environmental Protection Agency (USEPA). Sampling Handling and Preservation. Methods for Chemical Analysis of Water and Wastes, EPA 600/4-79-020, 1983, pp. 58-61.
Agarwal, M. and A. Agarwal. “Linear Regression and Correlation Analysis of Water Quality Parameters: A Case Study of River Kosi at District Rampur, India.” International Journal of Innovative Research in Science, Engineering and Technology, vol. 2, no. 12, 2013, pp. 7273-7279.
Bhandari, N.S. and K. Nayal. “Correlation Study on Physico-Chemical Parameters and Quality Assessment of Kosi River Water, Uttarakhand.” E-Journal of Chemistry, vol. 5, no. 2, 2008, pp. 342-346.
Chaubey, S. and M.K. Patil. “Correlation Study and Regression Analysis of Water Quality Assessment of Nagpur City, India.” International Journal of Scientific and Research Publications, vol. 5, no. 11, 2015, pp. 753-757.
Hasan, T. and M.B. Habib. “Establishing Relationships between Water Quality Parameters for the Buriganga River Using BOD₅ and pH as a Common Parameter.” Proceedings of the 5th International Conference on Environmental Aspects of Bangladesh (ICEAB 2014), 2014.
Khatoon, N. et al. “Correlation Study for the Assessment of Water Quality and Its Parameters of Ganga River, Kanpur, Uttar Pradesh, India.” IOSR Journal of Applied Chemistry, vol. 5, no. 3, 2013, pp. 80-90.
Kumar, N. and A. Sinha. “Drinking Water Quality Management through Correlation Studies among Various Physico-Chemical Parameters: A Case Study.” International Journal of Environmental Sciences, vol. 1, no. 2, 2010, pp. 253-259.
Serajuddinb, M. et al. “Correlation among Some Global Parameters Describing Organic Pollutants in River Water: A Case Study.” International Journal of Research-Granthaalayah, vol. 6, no. 7, 2018, pp. 278-289.
Waziri, M. and V. Ogugbuaja. “Interrelationships between Physicochemical Water Pollution Indicators: A Case Study of River Yobe, Nigeria.” American Journal of Scientific and Industrial Research, vol. 1, no. 1, 2010, pp. 76-80.
Serajuddinc, M. and A. Islam. “Surface Water Quality Susceptibility in Drinking Water Treatment at Dhaka, Bangladesh.” Journal of Biodiversity and Environmental Sciences, vol. 11, no. 1, 2017, pp. 123-133.
Tchobanoglous, G. et al. Wastewater Engineering: Treatment and Reuse. 4th ed., Tata McGraw-Hill, 2003.
DeZuane, J. Handbook of Drinking Water Quality. 2nd Ed., John Wiley & Sons, 1997.
Fatoki, O.S. et al. “Situation Analysis of Water Quality in Umtata River Catchment.” Water SA, vol. 27, no. 4, 2001, pp. 467-474.
APHA. Standard Methods for the Examination of Water and Wastewater. 21st Ed., American Public Health Association, 2005.
Kumar, M. et al. “Identification and Evaluation of Hydrogeochemical Processes in the Groundwater Environment of Delhi, India.” Environmental Geology, vol. 50, 2006, pp. 1025-1039.
Jothivenkatachalam, K. et al. “Correlation Analysis of Drinking Water Quality in and around Perur Block of Coimbatore District, Tamil Nadu, India.” Rasayan Journal of Chemistry, vol. 3, no. 4, 2010, pp. 649-654.
Patel, J.Y. and M.V. Vaghani. “Correlation Study for the Assessment of Water Quality and Its Parameters of Par River, Valsad, Gujarat, India.” International Journal of Innovative and Emerging Research in Engineering, vol. 2, no. 2, 2015, pp. 150-156.
Grum, M. et al. “The Underlying Structure of Systematic Variations in the Event Mean Concentrations of Pollutants in Urban Runoff.” Water Science and Technology, vol. 36, nos. 8-9, 1997, pp. 135-140.
Vervier, P. et al. “Spatial Changes in the Modalities of Nitrogen and Phosphorus Inputs in a Rural River Network.” Water Research, vol. 33, no. 1, 1999, pp. 95-104.
Government of Bangladesh (GoB). Environmental Conservation Rules. Ministry of Environment and Forest, 1997.
