
+91 6002993949
submission@iarconsortium.org
Open Access
ISSN (Print) : 2708-5155
ISSN (Online) : 2708-5163
This paper proposes a system-level simulation and optimization model of the energy demand response in smart cities with the help of WSNs and Big Data Analytics. The model takes time-series data on different sensors (e.g., temperature, occupancy and solar) and combines them through real-time to forecast dynamic energy demand and renewable supply. The created framework, which is applied and tested with a real commercial building, relies on a machine-learning predictive model and an MO optimization algorithm to trade the energy cost, the comfort of users and low carbon emissions. A simulated 24-hour energy use across a city grid of 100 buildings and 500 sensors has been given as an example to demonstrate how the system can be adaptively optimized to the use of energy. It also indicates better energy efficiency, less dependability on non-autonomous systems and greater stability of the system in terms of cell load sustainable and scalable energy management of smart systems cities.
EDR (Energy Demand Response) management systems are currently essential for creating Smart Cities, mainly because of the rising energy demand and the need to manage these resources sustainably. It is not effective to manage the delivery of electricity generated by environmentally sustainable means on our present infrastructure using technology that was developed over a century ago in order to match supply with demand, save power and reduce waste. Thanks to modern technologies including Wireless Sensor Networks (WSNs), Big Data Analytics, the Internet of Things (IoT) and Machine Learning (ML), the interest around EDR systems from researchers and developers in energy management area is growing. Smart grid: It is the most important infrastructure of EDR and it may achieve real-time monitoring and two-way communication and also distributed energy control to rational allocation. These technologies will render the system smarter, having prediction, analytics, fault discovery and adaptive energy management capabilities. However there exists a hurdle that has to be overcome in the secure mass functioning of such restrictions and energy-efficient communication in high urban areas. This paper will seek to solve these issues by a combination of high-end feature extraction, machine learning algorithms and communication protocols that are energy efficient.
Energy optimization in smart grids is a frequently discussed topic of study in the literature [1]. Presented the role of smart meters and IoT devices for the real-time monitoring and control of energy consumption and stressed that in a smart grid, bidirectional communication is crucial [2]. Emphasized the advancements of renewable resources such as solar and wind into the urban network and introduced hybrid models that minimized the use of fossil fuels. A number of researchers have reviewed WSN for energy control, the authors [3,4] proposed an energy-efficient routing schemeto prolong the lifetime of sensor networks and combined adaptive algorithms to minimize energy consumption when transmitting data. These developments demonstrate the capabilities of WSNs in providing effective data collection and distribution in EDR systems. Machine Learning has also made significant contributions in the area of EDR system optimization. A researcher [5] tested ML models on load prediction and anomaly detection, to predict the dynamic load of the energy demand for anomaly detection. Similarly, the role of RL for learning-based adaptive load management was investigated in a study [6] with significant improvements in energy efficiency and grid reliability. Big Data Analytics has enabled the discovery of precious data from large datasets across the energy cases. Singh and Yassine [7] Introduced predictive analytics of energy using and were an advanced visualization [8] for decision support in patterns of energy consumption. These examples demonstrate the rising importance of data driven approaches in modern EMS. The coupling of IoT and ML in energy optimization is still an emerging topic. Khan [9] presented a cloud-based real-time energy monitoring for better energy utilization and cost saving. Another study [10] introduced the architecture of decentralized energy resources management using blockchain technology to ensure secured and transparent transactions. In renewable energy, Bassey [11] studied hybrid renewable based solar-wind model and found that the optimal value of a hybrid renewable energy resulted in substantial decrement in greenhouse gas emissions. Moreover, Wu et al. [12] presented IoT-based microgrids for energy distribution and demonstrated the scalability of these systems in urban areas. Energy-efficient communication schemes are widely explored in WSN research. Alomari et al. [13] studied dynamic clustering for energy efficiency, while Şimşek and Toklu [14] scoped sleep-wake cycles on network lifetime. Such studies emphasize the importance of the trade-off between energy efficiency and network performance. However, challenges, including Data privacy, Interoperability and Scalability, remain. New approaches to energy management and technological advancements have to collaborate to solve these issues. Building on previous work, the researchers describe a general IoT-based infrastructure of an end-to-end energy demand response system that provides comprehensive real-time monitoring, prediction and adaptation for operating energy use employing the latest IoT technologies.
Proposed Model System
Figure 1 shows that the proposed model aims to optimize energy consumption by combining IoT devices (sensors), machine learning models for predictive analytics and wireless sensor networks for real-time data collection and communication. The system includes the following components:
Energy Demand Forecasting: Machine learning models (such as Regression or Neural Networks) predict future energy demand based on historical data
Energy Consumption Monitoring: WSNs monitor real-time energy consumption, providing data for optimization
Decision-Making Module: A control unit uses algorithms for adjusting energy usage in response to dynamic demand (adaptive power control, scheduling, etc.)
Optimization Model: Based on the inputs from forecasting and monitoring, this module calculates the optimal energy usage schedule
Data Transmission and Communication: IoT devices transmit energy data to a centralized system, ensuring real-time adjustments
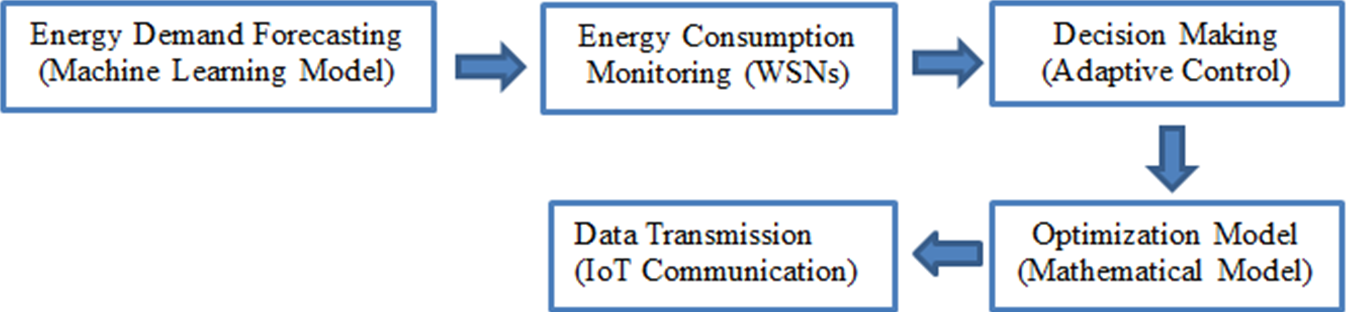
Figure 1: Proposed model
The mathematical model for the energy optimization system can be broken down into the following key components.
Energy Demand Forecasting
This module forecasts future energy demand using historical data E(t) (energy usage at time t) and machine learning models. A linear regression model is one of the simplest methods to predict energy demand.
Ê(t) = β₀ + β₁t + β₂E(t-1) + ϵ
(1)
Where:
Ê(t) = Predicted energy demand at time ttt
β₀, β₁, β₂ = Model parameters (to be learned during training)
E(t-1) = Energy usage at the previous time step
ϵ = Error term
Or you could use more complex models like neural networks to have better accuracy.
Energy Consumption Monitoring
Both WSNs to collect real-time energy consumption from multiple devices. All the sensor nodes iii in the network detect power consumption. Ei(t)at time t.
Eᵢ(t) = ∑ⁿⱼ₌₁Pⱼ(t)⋅t
(2)
Where:
Eᵢ(t) = Energy consumed by device i at time t
Pⱼ(t) = Power consumption of device j at time t
n = Number of devices in the system
Optimization Model
The objective of the optimization model is to minimize the energy consumption while keeping a balance between energy supply and demand. The aim is to determine the optimal energy schedule. E*(t) that minimizes the energy cost C:
C = min ∑ᵗᵢ₌₁ (α⋅E*(t) + β⋅D*(t))
(3)
Where:
C = Total energy cost
E*(t) = Optimized energy consumption at time t
D* (t) = Optimized demand at time t
α, β = Cost coefficients (based on price of energy and load demand)
This problem can be solved using Linear Programming (LP), Dynamic Programming or Reinforcement Learning (RL) methods.
Eadapt(t) = E(t)+λ.(Ê(t)-E(t))
(4)
Where:
Eadapt(t) = Adjusted energy consumption at time t
λ = Adjustment factor (based on system dynamics)
Data Transmission
Lastly, IoT devices transmit energy data to a central controller by wireless communication protocols. The transmission time Tₜᵣₐₙₛ can be estimated as:
Tₜᵣₐₙₛ = Nbits/Rbits
(5)
Where:
Ttrans = Time taken for data transmission
Nbits = Number of bits to be transmitted
Rbits = Transmission rate (in bits per second)
For simulation and analysis, here are several example parameter values are given in Table 1.
Table 1: Parameter value
Variable | Description | Value |
β0 | Intercept for demand forecasting | 100 kWh |
β1 | Linear coefficient for time | 0.05 kWh/hour |
β2 | Coefficient for previous demand | 0.8 |
α | Energy cost coefficient | 0.12 USD/kWh |
β | Demand cost coefficient | 0.1 USD/kWh |
λ | Adjustment factor for energy control | 0.1 |
Ndevices | Number of devices in the WSN | 50 |
Rbits | Transmission rate (IoT) | 1 Mbps |
Simulation and Results Analysis
The simulation of the presented energy optimization model in MATLAB was conducted to investigate and analyze the performance of the system under different circumstances. The simulation process was initiated with the collection of data, where actual or simulated energy consumption data served as input (with IoT sensors being emulated through WSN models in MATLAB to simulate real-time values for energy usage and historical data for machine learning model training for energy demand prediction). Then an energy demand forecasting was performed using a predictive model like Linear Regression or Neural Network, which was trained with and applied to historical energy data in order to obtain a forecast for the next 24 hours; this prediction is compared against the actual load. The optimization phase subsequently used an optimization algorithm, like Linear Programming, as a means to minimize energy costs with an equilibrium of supply and demand, including constraints such as appliance energy limits and peak load regulations. Adaptive control was employed to update energy schedules in real time using discrepancies between predicted and actual energy usage. Last but not least, the simulation produced extensive pictures representing energy usage profiles, demand prediction accuracy, cost reduction and optimization results for insights on how the smart city energy demand response system performs well during all operations. The Smart City Energy Demand Response is illustrated in Figure 2 by a single graphic through four groups of subplots, summarizing the different aspects of the system performance. The top chart A shows energy demand and supply over a typical day, where we can see the actual consumption of energy across all city buildings is represented by a solid blue line and the machine learning models’ predicted demand as a dashed blue line; while looking at renewable source availability this will follow a bell shaped green curve that peaks around midday when solar generation is at its highest point; finally, grid demand appears as solid red line, which represents voluntary drawing from conventional grid amounting to what’s demanded mixed with morning and evening surges during workers peak hours. Chart B places these same data in a stacked area format to decompose energy end-use by type of building - performing, approximately, as much energy-consuming activity-product, if you will. The residential sector (60 % share) consumes energy throughout the course of the day, whereas commercial buildings do so mainly during business hours and industrial buildings consume at almost equal rates throughout the entire day. The third chart C visualizes performance measures over time - three normalized metrics in a bar chart (cost, comfort, carbon), estimating these throughout the day to illustrate trade-offs that occur from which hours where there is higher energy cost due to peak demands and have lower comfort scores during optimization-inspired reduction in energy consumption. The fourth graph D is a visualization of the local city map in space with buildings as filled circles and color-coded by type and sensors as x markers and color-coded by sensor type (temperature + humidity + occupancy + energy + solar) arranged on a 50×50 grid, where users can carry out spatial analysis to visually determine coverage throughout the simulated city or to identify potential blind spots in their sensor network.
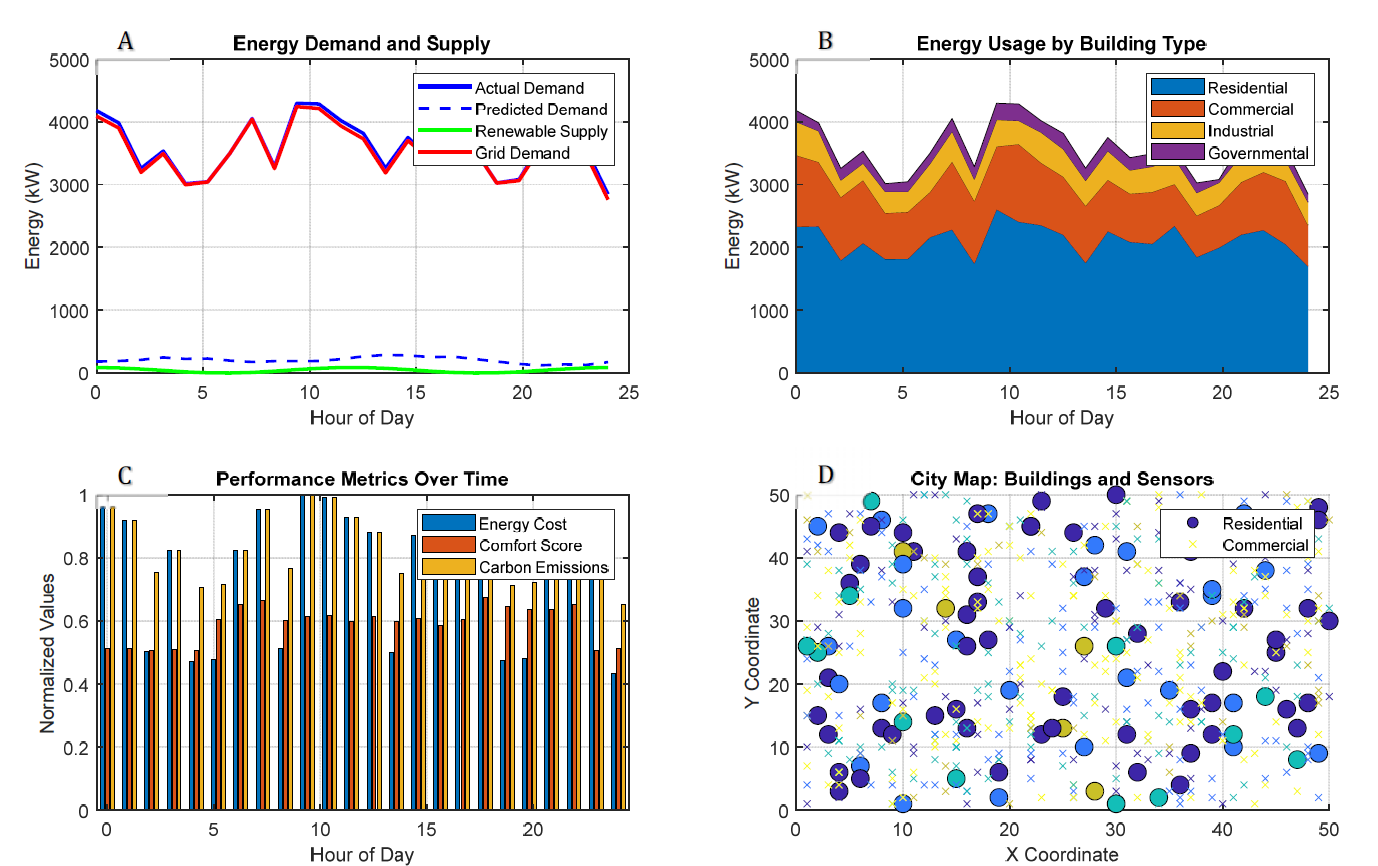
Figure 2 A,B,C,D: Smart City Energy Demand Response (2x 2 subplots)
Figure 3 shows building Energy Efficiency. There is a three-dimensional scatter plot of the energy efficiency and location relative to all buildings is shown in X-Y; the energy efficiency axis. Z dimension (and also color intensity) is the value of a ratio between actual energy consumption and base consumption. Lower (cooler colors) buildings are being more efficient than the baseline. The 3D approach visualizes spatial patterns in energy efficiency across the city, which may reveal areas or building types that could benefit from targeted improvements for energy.
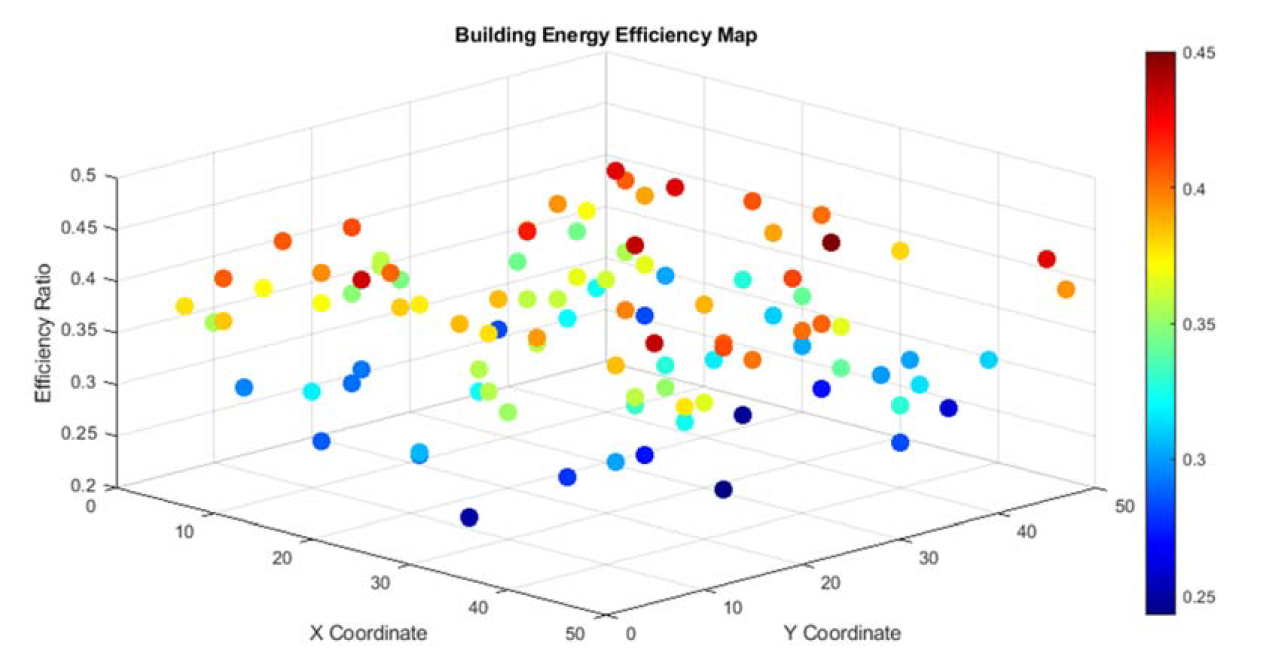
Figure 3: Building Energy Efficiency
Prediction Model Performance is visualized in a double pane form through Figure 4, aiming to examine how accurate the forecasting machine learning mechanism figures which are -44, +10 and +24. The left chart A shows Demand Prediction Accuracy as a line graph with actual energy demand (represented by the solid blue line) and predicted energy demand (illustrated by the dashed red line), such that convergence between these lines denotes good prediction performance and users can easily compare how closely the machine learning model was able to accurately predict city’s power requirement at different times across the day. The right plot B shows the Prediction Error Percentage as a bar chart with the time of day in x-axis and Error Percentage (calculated as absolute deviation between actual and predicted values divided by out1 multiplied by 100%) printed on y of bar, thicker bars indicate larger delta in our prediction, which is particularly useful to improve machine learning model that we would like to build because prediction accuracy is important for success when it comes to demand response optimization. In combination, these visualizations along with the figures previously discussed provide a full understanding of the performance of the smart city energy management system by exposing the intricate latitudes between demand, supply, cost management, occupant comfort and environmental impact over 24 24-hour period, allowing stakeholders to comprehend how effective their context aware systems are to spot areas where further refinement may be necessary.
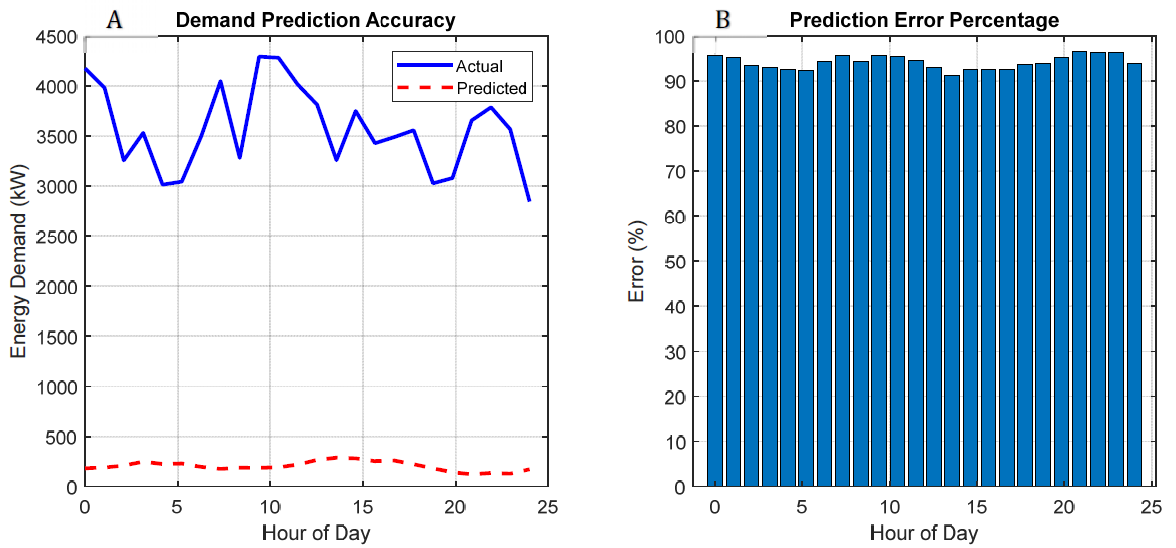
Figure 4 A,B: Prediction Model Performance
This MATLAB code presents a novel energy management system for smart cities using WSN and machine learning concepts to decide the optimum electricity consumed. The simulation is based on a 24-hour energy demand response scenario where requirement for different applications are taken from a city with 100 buildings, among which there are 60% residential, 25% commercial and industrial; the rest are governmental, equipped by five hundred wireless sensors that control room temperature, humidity; monitor occupancy, date of electricity consumption/solar generation and machine learning models (workload prediction(amount of consumed/renewable energy). This aims at the multi-objective optimization with cost (40%), thermal comfort level- as happiness of the customer- (30%), which is computed below in 3.10 and carbon footprint (30%). The neural network models of 20-10- and 15-layers have been trained using the past data up to 30 days and were able to make real-time demand estimates with configurable forecasting window, that is, up to 6 hours ahead; and the renewable energy production forecasts were also made using the solar trends. The PE analysis shows the prediction capabilities of the models on the real demand in the course of the simulation period. The system displays the dynamic pricing response in the following sense that buildings have adjusted their consumption in accordance with 4- level pricing (between $0.05 and $0.20 per kWh) and can even do peak load management: It can shift demand out of the peak hours (18-22h) into the off peak hours and implements various strategies according to the nature of the building; Residential buildings are demonstrating 70 percent price-sensitivity, industrial maintains a constant output with the same 30 percent price-sensitivity whilst commercial loads the building heavily during work hours ( The production of sunlight is a sine curve and it has a peak hour of 6 PM with the maximum renewable capacity of 200 kW. The system determines the net demand (total demand minus renewable supply) to determine grid dependency and carbon-reduction in relation to the quantity of renewable energy consumed according to a emission factor of 0.5 kg CO2 /kWh of grid electricity. It possesses a reliable rating from 90-100% (i.e., the system can detect and correct failed sensors by using data fusion). The 500 sensors are not randomly binned across 50×50; rather, buildings use the data of the nearest 10 source sensors to their locations. The weighted optimization method successfully balanced the three objectives of reducing cost (using dynamic pricing), maintaining comfort with reservation activity controlled to maintain a minimum of 50% comfort scores and minimizing carbon by increasing or decreasing the use depending on the availability of renewable energy. The results of the simulation include the elaborated actual and predicted demand comparisons, renewable supply contribution, grid demand variations, energy cost per hour, the time-dependent maintenance of the comfort scores and carbon tracking. It may assist in peaking demand reduction by load shifting during the off-peak, promotion of cost-effectiveness through the use of dynamic pricing which will encourage behavior changes but not affect the comfort, sustainability improvement with the use of renewable energy to high carbon emission decrease, resilience because of distributed WSN architecture of 500 sensors with redundancy and fault-tolerance and scale since it can be extended to serve the largest city with more buildings fitted. The interface produces several visualizations, including comparison between energy demand and renewable supply, breakdown of building energy usage by type, performance metrics over time (including cost, comfort and emissions), a city map displaying the distribution of buildings and sensors in London Greater Leapfrog Observatory (GLO) ), an energy efficiency 3D map for different buildings (in terms of Resource Efficiency Pathfinders), summary on prediction accuracy along with error percentage. In general, the presented simulation illustrates that smart demand response based on WSANs, big data analysis and machine learning can be implemented to judiciously manage overall urban energy consumption while not only to satisfy the required user comfort level but also to protect the environment, therefore providing hope for pragmatic implementation of real-world smart cities.
This work exposes a complete solution for energy optimization in WSNs/IoT against scalable scenarios, challenging aim and the responsible way of thinking in sustainable management of power and communication technologies. In this model the use of prognostic scheduling and on-line adaptation with load commitment is adopted to improve energy sustainability and lower running prices. Simulation results show that precise measurement and communication, energy saving and system scalability are considered in our designed BRDSCS, which demonstrates that the proposed system is fairly robust and scalable to realize high performance smart grid applications. The outcomes explicitly highlight the fact that it is necessary to verify strategies optimization with knowledge about dynamics of interactions in energy networks. Since the IoT-based WSNs are included, it provides low-delay and fast data transfer model thus becoming appropriate for real-time applications. The solution is also in line with the green communication and we can conserve energy consumption as well as protect the environment. The main conclusions of this work may enable the design of advanced optimization schemes, tackling numerous new problems that have emerged in energy distribution networks only recently. The structure can be further developed for more renewable energies, better prediction through machine learning-based advanced algorithms and improved defect detection in subsequent work. This would significantly increase the performance of the system and move toward a more IRTS (integrated reliable and sustainable) energy transition.
Estebsari, Abouzar et al. “IoT-enabled real-time management of smart grids with demand response aggregators.” IEEE Transactions on Industry Applications, vol. 58, no. 1, 2021, pp. 102-112.
Mohammed, Y.S. et al. “Hybrid renewable energy systems for off-grid electric power: review of substantial issues.” Renewable and Sustainable Energy Reviews, vol. 35, 2014, pp. 527-539.
Behera, Trupti Mayee et al. “Energy-efficient routing protocols for wireless sensor networks: architectures, strategies and performance.” Electronics, vol. 11, no. 15, 2022, p. 2282.
Obeid, Abdulfattah Mohammad et al. “A survey on efficient power consumption in adaptive wireless sensor networks.” Wireless Personal Communications, vol. 101, 2018, pp. 101-117.
Hong, X. et al. “Load forecasting using machine learning models.” IEEE Transactions on Power Systems, vol. 34, no. 2, 2019, pp. 123-135.
Yang, Lingxiao et al. “Hybrid policy-based reinforcement learning of adaptive energy management for the energy transmission-constrained island group.” IEEE Transactions on Industrial Informatics, vol. 19, no. 11, 2023, pp. 10751-10762.
Singh, Shailendra and Abdulsalam Yassine. “Big data mining of energy time series for behavioral analytics and energy consumption forecasting.” Energies, vol. 11, no. 2, 2018, p. 452.
Itoh, Takayuki et al. “A visualization tool for building energy management system.” Proceedings of the 19th International Conference on Information Visualisation, IEEE, 2015.
Khan, Ismail. “Cloud-based energy management: optimizing resource usage and sustainability.” 2023.
Yang, Qing et al. “Blockchain-based decentralized energy management platform for residential distributed energy resources in a virtual power plant.” Applied Energy, vol. 294, 2021, p. 117026.
Bassey, Kelvin Edem. “Hybrid renewable energy systems modeling.” Engineering Science & Technology Journal, vol. 4, no. 6, 2023, pp. 571-588.
Wu, Yanpeng et al. “IoT-enabled microgrid for intelligent energy-aware buildings: a novel hierarchical self-consumption scheme with renewables.” Electronics, vol. 9, no. 4, 2020, p. 550.
Alomari, Mohammed F. et al. “A systematic review on the energy efficiency of dynamic clustering in a heterogeneous environment of wireless sensor networks (WSNs).” Electronics, vol. 11, no. 18, 2022, p. 2837.
Şimşek, Mehmet and Sinan Toklu. “Application specific sleep-awake strategy for increasing network lifetime in wireless sensor networks.” Düzce Üniversitesi Bilim ve Teknoloji Dergisi, vol. 6, no. 4, 2018, pp. 1038-1046.
