
+91 6002993949
submission@iarconsortium.org
Open Access
ISSN (Print) : 2708-5155
ISSN (Online) : 2708-5163
In the current work, the Landsat data were applied to monitor vegetation in the governorate of Wasit in Iraq country as the region of interest during the period between 2012 and 2024. NDVI was calculated and analyzed by using Landsat Satellite Image in GIS environment which was used to get binary images through analysis. Vegetation changes in this area were estimated and explored with the help of the Normalized Difference Vegetation Index (NDVI) as a vegetation index. The findings display minor increment in the vegetation rates. The binary image extraction method was applied to estimate the area of every period.
As an essential component of terrestrial biological systems, vegetation not only plays a vital role in guiding biodiversity but also makes a substantial contribution to soil and water preservation as well as environmental guidelines. The significant variation in plant cover is considered the "marker" of natural biology as it is closely linked to ecological factors including the environment, soil and water. Environmental change is widely acknowledged to have the potential to alter plant cover, which in turn may lead to increased frequency and severity of territorially catastrophic events (such as desertification, salinization, dust storms, floods, etc.). One of the main components of the hydrological cycle and a typical source of water for the planet is precipitation [1,2].
One biotic element and natural condition of the earth's surface is land cover. Changes in the climate and human activity alter the land, changing the land's cover. The shift in land cover is the most important aspect of environmental change on a global scale. Numerous processes, such as the energy cycle, vegetation primary productivity, atmospheric circulation, vegetation productivity and the biogeochemical cycle, are influenced by the land cover on the earth's surface. Change detection is the technique of watching an item at certain intervals to identify changes in its condition over time; it frequently uses multi-temporal data sets to establish putative effects [3]. Vegetable lands, which are classified into two categories farms (man-made land) and forests (natural land) that are tended by humans can be broadly defined as land used for food production. Iraq is known for its palm palms and boasts green spaces, farms and woods [4].
Forests, trees and fields are examples of vegetation. Each species of vegetation has an own spectral signature and its reflective qualities differ from one another. It can often distinguish between healthy and unhealthy by using a unique spectral signature. Water content, cell structure and leaf pigment all influence the vegetation's spectrum reflectance. In the near-infrared spectrum, for instance, deciduous trees have a greater reflectivity. The vegetation's spectral reflection is seen in Figure 1. Reflectance that is visible the pigments in the leaves in the visible portion of the picture absorb the majority of the sun's light. Uninfected grass appears green because chlorophyll absorbs a lot of light in the blue and red wavelengths.
Figure 1: The spectral reflectance of vegetation
Figure 2: Wasit governorate in Iraq
Reflectance in the near-infrared Healthy vegetation has a significantly greater reflectance in the Near Infrared (NIR) spectrum than in the visible spectrum because of the cellular structure of the leaves, particularly the spongy mesophyll [5]. Therefore, strong NIR reflectance and low detectable reflection in the visible zone are clear indicators of healthy plants. The reflectance of the short waves infrared light. The water content and plant structure have an impact on the reflection at short-wave infrared wavelengths. The wavelengths of 1.45, 1.95 and 2.6 μm have a strong absorption. Following then, the reflectance often rises as a result of the leaves decreased water content beyond the SWIR zone.
The Study Area
The studied area in this work is Wasit which is in Iraq, as shown in Figure 2. It lies in (32.188°N) and (46.298°E) and elevation 30 m. Its area of 204.2 km2.
The present study depends on Figure 3 downloaded from the website of Geological Survey (USGS) Earth explorer (https://earthexplorer.usgs.gov ).
Normalized Difference Vegetation Index (NDVI) Calculation
Vegetation cover was separated from other forms of land cover and its density was ascertained using NDVI. Additionally, it makes it possible to detect anomalous changes in the growth process and to identify and visualize vegetation regions on the map. Since the human eye can perceive many plants, a lot of green light is reaching it. Plant leaves contain 0.4–0.7 μm chlorophyll that may be used for photosynthesis. Conversely, plants have higher photosynthetic activity at wavelengths between 0.7 and 1.1 μm than at 1.0 μm due to the cell structure of the leaves. The basis for digital processing techniques for satellite images that display vegetation cover is the fact that plants have low reflectivity in the red wavelength region and high reflectivity in the near-infrared wavelength range [6]. It shows the proportion of the difference between the red wavelength and the near-infrared wavelength of their overall spectral reflectance [7]:

(1)
NIR: Near Infrared Reflectance
RED: Red Reflectance
Analysis of Vegetation from 2012 to 2024 is done by calculating of green places in image by counting green pixels in Figure 4 as follows.
Figure 3: Vegetation-Surface Reflectance (Iraq-Wasit)
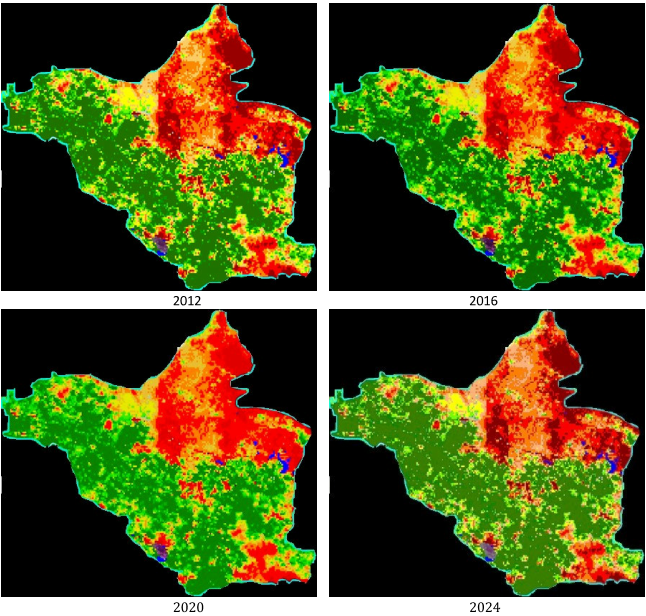
Figure 4: Minimum Distance Classification NDVI distribution
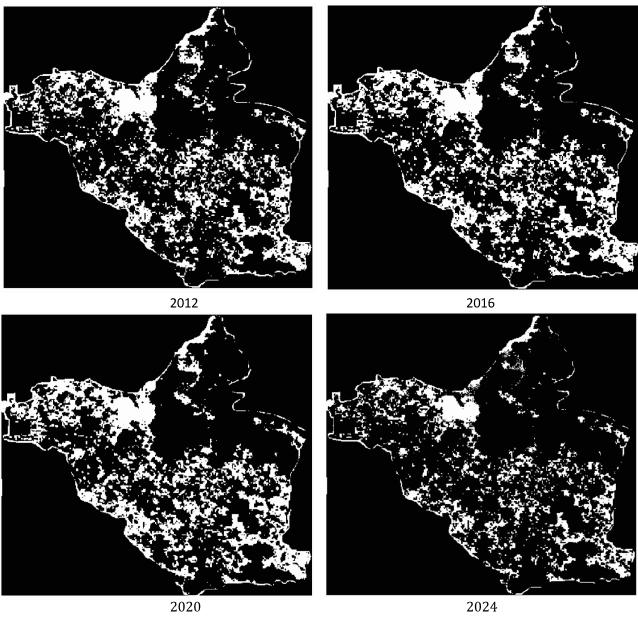
Figure 5: The NDVI distributions
Table 1: The vegetable areas calculation from the NDVI
Year | Area ratio (%) | Rate increasing |
2012 2016 2020 2024 | 27.68 28.18 29.53 30.03 | - 1.81% 4.79% 1.69% |
The Vegetable Areas Calculation from the NDVI Images is in next table, it is calculated by classification of pixels to green, blue and red with threshold of each pixel component (RGB: red, green and blue) using Equation 1 and listed in Table 1. We noticed a little increase in vegetation rate in 2020 because to the reasonable monsoon rains [8].
The NDVI indices Figures 5 are shown.
In this study, the Landsat images were employed to approximate the vegetation rates in the Wasit/Iraq as area of interest between the year 2012 and 2024. NDVI was applied to detect vegetation and simulate the variation in the vegetation and the findings indicated that an increment of the vegetation occurred by the value of 1.81% in the year 2016 to 4.79% in 2020 and, 1.69% (small increase) in 2024. Binary image extraction technique calculated the area of each period.
Wullschleger, S.D., et al. "Plant functional types in Earth system models: Past experiences and future directions for application of dynamic vegetation models in high-latitude ecosystems." Annals of Botany, vol. 114, no. 1, 2014, pp. 1–16.
Al-Fartusi, A.J., et al. "Utilizing Spectral Indices to Estimate Total Dissolved Solids in Water Body Northwest Arabian Gulf." Indonesian Journal of Marine Sciences, vol. 28, no. 3, 2023.
Roy, P.S., et al. "Anthropogenic land use and land cover changes-a review on its environmental consequences and climate change." Journal of the Indian Society of Remote Sensing, vol. 50, no. 8, 2022, pp. 1615–1640.
Al-Hassany, H.D.S. Energy Production by Using Combined Heat and Power System (CHP) with the Gasification of Palm Wastes: Case of Iraq, 2024.
Zahir, S.A.D.M. et al. "A Review of Visible and Near-Infrared (Vis-NIR) Spectroscopy Application in Plant Stress Detection." Sensors and Actuators A: Physical, vol. 338, 2022, p. 113468.
Munné-Bosch, S. and Villadangos, S. "Cheap, cost-effective and quick stress biomarkers for drought stress detection and monitoring in plants." Trends in Plant Science, vol. 28, no. 5, 2023, pp. 527–536.
Roerink, G.J. et al. "Assessment of climate impact on vegetation dynamics by using remote sensing." [Journal Name Missing], vol. 28, 2003, pp. 103–109.
Shahad, S.H. et al. "Change detection for Wasit province’s land cover between 2013 and 2020." Journal of Physics: Conference Series, vol. 2114, 2021, p. 012072, doi:10.1088/1742-6596/2114/1/012072.
