
+91 6002993949
submission@iarconsortium.org
Open Access
ISSN (Print) : 2708-5112
ISSN (Online) : 2708-5120
This study focused on the construction and standardization of Mathematics achievement test for Senior Secondary1 Students (SS1). A total of 80 item objective test items were initially generated from SS1 mathematics curriculum using a table of specification. The items were validated and passed through a process of item analysis by administering to a sample of 300 SS1 students. Forty items emanated from the item analysis and were further administered to 1000 SS1 students in Onitsha Educational Zone of Anambra State within a time interval of 1 hour. A mean score of approximately 22 was calculated and that became the norm for the 40 item objective test items. The study equally revealed that there was a statistically significant mildly positive relationship between the difficulty index and the discrimination index.
Testing is an integral part of the teaching learning process. Tests are ways of ascertaining the existence of some desired attributes or characteristics in the testee. Osegbo [1], defined tests, as “a set of standard questions presented to an individual or group of individuals to answer or respond to (pg 1)”. Tests are classified into different categories based on the purposes which they serve. For instance, there are performance tests, short answer tests, essay tests, multiple choice tests, true-false tests, matching tests, placement tests, diagnostic test, progress/achievement test, final progress/achievement test, proficiency test, aptitude test, norm referenced tests, criterion-referenced tests, summative tests, formative tests, group tests, individual tests, speed tests, power tests, verbal tests, non-verbal tests, culture baised tests, culture-fair tests, standardized tests, non-standardized tests etc. [1-3]. Roediger et al. [4], identified the benefits of testing to include:
Aiding retention as a result of retrieval
Identifying knowledge gaps
Learning more from the next study episode
Helping students to organize their knowledge
Improving transfer of knowledge to new contexts
Retrieval of untested materials
Improving metacognitive monitoring
Providing feedback to instructors
Improving students study habits
According to Sheeba [5], tests provide diagnostic feedback, help in setting standards, evaluate students’ progress, motivate performance etc. They also help teachers to appraise how successfully they are presenting materials and they provide students with indicators of what topics or skills they have not yet mastered and which they should concentrate on, thus reinforcing learning [2].
The present paper focuses on achievement test. Wu [6], sees achievement tests as “tests designed to measure the knowledge, skills and abilities attained by a test taker in a field, in a subject area or in a content domain in which the test taker has received training or instructions” (p.148). It measures present proficiency, mastery and understanding of general and specific areas of knowledge [7]. Kendra [8] equally stated that achievement tests measure an individual’s level of skill, accomplishments or knowledge in a specific area. In essence, achievement tests are tied to specific content domains, subject area or field. It ascertains student’s current level of knowledge and skill acquisition. It reveals students present level of attainment after training or instruction. As already pointed out about tests, achievement test could be of different types and can equally be based on different subject matters. However, in order to provide a valid source of comparing an individuals or groups relative performance in different areas, there is need to go beyond the classroom teacher-made tests. There is the need to provide norms. Thus the present study is focused on the construction and standardization of mathematics achievement test.
Standardized Achievement Tests: Meaning, uses and Types
Standardized tests are “evaluative devices developed to ascertain a sample of behaviour from an individual in a domain of interest in which the test administration and scoring process is uniform across individuals and both reliability and validity evidence exists such that inferences regarding the person’s trait can be made from the test score [9]. Thorndike [10], specified that the term standardized tests implies the availability of normative data (although the term basically points to the adoption of uniform administration procedures) (p. 339). Basically standardized achievement tests are designed and prepared by or with the assistance of measurement experts for large number of students. It is accompanied with a manual. They are administered under uniform procedures. They are scored and interpreted in a standard and consistent manner such that comparism of individual or groups of students become realizable, [11,12,13,14].
According to Thorndike [10], standardized achievement tests are used for diagnostic and remedial decisions, placement decisions, guidance and counseling decisions, selection decisions, curricular decisions between alternative programs and public policy decisions on how well a school is doing. The Great Schools Partnership [14] equally believed that to bring reformations in schools and improvement of students achievement, standardized tests serves some of these purposes:
They make schools and educators accountable for educational results and students performance
They determine whether students achieved instructional objectives
They discover gaps in students learning and academic progress
They expose achievement gaps among different student groups
They determine whether educational policies are working as intended
Mehrens and Lehman [11], classified standardized achievement tests into diagnostic, single-subjecct matter and survey batteries. Ifeakor [13] outlined four categories which include standardized achievement survey test batteries, standardized achievement survey tests in specific subjects, diagnostic tests and prognostic tests. On the other hand, Thorndike [10], mentioned some categories of standardized achievement test and these are:- group standardized achievement test, individually administered achievement tests, secondary school and college level achievement tests, diagnostic achievement test and criterion referenced standardized achievement test. Suffice it to say that there are many more classifications, but the present paper is a single subject matter achievement test which is focused on mathematics.
Steps in Constructing Standardized Achievement Tests
Construction of standardized achievement tests follows certain developmental procedures. Most standardized achievement tests are developed by professional test publishing organizations, however the laid down procedures could be adopted by anyone constructing such a test.
The test developer should decide on the type of test needed. Other areas of decision include: the content and skills to be covered; the relative emphasis needed; the length of the test, the item format, number of subjects needed etc. Although the steps in construction will vary, depending on the nature of the test, a typical sequence would include: Planning the test, writing the items, pre-testing the items, preparing the final form, collecting reliability and validity evidence and developing norms and criteria for interpretation [15]. Okoye [12] summarized the steps in test standardization as follows generating items (which entails selecting relevant objectives, developing table of specification and finally generating items), editing items, trial testing of items, item analysis, administering the test on standardization sample, obtaining test norms, preparing test manual, printing the test and other relevant materials. Similarly Sharm and Poonam [16] outlined the following steps in the construction and standardization of achievement test in English Grammar: Planning the test, preparation of the test, administration of the test, item analysis, standardization of test like reliability, validity. The construction of the present mathematics achievement test was done through some steps as shall be discussed below.
In standardizing this achievement test, the following steps where adopted:
Preliminary Steps
The Purpose of the Test: This test will serve the purpose of measuring students’ achievement in the mathematics content areas specified.
The test developer analyzed the content area:
Test Blue Print: The table of specification at six levels of the cognitive domain was developed to specify the particular content areas covered and the number of questions for each content area and objectives
Item Writing: Based on the table of specification, 80 objective items with five options ranging from A to E were developed
Validation: Face and Content validity of the test items were determined by giving the test items, table of specification and scheme of work to subject specialists and test experts for scrutiny and vetting. Their impact was applied in drafting the final test items used for trial testing
Trial Testing: The items were administered to a sample of 300 SS1 students drawn from three Secondary schools in Anambra state and then scored
Item Analysis
In carrying out the item analysis, the difficulty index and discrimination index were determined by applying the relevant formula. Also the distracter effectiveness was also checked by recording the number of people that chose each option for both high achievers and low achievers so as to find out if there are some options that were not chosen at all. After analysis, items with discrimination index above 0.20 and a difficulty index between 0.3 and 0.7 are considered to be good items [12]. However, those items with index of discrimination between 0.20 to 0.29 are considered to be marginal items usually needing and being subject to improvement and for this study, they were dropped. Also adopting the SPSS and R statistical analysis packages, charts like simple bar charts, scatter plot and lolliplots were applied in analyzing the data.
Reliability
The split-half method was adopted in determining the reliability of the test items. The items were administered to a sample of 32 SS1 students from Anambra east local government area. Scores of even and odd items were separately done to obtain two sets of scores for each student. Product moment correlation coefficient of 0.76 was derived for the two half tests. Then Spearman-Brown prophecy formula was applied to obtain a reliability of 0.86.
Determination of Test Norm
The test norm points to the performance of a typical individual and it gives the rational for interpreting the score of any person who takes the test later. Since the test was developed for SS1 students, with no particular age specification, a class norm (mean) was determined for the scores. To determine the class norm, the items which scaled through item analysis were administered to a sample of 1000 SS1 students drawn from schools in Onitsha education zone, Anambra State. The answers were scored, summed up and a class mean calculated. This became the test norm.
Purpose of the Study
Generally, this study aimed at generating 80 items objective test and standardizing it. Specifically it determined:
The number of items allotted to the content areas in SS1 mathematics based on the six levels of the cognitive domain
The difficulty index of the 80 objective mathematics items
The discrimination index of the 80 objective mathematics items
The number of items that were good and exceeded the marginal level of acceptance
The class norm for the items exceeding the marginal level of acceptance
Research Question
The following research questions were answered:
What numbers of items are allotted to the seven content areas in SS1 objective mathematics test based on the six levels of the cognitive domain
What are the discrimination indexes of each of the 80 objective mathematics items
What are the difficulty indexes of each of the 80 objective mathematics items
How many items of the 80 objective test items had good difficulty index and exceeded the marginal level for acceptance?
What is the class norm for the items exceeding the marginal level of acceptance?
Hypothesis
There is no statistically significant relationship between the difficulty indexes of the test items and their discrimination indexes at 0.05 significant level.
The results are presented according to the research questions.
Research Question 1
What number of items is allotted to the seven content areas in SS1 objective mathematics based on the six levels of the cognitive domain.
Table 1 reveals that out of the 80 objective test items, 7 questions were allotted to set, 14 to introduction to formal geometry, 20 to statistics, 13 to indices and logarithms, 12 to fractions, decimals and percentages, 6 to numbers and numeration, 10 to quadratic equations.
Table 1: Table of Specification Showing the Number of Items Allotted to the Seven Content Areas of SS1 Objective Mathematics Test
| Contentarear | Knowledge 40% | Comprehension 20% | Application 20% | Analysis 10% | Synthesis 5% | Evaluation 5% | Total |
| SET 9% | 3 | 1 | 1 | 0 | 0 | 0 | 7 |
| Introduction to formal geometry 17% | 6 | 3 | 3 | 1 | 1 | 1 | 14 |
| Statistics 25% | 8 | 4 | 4 | 2 | 1 | 1 | 20 |
| Indices & Logarithms 16% | 5 | 3 | 2 | 1 | 1 | 1 | 13 |
| Fractions, Decimals & Percentages 15% | 5 | 2 | 2 | 1 | 1 | 1 | 12 |
| Numbers and Numeration 8% | 2 | 1 | 1 | 1 | 0 | 0 | 6 |
| Quadratic Equations 10% | 3 | 2 | 2 | 1 | 0 | 0 | 8 |
| Total | 32 | 16 | 16 | 8 | 4 | 4 | 80 |
For the six cognitive levels, the breakdown was 32 knowledge questions, 16 comprehension questions, 16 application questions, 8 analysis questions, 4 synthesis questions and 4 evaluation questions. Each of the content areas had higher number of knowledge questions, followed by comprehension, application etc.
Research Question 2
What are the discrimination indexes of the 80 objective mathematics items?
Table 2 and Figure 1 showed that 13 (16.25%) of the test items had poor discrimination, 15 (18.75%) had marginal discrimination and more than half of the test items 52(65%) had good discrimination.
Table 2: Item Analysis for 80 Items Mathematics Objective Questions for Senior Secondary 1 Students Showing the Difficulty (P) and Discrimination Index (D)
S/n | 1 | 2 | 3 | 4 | 5 | 6 | 7 | 8 | 9 | 10 | 11 | 12 | |
P | 0.68 | 0.27 | 0.37 | 0.67 | 0.63 | 0.57 | 0.70 | 0.60 | 0.48 | 0.44 | 0.4 | 0.28 | |
D | 0.12 | 0.25 | 0.10 | 0.36 | 0.32 | 0.51 | 0.36 | 0.22 | 0.27 | 0.37 | 0.15 | 0.26 | |
S/n | 13 | 14 | 15 | 16 | 17 | 18 | 19 | 20 | 21 | 22 | 23 | 24 | |
P | 0.42 | 0.21 | 0.59 | 0.31 | 0.34 | 0.30 | 0.39 | 0.48 | 0.46 | 0.33 | 0.11 | 0.59 | |
D | 0.40 | 0.20 | 0.41 | 0.33 | 0.56 | 0.36 | 0.26 | 0.17 | 0.52 | 0.23 | 0.025 | 0.58 | |
S/n | 25 | 26 | 27 | 28 | 29 | 30 | 31 | 32 | 33 | 34 | 35 | 36 | |
P | 0.018 | 0.60 | 0.48 | 0.43 | 0.30 | 0.40 | 0.33 | 0.25 | 0.061 | 0.086 | 0.056 | 0.27 | |
D | 0.037 | 0.58 | 0.51 | 0.52 | 0.35 | 0.56 | 0.32 | 0.33 | 0.049 | 0.086 | 0.11 | 0.33 | |
S/n | 37 | 38 | 39 | 40 | 41 | 42 | 43 | 44 | 45 | 46 | 47 | 48 | |
P | 0.30 | 0.41 | 0.34 | 0.20 | 0.15 | 0.31 | 0.24 | 0.38 | 0.27 | 0.20 | 0.60 | 0.105 | |
D | 0.31 | 0.37 | 0.51 | 0.36 | 0.062 | 0.53 | 0.33 | 0.46 | 0.22 | 0.35 | 0.52 | 0.21 | |
S/n | 49 | 50 | 51 | 52 | 53 | 54 | 55 | 56 | 57 | 58 | 59 | 60 | |
P | 0.47 | 0.52 | 0.33 | 0.31 | 0.60 | 0.40 | 0.53 | 0.40 | 0.15 | 0.20 | 0.043 | 0.36 | |
D | 0.64 | 0.52 | 0.41 | 0.53 | 0.63 | 0.44 | 0.67 | 0.56 | 0.25 | 0.17 | 0.086 | 0.60 | |
S/n | 61 | 62 | 63 | 64 | 65 | 66 | 67 | 68 | 69 | 70 | 71 | 72 | |
P | 0.20 | 0.35 | 0.30 | 0.30 | 0.19 | 0.52 | 0.28 | 0.32 | 0.30 | 0.25 | 0.19 | 0.30 | |
D | 0.27 | 0.32 | 0.20 | 0.21 | 0.30 | 0.75 | 0.16 | 0.47 | 0.53 | 0.41 | 0.22 | 0.41 | |
S/n | 73 | 74 | 75 | 76 | 77 | 78 | 79 | 80 | |||||
P | 0.27 | 0.25 | 0.32 | 0.25 | 0.17 | 0.31 | 0.23 | 0.20 | |||||
D | 0.41 | 0.40 | 0.49 | 0.35 | 0.27 | 0.47 | 0.42 | 0.33 | |||||
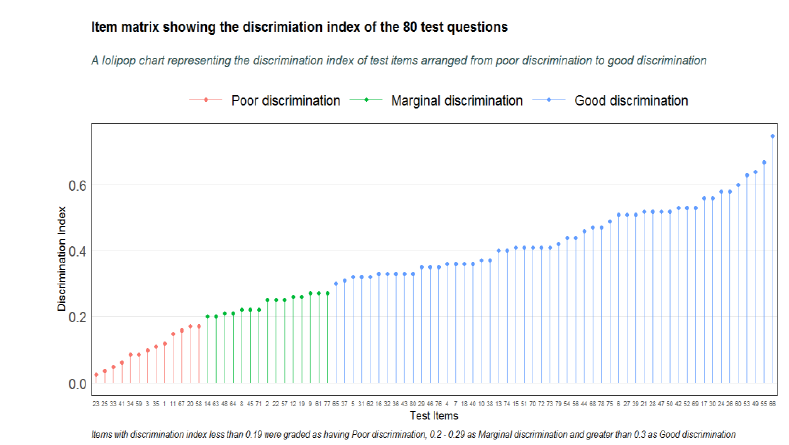
Figure 1: A Simple Bar Chart Representing the Categories of Discrimination Index of the Test Item
Items with discrimination index less than 0.19 were graded as having poor discrimination, 0.2-0.29 as marginal discrimination and 0.3 and above as good discrimination
The Lollipop chart (Figure 2) went further to identify the individual items discrimination index and arranged them in order from poor, marginal to good discrimination. The items with poor discrimination are 23,25,33,41,34,59,3,35,1,11,67,20,58 Those with marginal are 14,63,48,64,8,45,71,2,22,57,12,19,9,61,77. The rest has good discrimination.
Research Question 3
What are the difficulty indexes of the 80 objective mathematics items?
Table 2 and Figure 3 showed that 30(37.50%) of the test items were categorized as hard items because their indexes fell below 0.3. 50(62.50%) were categorized as good items because their indexes fell between 0.3 and 0.7. No item had an index above 0.7, therefore, no easy items.
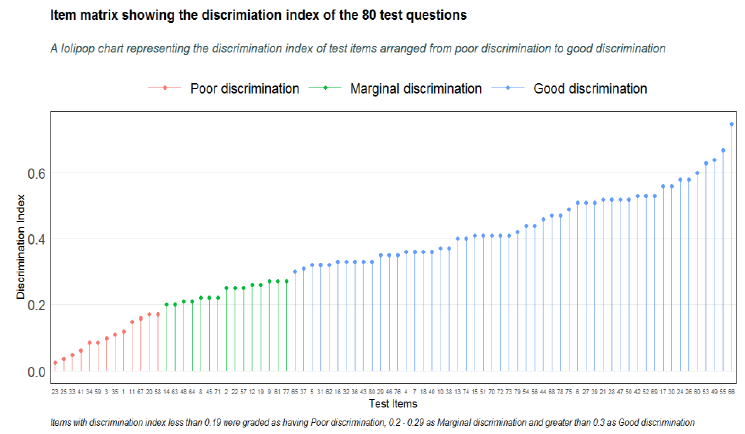
Figure 2: Item Matrix showing the discrimination index of the 80 test items
Items with discrimination index less than 0.19 were graded as having poor discrimination, 0.2-0.29 as marginal discrimination and 0.3 and above as good discrimination
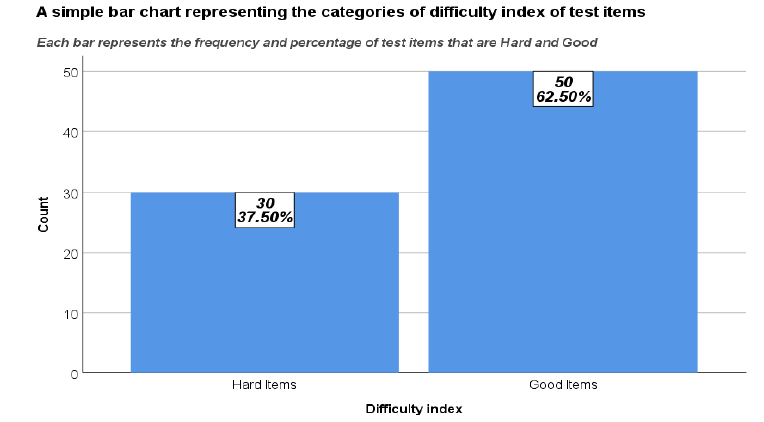
Figure 3: A Simple Bar Chart Representing the Categories of Difficulty Index of Test Items
Items with difficulty index less than 0.3 were graded as hard items, 0.3 - 0.7 as good items and greater 0.7 as easy items (0% hence not represented on the bar chart)
The lollipop chart in Figure 4 presented the individual items difficulty indexes. It arranged them in order of magnitude from hard items to good items.
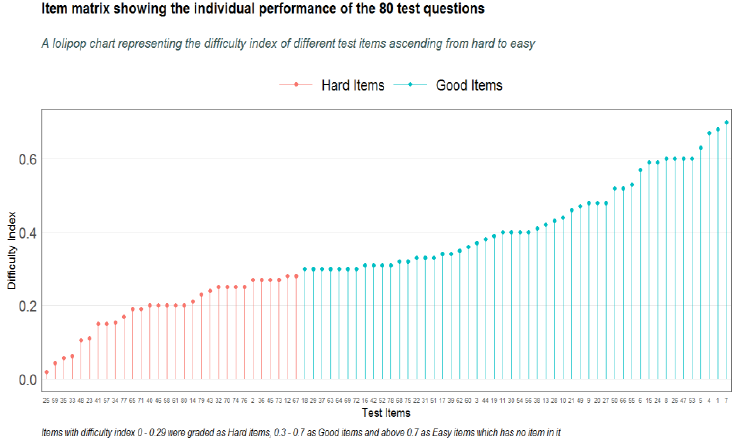
Figure 4: Item Matrix Showing the Individual Performance of the 80 Test Questions
Research Question 4
How many of the 80 objective test items had good difficulty index and exceeded the marginal level of the discrimination index.
Figure 5 , showed that there were 40(50%) test items that met the condition of being good items and having discrimination index of 0.3 and above.
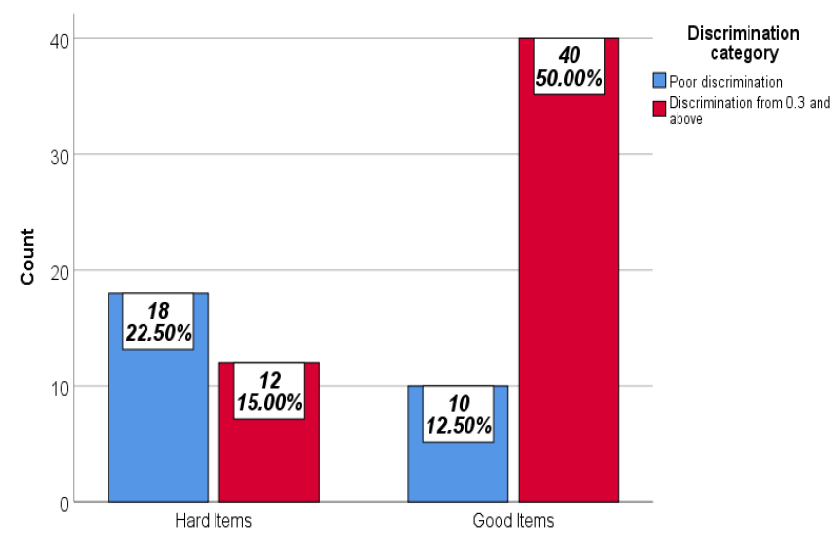
Figure 5: A Clustered Bar Chart Representing the Cross Tabulation between Discrimination and Difficulty Index
Table 3: Item Matrix Showing a Cross Tabulation between Discrimination Index and Difficulty Index
Discrimination Category | ||||
|
| Poor discrimination less than 0.9 | Marginal discrimination 0.2 to 0.29 | Good discrimination 0.3 and above |
|
| Count | Count | Count |
Difficulty | Hard items | 9 | 9 | 12 |
Good items | 4 | 6 | 40 | |
Easy items | 0 | 0 | 0 | |
Table 3 revealed that 9 items were hard with poor discrimination, 9 were hard with marginal discrimination, 12 were hard with good discrimination. 4 of the items with good difficulty index hard poor discrimination, 6 had marginal discrimination and 40 hard good discrimination. None of the items were consider as easy items. This information is clearly presented in Figure 6 which is a clustered bar chart representing the cross tabulation between discrimination index and difficulty index. The chart showed that there were 40 (50%) test items that met the condition of being good items and having discrimination index of 0.3 and above.
Hypothesis 1
There is no statistically significant linear relationship between the difficulty indexes of the test and their discrimination indexes.
Figure 6 showed there was a statistically significant mildly positive linear relationship between the difficulty indexes of test items and their discrimination indexes (R = 0.524, p<0.001). The R2 which is a measure of the effect size for the correlation is 0.274 indicating that the difficulty index can effectively predict the discriminative index only in 27.4% of cases.
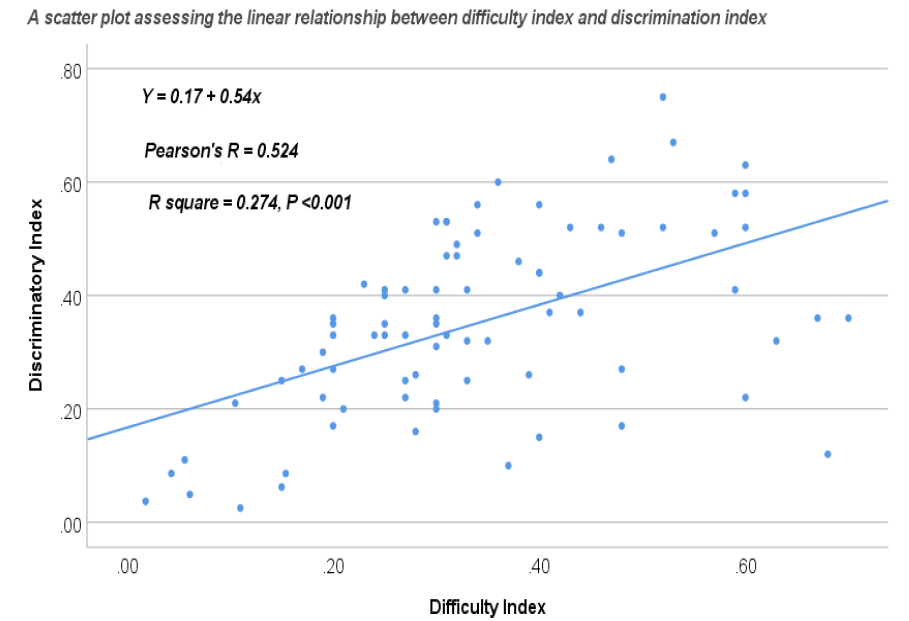
Figure 6: Pearson Correlation between Difficulty Index and Discrimination Index
Research Question 5
What is the class norm for the items exceeding the marginal level of acceptance (Table 4)?
Table 4: Frequency Table of the Scores of 1000 Students in the MAT
Scores | 5-9 | 10-14 | 15-19 | 20-24 | 25-29 | 30-34 | 35-39 |
Frequency | 21 | 108 | 233 | 236 | 225 | 149 | 28 |
Calculated mean is 22.475 ~ 22
In this study, 80 items objective questions were developed and passed through several stages for the purpose of standardization. The item analysis done from the trial testing showed that 50 (62.5%) of the items had good difficulty level, while 52(65%) possessed good discrimination. However, a cross tabulation showed that only 40(50%) of the items had both good difficulty and discrimination indexes and were therefore selected for the final instrument.
In determining the level of relationship between the difficulty index and discrimination index, Pearson R of 0.524 with an effect size R2 of 0.274 was calculated. Cohen gave rules of the thumb for interpreting this effect size which is meant to tell us exactly how large the relationship is between the two variables examined. According to him, an r of 0.1, represent a small effect size, 0.3 represents a medium effect size and 0.5 represents a large effect size. By implication, the difficulty indexes were to a mild extent good predictors of the discrimination index, thus reinforcing the positive statistically significant linear relationship between the difficulty and discrimination index.
A class mean of 22 was calculated as shown in tables above. This implies that when this test is administered to SS1 students within a time interval of 1 hour, any student who scores above 22 is above average, while those who score below 22 are below average students in mathematics for that class.
Osegbo, I.E. “Meaning of Test, Measurement and Evaluation.” In: Psychological Measurement and Evaluation in Education. I.E. Osegbo and A.C. Ifeakor, (Eds.), Onitsha: Fomech Printing & Publishing Co. Ltd., 2011.
Davis, B.G. Types of Tests-Excerpt from Quizzes, Tests and Exams. 2013. http://commons.trincoll.edu.
Ramadan, M. “8 Kinds of Testing and 6 Types of Tests.” ELT T Guide, 2014. elttguide.com/kinds-of-testing-6-types-of-tests/.
Roediger, H.L. et al. “Ten benefits of testing and their applications to educational practice.” Psychology of Learning and Motivation, vol. 55, 2011, pp. 1–36. psychology.wustl.edu/memory/wp-content/uploads/2018/04/BC_Roediger_et_al_2011_PLM.pdf.
Sheeba, S. “Importance of testing and evaluation in teaching and learning.” Importance of Testing in Teaching and Learning. International Journal of Society and Humanities, vol. 2, no. 1, 2017, pp. 1–9. researchgate.net/publication/328355159-importance-of-testing-in-teaching-and-learning.
Wu, Y.F. “Achievement Tests.” In: The Sage Encyclopedia of Educational Research, Measurement and Evaluation. B.B. Frey, (Ed.), California: Sage, 2018, p. 3680
Diksha, K. “Achievement test: Meaning and types explained.” Your Article Library, 2020. yourarticlelibrary.com/education/guidance-techniques/achievement-test-meaning-and-types-explained/63684.
Kendra, C. “How achievement tests measure what people have learned.” Verywell Mind, 2020. verywellmind.com/what-is-an-achievement-test-2794805.
Morrison, K.M. and Embretson, S.E. “Standardized Tests.” In: The Sage Encyclopedia of Educational Research, Measurement and Evaluation. B.B. Frey (Ed.), California: Sage, 2018, p. 3680.
Thorndike, R. Measurement and Evaluation in Psychology and Education. 8th ed., Essex: Pearson Education Limited, 2014.
Mehrens, W.A. and Lehmann, I.J. Measurement and Evaluation in Education and Psychology. Belmont: Holt, Rinehart and Winston, 1991.
Okoye, R.O. Educational and Psychological Measurement and Evaluation. Lagos: ED-Solid Foundation, 1996.
Ifeakor, A.C. “Standardized.” In: Psychological Measurement and Evaluation in Education. I.E. Osegbo and A.C. Ifeakor (Eds.), Onitsha: Fomech Printing & Publishing Co. Ltd., 2011.
Great Schools Partnership. “Standardized Test.” The Glossary of Education Reform, 2014. edglossary.org/standardized-test/#:~:text=A%20standardized%20test.
Denga, D.I. Educational Measurement, Continuous Assessment and Psychological Testing. Calabar: Rapid Educational Publishers, 1987.

