
+91 6002993949
submission@iarconsortium.org
Open Access
ISSN (Print) : 2709-328X
ISSN (Online) : 2709-3298
Physico-chemical and heavy metal analysis of effluent water from Port Harcourt Refinery Company Ltd. was done. Water samples were collected from the fall out (station 1), 100m away (station 2) and 200m away (station 3) and taken to the laboratory for analysis. The pH for station 1=5.0, station 2=5.5 and station 3=6.0 which is below the DPR specification. The electrical conductivity ranged from 60-75µS/cm. The TDS values of station 1 and 2 were recorded as 19mg/L and station 3 was 20mg/L. Salinity was low in all stations. The TSS was above the DPR specification at station 1 but at station 2 and 3 was within the specification of 30mg/L. BOD was high in all stations and was above the DPR specification of 10mg/L, the result ranged from 28-43mg/L. The value of COD exceeded the DPR specification of 40mg/L, the result for all stations ranged from 42-61mg/L. The level of oil and grease in station 1 and 2 were higher than the DPR specification of 10mg/L but station 3 was observed to be within. The heavy metals (Lead (Pb), Nickel (Ni), Manganese (Mn), Cadmium (Cd) and Chromium (Cr)) were estimated using Atomic Absorption Spectrophotometer. The result obtained for Pb in station 1=0.051mg/L, station 2=0.062mg/L and station 3=0.030mg/L. Ni in station 1=0.009mg/L, station 2=0.001mg/L and station 3=0.012mg/L. Mn, Cd and Cr were=0.001 in all. Pb was observed to be higher than all other heavy metals in the effluent water.
Nigeria is blessed with a vast gas and crude oil deposits and exploring it has left the country with vulnerabilities [1]. There is a strong relationship between human activities and pollution of the environment. The recognition of this connection and the need to protect human health, recreation and fisheries production led to the early development of water quality regulation and monitoring methods [2,3]. Industrial effluents, agricultural run offs, transport, burning fossils, animal and human excretes, contribute to the metal level in water bodies [4-6]. Rapid urbanization and industrialization of Port Harcourt and its environs between 1965 and 2003 created pollution potentials that are high. The rivers estuaries, creeks and air have been contaminated for decades [7]. The Port Harcourt Refinery at Alesa Eleme has a processing capacity of producing 60,000 barrels of petroleum per day of crude oil. Nigerian Crude is known to contain heavy metals in varying proportions [8]. The metallic components in crude oil are in the form of transition metal complexes, organometallic compounds, carbonyl acid salts of polar functional groups, metalloporphyrin chelates and colloidal minerals [9]. Other inorganic constituents of crude oil are Sulphur, Nitrogen, Lead, Cadmium, Chromium and Manganese [10].Discharge of some metals into natural waters at increased concentration in sewage, industrial effluents or from mining and industrial operations can have severe toxicological effects on aquatic environment and humans [11]. These environmental pollutants which are environmentally mobile tend to accumulate in organism and become persistent because of their chemical stability or poor biodegradability [12]. Heavy metals gain access into the river system from both natural and anthropogenic sources and these get distributed into the water body and sediment during the course of their transport. A catchment area containing solid minerals will usually have elevated metal level as the trace metal content of the river waters is normally controlled by the abundance of metals in the river catchment and their mobility [13]. In coastal environments, the influence of salt water intrusion is often significant. Underground water quality is dependent on pollution status of its environment [14]. The subsurface flow system of the Niger Delta is complex as the braided nature of the streams and rivers there in [15], coupled with the problems of environmental
pollution, degradation, river situation, coastal erosion as well as extermination of wildlife, fauna and flora that are of the fate of oil bearing communities in the Niger Delta region. The Port Harcourt Refinery makes it more noticeable that these problem by discharge of its untreated effluents into natural receptors (adjoining surface waters) hence the essence of this study is to ascertain the pollutant loads of water in the study area (Ekerekana creek) with a view of comparing the pollution profile of the water supply of the coastal creek areas in Port Harcourt in order to assist policy makers and regulatory agencies on policy issues.
Port Harcourt Refining Company Ltd, is an oil refinery and the problems of pollution arising at oil refinery with the main emphasis on effluent water. Oily water can accumulate from variety of process units and the immediate surroundings of tanks and pump houses plus water drained from tanks; process water and chemical draining. The nonoil containments which appear are sulphides, ammonia, organic acid, phenols, sodium chloride and other inorganic salt are likely to be present in the crude oil tankage and desalter. These compounds are toxic to aquatic organism if discharged to the sea without treatment. The physico-chemical, biological and geological characteristics of water determined gives us its usefulness for industry, domestic and agricultural uses. The study of water chemistry gives the important indications of geological history of the enclosing rock, the velocity and direction of water movement [16]. In developed countries, strict adherence to standards is maintained to ensure good and efficient pollution control. Industrial effluents are treated to very low levels of toxicity before discharge into the environment. However, in developing countries like Nigeria, there is no strict adherence to antipollution standard but with establishment of Federal Environmental Protection Agency (FEPA), there is a ray of hope. This poses a threat to human existence if not checked, since pollution effect on man are cumulative [17]. Waste water is a Refinery effluent from various units of the Refinery and passes through treatment before discharging into Ekerekena creek then into the ocean. There is a great need for proper control of waste treatment process to ensure very low toxic levels of pollution discharge into receptor environment. Water is an extraordinary substance, anomalous in nearly all of its physical-chemical properties and easily the most complex of all the familiar substances that are single chemical compounds. The physico-chemical properties of water are of great importance. Pure water has no taste, odour or turbidity. At one atmosphere of pressure pure water has the following properties; molecular weight 18.01, density of 0.998g/mol, vapour pressure of 4.58mmHg melting point of 00C, boiling point of 1000Cand heat of ionization of 55.71kg/mL. One property that makes water such a good solvent is that it is not linear but rather tetrahedral making it have a strong dipole moment. Water is never entirely 100% pure as it carries traces of other substances which bestow to its physical, chemical and bacteriological. Port Harcourt Refining Company Ltd, is an oil company which provides qualitative refining services for domestic and internal markets at competitive prices. Port Harcourt Refining Company Ltd, is a subsidiary of Nigeria National Petroleum Cooperation (NNPC) and its Nigeria’s biggest Refinery sited at Alesa Eleme, one of the suburbs of Port Harcourt in Rivers State. Contaminants such as phenol, mercaptan, sulphides, ammonia, organic compounds and inorganic salts are present in crude oil tankage and desalting. The pollution of water by industries located within urban settlements is a cause of concern in most parts of the world [18,19]. Pollution by heavy metals occurs from industries, agricultural wastes and automobile exhausts. Many of these wastes are toxic and the heavy metals found their ways to land, water and sediments. These problem is worse in developing countries where rapid urban population growth and increased industrialization has increased the hydraulic lead and complexity of effluents handled by public owned treatment work (POTW) [20,21]
STUDY AREA
The sample area for this study is indicated in the figure below. Port Harcourt Refinery Company Ltd. is located in a region of Rivers State in Nigeria with its geographic coordinates are 4o45’33”N, 7o05’53”E at Alesa-Eleme. Ekerekana is one of the towns that make up Okrika local government area of Rivers state. It is host to Nigeria’s biggest refinery and petrochemical company established in 1978, with a processing capacity of 60,000 barrels per day of crude oil. The host community that donated their land jointly for the establishment of the company was AlesaEleme in Rivers state. The surface water of the host communities receives effluents directly from the company. The area experiences tropical climate with significant rainfall in most month of the year. The average annual temperature of 250C.
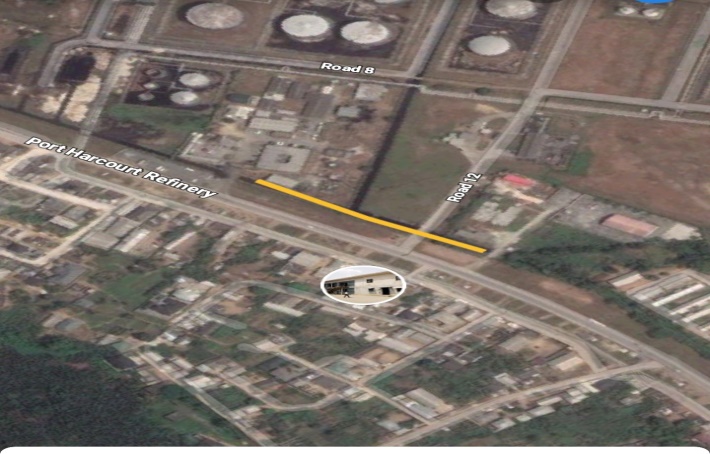
Figure1. Map showing the sample location
2.1 Collection of Samples
The samples were collected from Port Harcourt Refinery fall out on the 21st of March 2019 around 2:00pm. The samples were then transported to JachPetroanalytical Company in a cooler with ice in it to maintain the temperature of the samples.
2.2 Name of Samples
Samples were collected directly from the fall out(station 1), 100m away (station 2) and 200m away (station 3).
2.3 Heavy metals determined: Lead , Manganese , Chromium, Cadmium, Nickel
2.4 Materials and Instruments
water samples (from 3 stations), sampling bottles, spatula, weighing balance, pH meter (model HI 98107), conductivity meter (model DDS-307), digestion flask, hot plate, plastic bottles, atomic absorption spectrometer (shimadzu AAS-6300), burette, spectrophotometer (model 7000 UV spec), distillation apparatus, wash bottles, distilled water, volumetric flask, pipettes and reagents.
The method used for sampling and laboratory analysis are according to the America Standard Testing Material (ASTM), American Petroleum Institute (API) and Petroleum Institute of India (PII). The parameters monitored for toxicity levels of refinery effluents are; pH, Temperature, Electrical conductivity, Oil and grease, Total dissolved solids, Total suspended solids, Biochemical oxygen demand, Chemical oxygen demand, Cyanides, Salinity, Metals: Nickel, Lead, Manganese, Cadmium and Chromium
2.6 Parameters of Pollution Monitored in Refinery Effluent
Pollution parameters are generally used for characterizing the various forms of pollutants. The parameters are largely dependent on the sources of effluents whereas domestic sewage contains impurities. These parameters of pollution in refinery effluents can be classified under physical, chemical and microbial qualities.
2.6.1 Physical Parameters
This are generally reported in terms of temperature, colour, odour, turbidity and pH
Temperature: The temperature of the water samples monitored is in degree centigrade. The temperature of the refinery wastewater in warm climate is slightly lower than air temperature during most of the year and it has effect on microbial activities.
pH: This is the negative logarithms base 10 of hydrogen ion concentration(pH=-log10[H+]). The pH of refinery wastewater was monitored with a pH meter and made sure it was accordance with the international standard before being discharged.
Turbidity: This is caused by a variety of suspended and colloid solids. The turbidity is expressed in the form of total dissolve solids and conductivity.
Electrical conductivity and resistivity of water: The unit electrical conductivity is Siemens per centimeter. The actual resistance of the cell Rx is measured in Ohms. The conductance 1/Rx is directly proportional to the length of the path L (cm). 1/Rx=K*A/L where K is the conductivity and expressed in millisiemens/centimeter at a specified temperature normally at 25oC.
Electrical Resistivity: Resistance in Ohms measured between opposite faces of centimeter cube of an aqueous solution at specified temperature[Rx=R*L/A]. The values are usually expressed in Ohm centimeter at a specified temperature of 25oC.
2.6.2 Chemical Pollution Parameters
In refinery waste, there are mainly organic and inorganic constituents including fat and grease. The constituents are stable and decomposed slowly by microorganisms. Organic constituents are monitored by Biochemical oxygen demand(BOD) and Chemical oxygen demand(COD), phenolic compounds and cyanides. Inorganic parameters are acidity and alkalinity, chloride, phosphate, ammonia and heavy metals. All these are monitored to make sure that they are within FEPA specifications before they are discharged into sea.
2.7 Laboratory Analysis
2.7.1 Determination of Total Suspended Solids in Water
Summary of method: The total matter is determined by evaporation of an appropriate aliquot or the particulate are separated by filtration and dried and weighed.
Method: 100mL of water samples was measured and filtered through 0.45µm filter membrane. Before filtration, the filter paper was dried in oven at 105oC and cooled in the desiccator and weighed. The particulate matter was dried and weighed.
Calculation:
Total suspended solids= ![]()
ie![]()
Result expressed in ppm or mg/L
Significance: It is important for biologically treated effluents and for many industrial wastes. The suspended matter is largely organic and thus responsible for significant proportion of the oxygen demand. Thus if discharged to steam it would consume undesirable amount of dissolved oxygen.
2.7.2 Determination of Oil and Grease
Scope: This is to determine the oil and grease in water by gravimetric method.
Procedure: 200mL of the wastewater sample was placed in 300mL separating funnel and acidified with 5mL of conc. HCl. 40mL of CCl4 was added and shaken vigorously for extraction. The pressure was always released at intervals; the 100mL beaker was dried and weighed. The CCl4 layer was filtered though a filter paper containing anhydrous sodium sulphate into a known weight 100mL beaker. The anhydrous sulphate is to remove the traces of water from oil. The beaker and the contents were placed on a hot plate in a fume cupboard evaporated to dryness. The beaker was removed and cooled in a dessicator for 30mins before reweighing.
Calculation:
Oil/grease content=![]()
ie![]()
Significance: The presence of oil and grease in domestic and industrial wastewater is of concern to the public because of its deleterious aesthetic effects and its impacts on aquatic life. Regulation and standards have been established that requires monitoring of oil and grease in wastewater. Oil and grease standard in water is 0.5ppm.
2.7.3 Determination of Phenolic Compounds by Direct Colorimetric Method
100mL of the distillate was transferred to 100mL volumetric flask or suitable aliquot diluted to 100mL. Blank was prepared with 100mL of distilled water measured into 100mL volumetric flask. 5mL of NH4OH solution was added to the 100mL distillate and adjusted the ph 9.8-10.2 with NH4OH. 2mL 0f 4-amino antipyrine and 2mL of Potassium ferric cyanide was added and mixed vigorously. The mixture was left for 15mins for colour development. The mixture was later scan at 510nm with10mm absorption cell. The colour intensity is proportional to the amount of the phenolic compounds present in the sample.
Calculation: Conc. from UV![]() dillutor factor
dillutor factor
=Phenol mg/L or ppm
2.7.4 Determination of Cyanide
Scope: The method covers the determination of total cyanide in water and saline water
Significance: The presence of cyanide in industrial, domestic and surface waters is of concern because of its toxicity.
Summary of methods: This is based on the decomposition of nearly all of the metalo-cyanide complexes and simple cyanides from a strongly acidified sample during a one hour reflux distillation procedure. To ensure the breakdown of the very tightly complexed iron cyanide compounds; a decomposition catalyst magnesium chloride is added to the sample before distillation. The cyanide content of the absorption solution is determined colourimetrically.
Procedure: 250mL of water sample were collected in 500mL beaker and 20mL of Zinc acetate into 500mL distillation flask and refluxed for 1hr. The distillation was collected in a 100mL cylinder containing 20mL of sodium hydroxide(0.04N)
The sodium hydroxide absorbed the cyanide and converted to sodium cyanide 10mL 0f the aliquot was collected in 50mL volumetric flask. 4mL of phosphate buffer, 2mL of chloramines T and 5mL of pyridine solution were added into the sample and development and measures with 10mm absorption cell at 578nm.
For blank monitoring, 10mL of 0.04N 9f NaOH was collected in 50mL volumetric flask and other reagents were added and scan at 578nm.
Reagents: Phosphate k buffer, anhydrous sodium, hydrogen phosphate, 3N NaH2PO4.H2O, (138g/L).
Barbatric pyridine preparation: 15g Barbaric into a 250mL volumetric flask and 75mL pyridine and mixed vigorously. 15mL of HCl was added to the mixture and cool to room temperature, then diluted to mark with distilled water and mixed until all the barbituric acid has completely dissolved.
Calculation ppm
µg/50mL=![]()
50/10=Aliquot in 50mL
100mL=Distilled collected
250g-quality of the sample
2.7.5 Determination of Chemical Oxygen Demand using Digital(COD) Meter
Scope: This method describes a procedure for the determination of the total oxidizable material in Refinery effluent and other industrial waste water
Definition: COD is the amount of oxygen consumed under prescribed test condition in the oxidation of organic matter in waste water
Outline: The COD meter is the testing set for COD measurement based on test method of industrial effluent.COD is an index of organic contamination in factory effluent which can ne measured through a simple operation by colometry titration. The PPM is digitally given on the meter.
Principle: A certain quantity of KMnO4(Potassium Permanganate)is added to a water sample and after its acid heating reaction by H2S04 the residual KMnO4 which remains without reacting to the organic matter in the water sample is made to react with Ferrous ions by electro-reduction is detected by an indicator electrode which is directly indicated on the display for COD value. Hence the amount of oxidizable material is directly proportional to KMnO4 consumed.
Reagents: H2SO4/FeNH4(SO4)2: 60g of Ammonium Ferric Sulphate into 400mL of distilled water and 5mL of concentrated sulphuric acid.
N/40 KMnO4 solution: 0.8g of KMnO4 into 1litre of distilled water and store in amber bottle.
Electrode internal solution: Dilute 3.0g KCl into 100mL distilled water.
2.7.6 Determination of Biochemical Oxygen Demand (BOD)
Definition: BOD is the oxygen consumed for biological depredation.
Summary of Method: This is a biological procedure, which attempts to stimulate the natural processes of oxidation of organic matter occurring in a river or stream. The test is carried out by suitably diluting the sample with aerated water and divides the diluted sample between two bottles.
The dissolved oxygen is determined immediately in one bottle and in the second bottle after it has been incubated as a standard temperature of 20oC for 5 days. The period of 5 days is the time at which the rare oxygen consumption would attain a minimum value under natural condition.
Many industrial effluent contain toxic metals phenolic compounds, cyanides which depress the oxidation of organic matter and reducing compound and organic compounds not early amendable to biological oxidation, thus making the BOD test unreliable.
Reagents
Seeding reagents are :
Solution A=FeCl3(0.25g/l)
B=CaCl2(27.5g/1)
C=MgSO4(22.5g/1)
D=K2HPO4(21.75G/1)
KH2PO4(8.5G/1)
Na2HPO4(44.6g/l)
NH4Cl(1.7g/l)
MnSO4(240g/500mL) (solution 1)
KOH 350g, Kl 75g, NaN3 10g/500mL (solution 2)
Na2S2O3.5H2O 6.205g/L
KlO3 3.567g/L
Arrow starch
Procedure: Seeding water was prepared by collecting 5000mL of distilled water and 1% of treated Biodisk water sample added. 5mL of the solution A, 4mL of B, 5mL of C and 5mL of solution D were added to the 5000mL distilled water and aerated for 1hr.
About 3 BOD bottles were used and various dilutions were used for the samples with the seeding water, in each of the bottles containing both samples and seeding water. 1mL of Manganese Sulphate was added to convert the oxygen present at Manganese (iv) oxide and 1ml of (KOH, KI and NaN3) solution was also added to precipitate the sample Manganese hydroxide.
The excess oxygen liberated was then titrated with 0.025N of Na2S2O3 with starch solution as indicator.
Calculation: BOD is calculated as Dissolved Oxygen
Dissolved Oxygen=![]()
BOD=![]() )
)
Where T=Titre value of Na2S2O3
Factor for BOD
20mlLof 1/40N KIO3+5mL of (1:5H2SO4) +Starch solution. Keep in dark for 5mins
Titrate the solution with 1/40N Na2S2O3
N1V1=N2V2
0.025g KIO3×20=0.025g Na2S2O3×V2 Na2S2O3
Factor=20/V2=![]()
For example
To calculate for BOD of an observation pond
Dissolved oxygen=![]()
2.7.7 Determination of Heavy Metals
Scope: To determine the toxicity level of heavy metals in the effluent.
Summary of Method: The samples were digested with HCl and into solution with distilled water. The solution was scanned at various wavelengths with Atomic absorption spectrophotometer.
Procedure: The samples was digested with 5mL of concentrated HCl, some water was added and filtered to remove particles. The digested solution was transferred into a 100mL volumetric flask and filled to mark. Different metals where scanned at various wavelengths. The metals observed are: Nickel (Ni) at 248.3nm, Lead (Pb) at 217.0nm, Manganese (Mn) at 279.48nm, Cadmium (Cd) at 228.8nm and Chromium (Cr) at 357.9nm.
3.1 RESULTS
3.1.1 Presentation and Analysis of Result
| Parameter | DPR Specification | Refinery fall out (station 1) | 100m away (station 2) | 200m away (station 2) | ||
| pH | 6.5-8.5 | 5.0 | 5.5 | 6.0 | ||
| Conductivity(us/cm) | NO LIMIT | 74.9 | 71.9 | 60.4 | ||
| Temperature (0C) | 35 | 32.3 | 32.3 | 22.4 | ||
| TDS | 2000 | 19 | 19 | 20 | ||
| Chlorine (mg/L) | 250 | 21.3 | 24.85 | 14.2 | ||
| Salinity (ppt) | 600 | 0.0278 | 0.0266 | 0.0218 | ||
| TSS (mg/L) | 30 | 31.65 | 30.56 | 26.44 | ||
| BOD (mg/L) | 10 | 28.65 | 40.75 | 42.56 | ||
| COD (mg/L) | 40 | 42.55 | 59.70 | 60.79 | ||
| Phenol (mg/L) | 0.001 | 0.05 | 0.041 | 0.040 | ||
| Oil and grease (mg/L) | 10 | 13.62 | 12.72 | 10.51 | ||
| Cyanide (mg/L) | NO LIMIT | <0.001 | <0.001 | <0.001 | ||
3.1.2 Heavy Metals in Refinery Effluents
The heavy metals in Port Harcourt Refinery effluent was monitored, the findings is tabulated below.
| Parameters | DPR Specification | Refinery fall out (station 1) | 100 away (station 2) | 200 away (station 3) |
| Nickel (mg/L) | NO LIMIT | 0.009 | <0.001 | 0.012 |
| Lead (mg/L) | 0.05 | 0.051 | 0.062 | 0.030 |
| Manganese (mg/L) | NO LIMIT | <0.001 | <0.001 | <0.001 |
| Cadmium (mg/L) | NO LIMIT | <0.001 | <0.001 | <0.001 |
| Chromium (mg/L) | <0.001 | <0.001 | <0.001 | <0.001 |
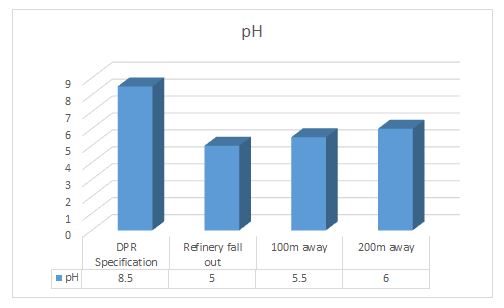
Fig 3.1 showing pH levels of the different sampled sites. Acidity was noticed to be weakening. Tending toward neutrality.
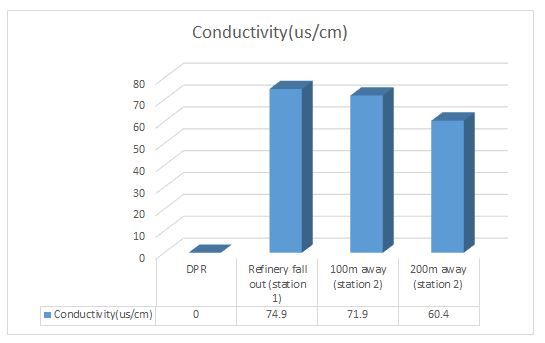
Fig 3.2 showing conductivity of the different sampling points. DPR does not have a limit.
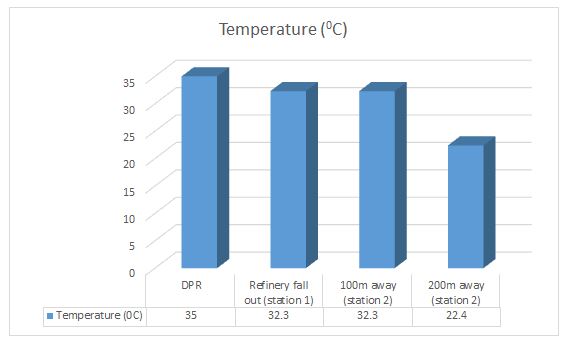
Fig 3.3 showing the temperature of the different sampled sites. Temperature was observed to decrease as you move away from refinery fall station 1 =2>3.
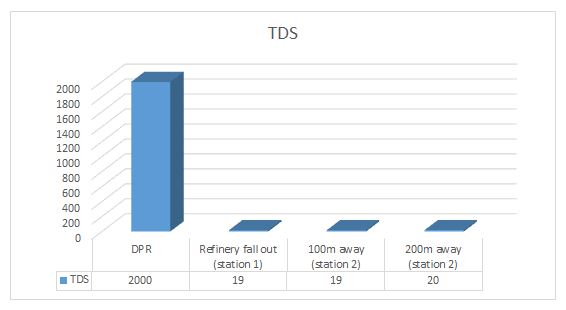
Fig 3.4 showing TDS. It was observed to be very minute/insignificant when compared with the DPR standard for all the sampling sites.
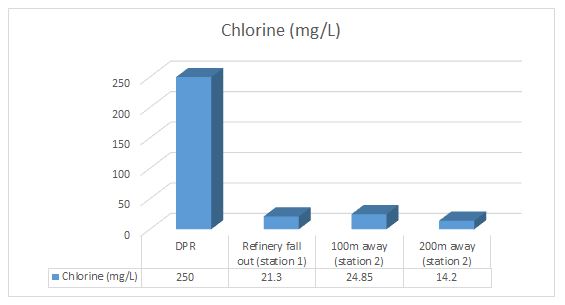
Fig 3.5 showing the chloride levels for all the sampled sites. It was found to be infinitesimal when compared to the DPR standard.
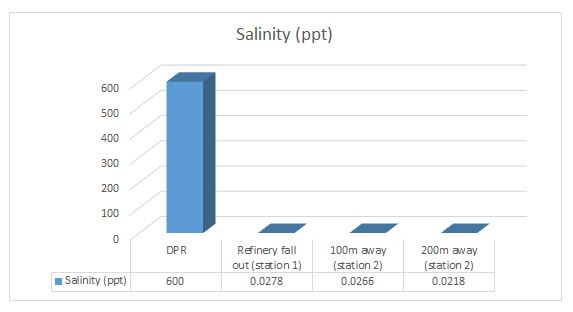
Fig 3.6 showing the salinity levels for all the sampled sites. It was found to be infinitesimal when compared to the DPR standard.
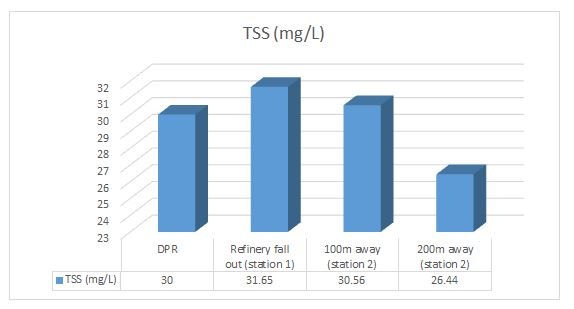
Fig 3.7 showing the TSS levels for all the sampled sites. It was found to be above in station 1 and 2 when compared to the DPR standard but lower in station 3
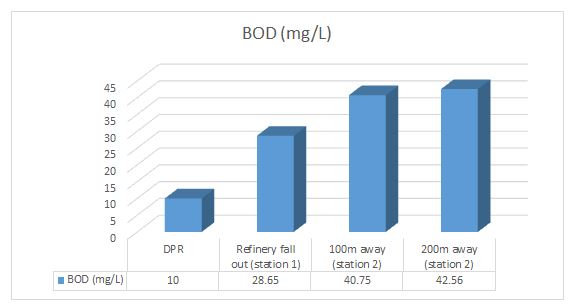
Fig 3.8 showing the BOD levels for all the sampled sites. It was found to be higher for all the sampled sites as you move further from station 1 to station 3, when compared to the DPR standard.

Fig 3.9 showing the COD levels for all the sampled sites. It was found to be higher for all the sampled sites as you move further from station 1 to station 3, when compared to the DPR standard
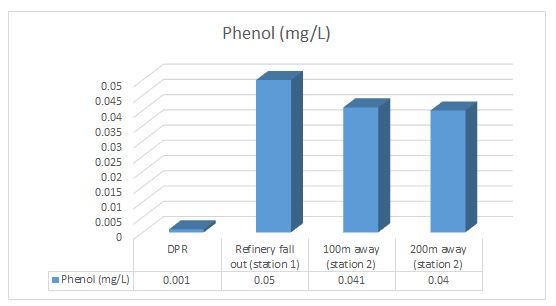
Fig 3.10 showing the phenol levels for all the sampled sites. It was found to be higher for all the sampled sites when compared to the DPR standard. As you move further from station 1 to station 3, it started reducing.
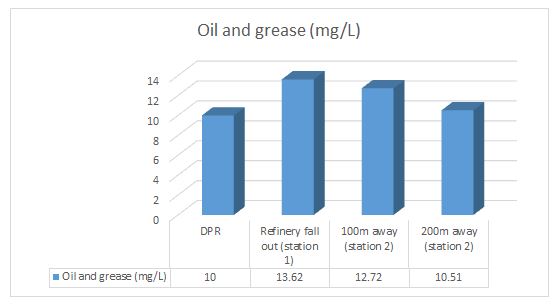
Fig 3.11 showing the oil and grease levels for all the sampled sites. It was found to be higher for all the sampled sites when compared to the DPR standard. As you move further from station 1 to station 3, oil and grease level started decreasing.
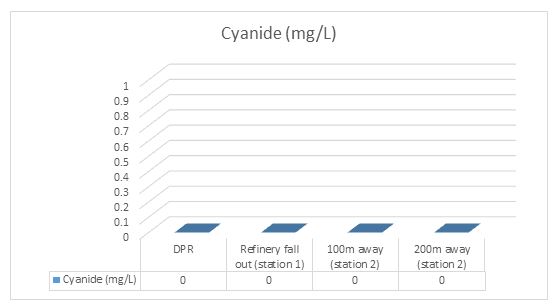
Fig 3.12 showing cyanide. It was observed to be very minute/insignificant.
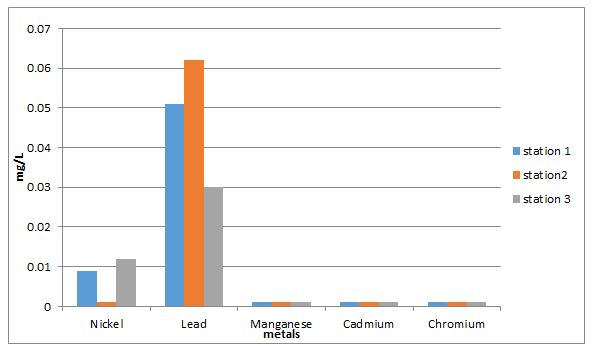
Fig 3.13 showing Heavy metals at all Stations. Lead and Nickel were observed to be high when compared with the DPR standard for all the sampled sites
The level of both the metallic and non-metallic pollutants of this study showed a range of variations. This can be attributed to the differential derivations of these inorganic pollutants from the discharge of untreated water effluents originated from industries. Heavy metals are harmful to most organisms at some level of exposure and absorption [22]
The physico-chemical properties measured in the study are pH, temperature, conductivity, TDS, chlorine, salinity, TSS, BOD, COD, phenol, oil and grease, cyanide and some heavy metals such as Nickel, Lead, Cadmium, Chromium and Manganese. The pH values were below the DPR specification of 6.5-8.5 and the pH of the samples worked on were of the range of 5.0-6-0 which is acidic; the low pH could have been as a consequence of carbon dioxide saturation. The temperature did not show variations at station 1 and station 2 but reduced at station 3. The absence of variation at station 1 and station2 is due to the fact that water has a great specific heat capacity, the response to major change in temperature is slow since water bodies must absorb vast quantities of heat in order to increase its temperature by 10oC. The implication of high temperature is that it will reduce the amount of dissolved air in water which could lead to death of aquatic organisms. The electrical conductivity reduces as the effluents move down from station 1 to station 3, from this study it observed that the sample contain appreciable amount of dissolved ions thus forming barrier for survival of organisms. There was no much significant difference in salinity measured and the salinity of each station was lower than the DPR specification, the low level of salinity indicates low amount of salt content in the sample. Oil and grease were high at station 1 and station 2 which normally receive effluent discharged from the company and station 3, was slightly above the DPR specification of 10. The study has shown high level of oil and grease in the studied areas.
The value of BOD from all stations was quite higher than the DPR specification of 10. The BOD test is useful for determining the relative waste leading to treatment of plants and the degree of oxygen demand removal provided by primary treatment, a high BOD therefore indicates the presence of large amount of organic pollution caused by microbial organisms in water and thereby increase the BOD load [23]. The value of TDS was significantly lower in all sample stations, it was observed that the TDS value had a slight difference. The TSS was higher than the TDS in all stations, station 1 and station 2 had a higher TSS value and it is above the DPR specification but at station 3, the TSS value was lower the DPR specification of 30. The heavy metals present in the water examined are in much lower concentration and doesn’t really give a cause of concern like Manganese, Cadmium and Chromium which were all at the DPR specification range. Metals like Lead and Cadmium are highly toxic and harmful to humans and other living organisms. The level of Lead is quite high in all stations and it is above the DPR specification, Lead exposure has been associated with microcytic, hypochromic anemia with basophilic stippling of erythrocytes [24]. Nickel toxicity through wastewater occurs from Nickel compound itself since Nickel is not water soluble, exposure to Nickel in wastewater is less common than airborne exposure, so it’s important to properly treat wastewater to prevent any underground contamination. Unlike organic pollutants, metals are not chemically or biologically biodegradable but may be bioconcentrated in the food chain. The process of biomagnifications or bioaccumulation is responsible for pollution indicators, the concentration of heavy metals in this study were not high, apart from Lead and Nickel but were at the range of the maximum allowable limits set by the Federal Ministry of Environment in Nigeria(FEPA).
The study revealed that there is need for improvement on the treatment of effluent by Port Harcourt Refining Company Ltd. before it is discharged into the environment. It was found that some physico-chemical parameters of the effluents been discharged into the creek is within the limit set by the Federal Ministry of Environment Nigeria while some of the parameters determined for the receiving water bodies from the sample stations is not entirely free from gross pollution and renders Ekerekana creek water unsuitable for domestic purposes. This work suggests that there are other sources of pollution besides refinery effluent that is responsible for elevated levels of some physico-chemical parameters in the studied area. This study also indicates the need for continuous study of surface water especially in areas where industries are located with high industrial activities.
The authors declare that they have no conflict of interest
No funding sources
The study was approved by the Niger Delta University P.M.B 071, Wilberforce Island, Bayelsa. Nigeria.
Nduka et al., "Effects of Effluents from Warri Refinery and Petrochemical Company (WRPC) on Water and Soil Qualities of Contiguous Host and Impact on Communities of Delta State, Nigeria," 1.1 (2009), Pp. 11-17, DOI https://doi.org/10.2174/1876397900901010011.
Daka et al., "Sediment Quality Status of Two Creeks in the Upper Bonny Estuary, Niger Delta, in Relation to Urban/Industrial Activities," 78.6 (2007), Pp. 515-521, DOI https://doi.org/10.1007/s00128-007-9090-0.
United States Environmental Protection Agency et al., "Quality Criteria for Water," 1.1 (1986), Pp. 1-2,
Altindag et al., "Assessment of Heavy Metal Concentrations in the Food Web of Lake Beysehir, Turkey," 60.4 (2005), Pp. 552-556, DOI https://doi.org/10.1016/j.chemosphere.2005.01.009.
Awofolu et al., "Levels of Trace Metals in Water and Sediment from Tyume River and Its Effects on an Irrigated Farmland," 31.1 (2005), Pp. 87-94,
Adeniyi et al., "Assessing the Speciation Pattern of Lead and Zinc in Surface Water Collected from Abegede Creek, Ijora, Lagos," 47.6 (2004), Pp. 430-434,
Egborge et al., "Water Pollution in Nigeria: Biodiversity and Chemistry of Warri River," 1.1 (1995), Pp. 1-2,
Nwadinigwe et al., "Metal Contaminants in Some Nigerian Wellhead Crudes: Comparative Analysis," 24.1 (1999), Pp. 118-121,
Lewis et al., "From Hydrocarbon to Petrochemicals," 1.1 (1981), Pp. 38-47,
Achi et al., "Analysis of Trace Metals by Wet Ashing and Spectrophotometric Techniques of Crude Oil Samples," 29.11 (2004), Pp. 11-14,
DWAF et al., "South Africa Water Quality Guidelines: Aquatic Ecosystem," 7.1 (1996), Pp. 1-2,
Emoyan et al., "Evaluation of Heavy Metals Loading of River Ijana, Nigeria," 10.2 (2005), Pp. 121-127,
Olajire et al., "A Study of the Water Quality of the Osun River: Metal Monitoring and Geochemistry," 14.1 (2000), Pp. 1-8,
Olobaniyi et al., "Characterization by Factor Analysis of the Chemical Facies of Ground Water in the Deltaic Plain Sands Aquifer of Warri, Western Niger-Delta, Nigeria," 7.1 (2006), Pp. 73-81,
Ekundayo et al., "Geoenvironmental Properties of the Ground Water Protective Soil Layers in Brass, Nigeria," 1.1 (2006), Pp. 75-84, DOI https://doi.org/10.1504/IJEWM.2006.010987.
American Public Health Association et al., "Standard Methods for the Examination of Water and Wastewater," 22.1 (2012), Pp. 1-2,
American Standard for Testing Materials et al., "Standard Methods," 1.1 (1997), Pp. 1-2,
Nyamangara et al., "Effects of Sewage and Industrial Effluent on the Concentration of Zn, Cu, Pb, and Cd in Water and Sediments Along Waterfall Streams and Lower Mukuvisi River in Harare, Zimbabwe," 33.8 (2008), Pp. 708-713, DOI https://doi.org/10.1016/j.pce.2008.06.053.
Rajaram et al., "Water Pollution by Industrial Effluents in India: Discharge Scenarios and Case of Participatory Ecosystem Specific Local Regulation," 40.1 (2008), Pp. 56-69, DOI https://doi.org/10.1016/j.futures.2007.06.011.
Oberholster et al., "Biological and Chemical Evaluation of Sewage Water Pollution in the Rietvlei Nature Reserve Wetland Area, South Africa," 156.1 (2008), Pp. 184-192, DOI https://doi.org/10.1016/j.envpol.2007.12.031.
Ntuli et al., "Designing of Sampling Programmes for Industrial Effluent Monitoring," 18.3 (2011), Pp. 479-484, DOI https://doi.org/10.1007/s11356-010-0390-6.
Chan et al., "Assessment of Dietary Exposure to Trace Metals in Baffin Inuit Food," 103.7 (1995), Pp. 740-746, DOI https://doi.org/10.1289/ehp.95103740.
Vilia-Elena et al., "Parkinson’s Disease and Exposure to Manganese During Welding," 2.5 (2006), Pp. 106-111,
Emory et al., "Neurobehavioral Effects of Low-Level Exposure in Human Neonates," 181.1 (1999), Pp. 2-11, DOI https://doi.org/10.1016/S0002-9378(99)70431-4.
