
+91 6002993949
submission@iarconsortium.org
Open Access
ISSN (Print) : 2708-5139
ISSN (Online) : 2708-5147
This study seeks to employ sustainable manufacturing strategies to reduce the environmental impacts resulting from manufacturing processes, in addition to being one of the distinctive means of improving the performance of organizations towards the environment and protecting them from pollution in light of the depletion of resources during manufacturing processes and the resulting waste that constitutes an imminent danger that threatens their interests. The problem of the education is the degree to which there is an impact resulting from employing sustainable manufacturing strategies in reducing environmental pollution through efficient investment of resources and treatment of manufacturing waste. The study derived its importance through analyzing the correlation and impact relationships between the variables and concerns about the environment, which calls for expanding the scope of environmental practices that support manufacturing processes in an attempt to reduce their negative effects. In order to achieve the objectives of the education, a questionnaire was accepted that included (75) workers from various departments of the Al-Diwaniyah Exhausts Factory and according to the determination of the study, two main hypotheses were expressed in light of it and in order to verify the validity of the hypotheses, a set of arithmetical methods were used finished the arithmetical program (SPSS&AMOS.vr.24). The results of study designate the reality of a correlation and an impact relationship between the study variables and that these strategies work to preserve the environment, reduce waste of resources and are an important entry point for achieving environmental sustainability.
In light of the growing pressures on the environment as a result of the rapid growth of industries and the negative effects they leave behind that represent restrictions on development, which negatively affects the achievement and strengthening of the competitive position of the industrial organization, in addition to the misuse of resources and fears of their depletion, the attention of specialists has turned to the use of maintainable manufacturing strategies in manufacturing processes to be more responsive to the requirements of reducing pollution and sustainability in performing manufacturing processes according to safe systems by providing high-quality products that are friendly to the environment and the customer alike. The quest to shift towards sustainable manufacturing requires a balance and integration between economic, environmental and social goals and the policies and practices that support them, in addition to the inevitability of exchange and sacrifice between the interests of manufacturers and society [17]. Finding a common language between manufacturing and the requirements of a safe environment has become a major concern for many contemporary organizations in their quest to achieve sustainability while maintaining profitability and productivity as strategic goals for manufacturing organizations [5]. In the context of the above, it is clear that there is a need to spread environmental awareness among industrial organizations and instill positive environmental ethics and the rational use of resources and energy in a more rational manner, to become more effective in their use based on the principle of feeling responsible towards a safe and sustainable contemporary business environment and moving towards innovation in a way that enhances the growth of the industry and increases the effectiveness and efficiency of its performance and the sustainability of its competitive position away from traditional manufacturing contexts.
The Study Hypothesis
Taking into account the research objective, the following hypotheses were conceived:
A significant association exists between the independent variable (sustainable manufacturing strategies) and the dependent variable (reduce environmental pollution)
A significant association exists between the independent variable (sustainable manufacturing strategies) and the dependent variable (reduce environmental pollution)
Statistical Methods Used
The following statistical techniques were used:
“Arithmetic Mean, Standard deviation, Variance coefficient, Relative significance, Confirmative factor analysis, Correlation analysis, Regressive analysis, T-test, F-test, Alpha-Kronbach Coefficient”.
Literature Review
First; Sustainable Manufacturing (SM): The concept of sustainable manufacturing is linked to idea of sustainable development and emerged as a result of the great reduction of available capitals during manufacturing processes and the resulting environmentally harmful pollutants, which prompted organizations to adopt new strategies and systems to protect the environment from pollution and move towards modern technologies and abandon their traditional operations, Therefore, it serves as one of the fundamental starting points for assisting the industry and deciding how to invest in and protect environmental resources in order to satisfy and draw in customers.
In order to increase profits and produce goods that last as long as possible to achieve social welfare, Saleh [19] defined it as investing environmental resources in industrial processes while lowering the risks resulting from them by utilizing modern technologies.
According to Ibrahim et al. [11], it is a philosophy that offers a new approach to producing high-quality products based on regulating environmental impacts, social welfare and economic growth through the level and type of education. It is also a comprehensive manufacturing model that can handle the environmental, social and economic challenges of the twenty-first century.
Machado, et al., [14] describes it as a process of integration that involves processes and systems that produce quality products and services using less resources, having a safer effect on workers, customers and the surrounding community and having a mitigating effect on environmental and social issues throughout entire life cycle.
As for Abubakr, [1], he sees it as a basic strategy to enhance better financial performance and meet social and environmental goals and regulations.
According to Al Shahwani [3], it is a system that produces environmentally friendly products of the required quality using non-polluting processes and systems (advanced technologies) in order to conserve energy and natural resources and control the effects of processes on the environment, society and the economy.
Mola & Ismail, [15] defined it as providing goods and services to satisfy customer needs, accelerate economic growth and curb environmental damage through technologies applied by highly educated individuals and according to strict ethical laws. Ali et al., [6] considers it as the organization's capacity to maintain the intelligent utilization of natural resources in order to achieve economic, social and environmental goals, these goals ultimately lead to a better quality of life and the preservation of the environment.
Al-Issawi & Al-Jaf, [7] defined it as the production of environmentally friendly products with a safe social impact and a beneficial economic return for the organization, through the conservation of natural resources and their rational and rational use that contributes to achieving the main goals of sustainability. Based on the above, it is one of the manufacturing systems aimed at generating a balance and integration between economic, environmental and social goals using efficient manufacturing techniques and methods in order to control the optimal investment of resources and produce with the least possible environmental impact through recycling and manufacturing.
Principles of the Sustainable Manufacturing
A set of standards or principles that are followed by industrial organizations in order to convert the sustainable development policy into processes that have the purpose of improving the performance of the organization from a technical perspective and (Hussain & Jahanzaib, 2018:240) see that they include:
Using less of both energy and materials
Using alternative energy
Using fewer toxic chemicals and hazardous materials
Closing the reserve flow path
Designing products that can be repeatedly used or remanufactured and that eat less vigor while in use
Advantages of the Sustainable Manufacturing Al-Shabasi, [8] sees that there are many advantages, most of which are directed towards increasing the efficiency of environmental management, the most important of which are: [2].
Increase productivity
Reduce operating costs
Improve and raise the level of production technology
Protect workers, citizens and the environment
Avoid legal accountability and improve the organization's image
Provide additional financial returns for the project
Increase export opportunities
Importance of the Sustainable Manufacturing
Sustainable manufacturing has attracted the attention of many business professionals to the point that sustainability practices in manufacturing have become an important issue. Many organizations have even addressed the application of sustainable practices in many areas such as competitive positioning, customer relations, product quality, supply chain management, cost management, strategic planning, material selection and growth. These are long-term benefits that directly affect the sustainability of the organization’s success, increase the effectiveness and efficiency of business performance and establish and sustain a global competitive position in manufacturing practices [9] Al Shahwani,[3] believes that the importance of sustainable manufacturing lies in:
Focus on how the product is made through inputs, manufacturing processes and product design
entails manufacturing goods that are recyclable, reusable, remanufactured and redesigned while using less energy and materials, producing less waste and using fewer hazardous materials
From small-scale process enhancements to significant investments in new technologies and product redesign, sustainable manufacturing practices can take many forms
Objectives of Sustainable Manufacturing
Al-Hamdani & Al-Saray, [5] pointed out a set of goals that organizations can achieve by adopting the philosophy of sustainable manufacturing, which are:
Reducing waste and reusing or recycling industrial waste
Using resources efficiently
Improving environmental performance
Applying lean manufacturing and other sustainable engineering techniques
Improving working conditions and continuous improvement of manufacturing quality
Using best practices in mechanization
Training all employees on sustainable practices
Strategies of the Sustainable Manufacturing
Sustainable manufacturing strategies aim to reduce environmental impact and increase social responsibility. They are of great importance to manufacturing organizations in order to improve their operational performance and use their manufacturing efficiency as a source of competitive advantage Taischa et al., [20]. Despite the differences in researcherss’ views on these strategies, they agreed on some of the most common strategies: [3]
Recycling (Rec)
Remanufacturing (Rem)
Redesigning (Redes)
Reuse (Rru)
Reduce (Red)
Recovering (Recov)
Second: Environmental Pollution (EPO)
Environmental pollution is one of the greatest dangers threatening the human race in terms of diseases that can affect his life, whether organic, social or psychological, which has increased the demand to live in a natural environment free of all forms of pollution.
Khanfar, [13] defined it as the damages that affect the ecosystem and reduce its ability to provide a healthy life from the physical, psychological, social and moral aspects for humans. These damages usually result from human behavior in his quest to maximize his material satisfaction with the least possible effort, which makes him intensify his intrusion on his environment as a source of material resources and waste and as a container for dumping his waste and waste and waste in it environmentally.
Jaloul & Mabdou, [12] indicate that it is the unwanted changes through direct and indirect effects in changing the form of energy, radiation levels and the chemical and physical environment of the living organism.
Saadoun, [18] states that any alteration of the environmental components that is quantitative or qualitative and that ecosystems cannot comfortably absorb, will lead to a disruption of the equilibrium, regardless of the nature or part of the system. If this occurs, there are risks to the health of the system as a whole or to the individual.
The researchers believes that it is the degree of change that affects the environment, impacts its nature and original characteristics and causes harm to it.
Sources of Environmental Pollution
Al-Damanhouri, [4] indicated that the sources of environmental pollution are:
Natural pollutants resulting from the components of the environment itself without human intervention, such as gases resulting from volcanoes, salts in water, dust particles, or they may be natural phenomena such as heat and radiation
Technological and industrial pollutants that are formed as a result of the technologies that humans have developed in the environment and the discoveries they have innovated, as well as those resulting from various industries, nuclear explosions and means of transportation (radiation from communication towers and the Internet)
Human and animal pollutants, which are the waste that humans produce as a result of their daily activities, such as pollutants resulting from cities and residential complexes, as well as animal waste
Types of Environmental Pollution
Mustafa, [16] referred to the types of environmental pollution as follows:
Air pollution, which is the most dangerous type of pollution and its most important sources are smoke, gases and emissions left by electric generators, factories and car exhausts
Water pollution with organic and chemical materials
Soil pollution, where harmful changes occur in the natural composition of the soil due to the influence of physical, chemical and biological factors, whether the change is natural or industrial
Radioactive pollution resulting from wars, which needs to be treated with advanced technologies, in addition to the radiation of communication towers and the Internet as a source accompanying technological development
Noise pollution, which indirectly affects the national economy by weakening the daily productivity of the worker
After completing the questionnaire design, it was distributed to a sample of (86) respondents, where (75) valid questionnaires were retrieved for analysis and (11) invalid questionnaires were retrieved for analysis due to either lack of information or failure to return it by the respondent. The researchers converted the answers into numbers so that we could deal with them statistically using the statistical program (SPSS vr.24) and the statistical program (AMOS vr.24). For the statistical methods and techniques employed here, the researchers relied on descriptive statistics that represented the frequency of occurrence of the various things, as well as their respective ratios, means and variances. Additionally, the researchers employed analytical statistics that represented the correlation and regression of the variables in question.
Questionnaire Reliability and Validity
Questionnaire reliability is an essential element in the scientific research process and refers to the extent of stability and reliability of questionnaire results when the measurement is repeated under similar conditions. One common method for assessing questionnaire reliability is the use of Cronbach's alpha coefficient, which is a statistical measure that measures the consistency of questions within a questionnaire. Cronbach's alpha coefficient is an important tool for ensuring the quality of questionnaires, which contributes to achieving reliable and replicable research results. The following table includes the values of Cronbach's alpha coefficient for each of research axes:
The results of the Cronbach's alpha values in table above are close to one, which indicates the reliability and cogency of the questionnaire rummage-sale by researchers. In other words, the results of the Cronbach's alpha coefficient are considered good based on the values we obtained and indicate a high degree of reliability and that the questions are well aligned with each other and measure the intended dimension reliably.
Frequencies and Percentages of Questionnaire Items
Frequencies show the number of times respondents choose a particular answer and can therefore reveal patterns and trends in the data. Ratios show the percentages of these frequencies relative to the total number of participants, which helps in understanding and giving a clearer picture of the distribution of opinions. Frequencies and ratios allow researchers to gain a deeper understanding of the data extracted from questionnaires and contribute to an accurate and comprehensive analysis of the results. The researchers have created the following table that includes the results of the frequencies and their ratios for the (SSM) axis items (Table 2).
Through the results of the table, we notice that most of the paragraphs tend towards AGREE approval. The following graph was drawn to show the fractions of answers to the scale for dimensions of (SSM) axis (Figure 1).
The researchers also created the subsequent table, which includes the results of the recurrences and their proportions for the sections of (EPO) axis (Table 3).
Through the results of the table, we notice that most of the paragraphs tend towards AGREE approval. The following graph was drawn to show the percentages of responses to the scale for the dimensions of (EPO) axis
General Statistics for Questionnaire Items (Figure 2).
Descriptive statistics results such as the arithmetic mean, standard deviation and coefficient of variation are essential tools for analyzing data in questionnaires. Each of these statistics plays an important role in understanding and interpreting data. The arithmetic mean gives an idea of the average value of the data set, which helps in understanding the general trend or rate chosen by the majority of participants. The standard deviation shows the extent of variability or diversity of answers around the arithmetic mean. The larger the standard deviation, the larger the variability in data, which indicates a greater diversity of opinions and thus can reflect the extent of stability or instability of responses, which helps in assessing the extent of agreement or variance of participants in their answers. The coefficient of variation expresses the ratio of the standard deviation to the arithmetic mean, as it helps in understanding the relative stability of the data compared to the average value, which provides evidence of the extent of stability or inconsistency of the data in relation to the rate. The researchers originate the general figures for the paragraphs of (SSM) axis dimensions and included them in the table 4.
From the results of previous table, it is strong that direction of answers is mostly towards agreement, while the low values of the standard deviations and coefficients of variation indicate homogeneity of the sample answers. The following graph represents a drawing of the values of the coefficients of difference for the sections of the (SSM) axis (Figure 3).
The researchers also found the overall statistics for paragraphs of (EPO) axis and included them in the table 5.
The results of the table show that the direction of the answers is mostly towards agreement, while the low values of the standard deviations and coefficients of variation indicate homogeneity of the sample answers, but to a lesser extent than homogeneity in the (SSM) axis. The following graph represents a drawing of the values of the coefficients of variation for the paragraphs of the (EPO) axis (Figure 4).
Confirmatory Factor Analysis of Questionnaire Axes Here, the researchers designed a structural modeling scheme capable of determining whether the paragraphs are able to explain their dimensions, where confirmatory
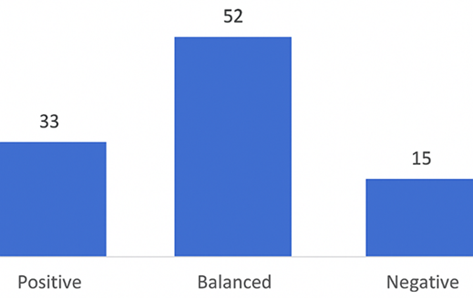
Figure (1. a, b, c, d): Percentages of responses for each scale for dimension items.
Table No 1: Cronbach's alpha coefficients
| Items | Items | Cronbach's Alpha |
| Rec | 4 | 0.81 |
| Rem | 4 | 0.84 |
| Redes | 4 | 0.90 |
| Reu | 4 | 0.85 |
| Red | 4 | 0.80 |
| Recov | 4 | 0.81 |
| SSM | 24 | 0.94 |
| EPO | 24 | 0.96 |
| All Items | 48 | 0.97 |
Table No 2: Frequencies and percentages of the (SSM) axis items
| item | strongly disagree | disagree | neutral | agree | strongly agree | item | strongly disagree | disagree | neutral | agree | strongly agree | |
| Frequency | Rec1 | 0 | 17 | 0 | 34 | 24 | Reu1 | 0 | 9 | 10 | 24 | 32 |
| Percent | 0 | 22.7 | 0 | 45.3 | 32.0 | 0 | 12.0 | 13.3 | 32.0 | 42.7 | ||
| Frequency | Rec2 | 0 | 19 | 0 | 44 | 12 | Reu2 | 0 | 2 | 10 | 50 | 13 |
| Percent | 0 | 25.3 | 0 | 58.7 | 16.0 | 0 | 2.7 | 13.3 | 66.7 | 17.3 | ||
| Frequency | Rec3 | 0 | 7 | 9 | 33 | 26 | Reu3 | 0 | 5 | 0 | 41 | 29 |
| Percent | 0 | 9.3 | 12.0 | 44.0 | 34.7 | 0 | 6.7 | 0 | 54.7 | 38.7 | ||
| Frequency | Rec4 | 0 | 16 | 6 | 23 | 30 | Reu4 | 4 | 1 | 5 | 53 | 12 |
| Percent | 0 | 21.3 | 8.0 | 30.7 | 40.0 | 5.3 | 1.3 | 6.7 | 70.7 | 16.0 | ||
| Frequency | Rec | 0 | 59 | 15 | 134 | 92 | Reu | 4 | 17 | 25 | 168 | 86 |
| Percent | 0 | 20 | 5 | 45 | 30 | 1 | 6 | 8 | 56 | 29 | ||
| Frequency | Rem1 | 0 | 33 | 0 | 17 | 25 | Red1 | 0 | 6 | 0 | 51 | 18 |
| Percent | 0 | 44.0 | 0 | 22.7 | 33.3 | 0 | 8.0 | 0 | 68.0 | 24.0 | ||
| Frequency | Rem2 | 0 | 16 | 0 | 29 | 30 | Red2 | 0 | 5 | 5 | 38 | 27 |
| Percent | 0 | 21.3 | 0 | 38.7 | 40.0 | 0 | 6.7 | 6.7 | 50.7 | 36.0 | ||
| Frequency | Rem3 | 0 | 17 | 13 | 29 | 16 | Red3 | 3 | 7 | 7 | 38 | 20 |
| Percent | 0 | 22.7 | 17.3 | 38.7 | 21.3 | 4.0 | 9.3 | 9.3 | 50.7 | 26.7 | ||
| Frequency | Rem4 | 0 | 25 | 9 | 10 | 31 | Red4 | 8 | 3 | 7 | 39 | 18 |
| Percent | 0 | 33.3 | 12.0 | 13.3 | 41.3 | 10.7 | 4.0 | 9.3 | 52.0 | 24.0 | ||
| Frequency | Rem | 0 | 91 | 22 | 85 | 102 | Red | 11 | 21 | 19 | 166 | 83 |
| Percent | 0 | 30 | 8 | 28 | 34 | 4 | 7 | 6 | 55 | 28 | ||
| Frequency | Redes1 | 0 | 7 | 5 | 34 | 29 | Recov1 | 4 | 7 | 9 | 30 | 25 |
| Percent | 0 | 9.3 | 6.7 | 45.3 | 38.7 | 5.3 | 9.3 | 12.0 | 40.0 | 33.3 | ||
| Frequency | Redes2 | 5 | 11 | 6 | 39 | 14 | Recov2 | 3 | 8 | 10 | 33 | 21 |
| Percent | 6.7 | 14.7 | 8.0 | 52.0 | 18.7 | 4.0 | 10.7 | 13.3 | 44.0 | 28.0 | ||
| Frequency | Redes3 | 0 | 18 | 9 | 36 | 12 | Recov3 | 4 | 13 | 7 | 29 | 22 |
| Percent | 0 | 24.0 | 12.0 | 48.0 | 16.0 | 5.3 | 17.3 | 9.3 | 38.7 | 29.3 | ||
| Frequency | Redes4 | 0 | 24 | 5 | 26 | 20 | Recov4 | 2 | 20 | 2 | 27 | 24 |
| Percent | 0 | 32.0 | 6.7 | 34.7 | 26.7 | 2.7 | 26.7 | 2.7 | 36.0 | 32.0 | ||
| Frequency | Redes | 5 | 60 | 25 | 135 | 75 | Recov | 13 | 48 | 28 | 119 | 92 |
| Percent | 2 | 20 | 8 | 45 | 25 | 4 | 16 | 9 | 40 | 31 |
Figure 2: shows the percentages of responses for each scale for the axis items.
Table No 3: Frequencies and percentages of the (EPO) axis items
| item | strongly disagree | disagree | neutral | agree | strongly agree | item | strongly disagree | disagree | neutral | agree | strongly agree | |
| Frequency | EPO1 | 1 | 18 | 7 | 33 | 16 | EPO13 | 0 | 13 | 0 | 37 | 25 |
| Percent | 1.3 | 24.0 | 9.3 | 44.0 | 21.3 | 0 | 17.3 | 0 | 49.3 | 33.3 | ||
| Frequency | EPO2 | 7 | 8 | 10 | 36 | 14 | EPO14 | 0 | 18 | 4 | 24 | 29 |
| Percent | 9.3 | 10.7 | 13.3 | 48.0 | 18.7 | 0 | 24.0 | 5.3 | 32.0 | 38.7 | ||
| Frequency | EPO3 | 22 | 2 | 16 | 26 | 9 | EPO15 | 0 | 18 | 8 | 22 | 27 |
| Percent | 29.3 | 2.7 | 21.3 | 34.7 | 12.0 | 0 | 24.0 | 10.7 | 29.3 | 36.0 | ||
| Frequency | EPO4 | 0 | 23 | 7 | 36 | 9 | EPO16 | 0 | 14 | 8 | 22 | 31 |
| Percent | 0 | 30.7 | 9.3 | 48.0 | 12.0 | 0 | 18.7 | 10.7 | 29.3 | 41.3 | ||
| Frequency | EPO5 | 13 | 4 | 3 | 44 | 11 | EPO17 | 0 | 11 | 1 | 24 | 39 |
| Percent | 17.3 | 5.3 | 4.0 | 58.7 | 14.7 | 0 | 14.7 | 1.3 | 32.0 | 52.0 | ||
| Frequency | EPO6 | 3 | 18 | 2 | 45 | 7 | EPO18 | 0 | 10 | 0 | 26 | 39 |
| Percent | 4.0 | 24.0 | 2.7 | 60.0 | 9.3 | 0 | 13.3 | 0 | 34.7 | 52.0 | ||
| Frequency | EPO7 | 2 | 9 | 3 | 34 | 27 | EPO19 | 0 | 11 | 8 | 29 | 27 |
| Percent | 2.7 | 12.0 | 4.0 | 45.3 | 36.0 | 0 | 14.7 | 10.7 | 38.7 | 36.0 | ||
| Frequency | EPO8 | 0 | 26 | 5 | 27 | 17 | EPO20 | 7 | 5 | 4 | 35 | 24 |
| Percent | 0 | 34.7 | 6.7 | 36.0 | 22.7 | 9.3 | 6.7 | 5.3 | 46.7 | 32.0 | ||
| Frequency | EPO9 | 0 | 15 | 0 | 38 | 22 | EPO21 | 7 | 10 | 4 | 28 | 26 |
| Percent | 0 | 20.0 | 0 | 50.7 | 29.3 | 9.3 | 13.3 | 5.3 | 37.3 | 34.7 | ||
| Frequency | EPO10 | 0 | 14 | 4 | 31 | 26 | EPO22 | 1 | 22 | 5 | 35 | 12 |
| Percent | 0 | 18.7 | 5.3 | 41.3 | 34.7 | 1.3 | 29.3 | 6.7 | 46.7 | 16.0 | ||
| Frequency | EPO11 | 0 | 24 | 4 | 31 | 16 | EPO23 | 0 | 17 | 8 | 31 | 19 |
| Percent | 0 | 32.0 | 5.3 | 41.3 | 21.3 | 0 | 22.7 | 10.7 | 41.3 | 25.3 | ||
| Frequency | EPO12 | 0 | 22 | 4 | 22 | 27 | EPO24 | 11 | 10 | 4 | 45 | 5 |
| Percent | 0 | 29.3 | 5.3 | 29.3 | 36.0 | 14.7 | 13.3 | 5.3 | 60.0 | 6.7 | ||
| 74 | EPO | 342 | 119 | 761 | 504 | |||||||
| 4 | 19 | 7 | 42 | 28 |
Table No 4: General Statistics for the (SSM) axis Paragraphs
| item | Mean | Std. Deviation | cv | item | Mean | Std. Deviation | Cv |
| Rec1 | 3.87 | 1.107 | 29 | Reu1 | 4.05 | 1.025 | 25 |
| Rec2 | 3.65 | 1.033 | 28 | Reu2 | 3.99 | 0.647 | 16 |
| Rec3 | 4.04 | 0.922 | 23 | Reu3 | 4.25 | 0.773 | 18 |
| Rec4 | 3.89 | 1.158 | 30 | Reu4 | 3.91 | 0.873 | 22 |
| Rec | 3.86 | 0.846 | 22 | Reu | 4.05 | 0.696 | 17 |
| Rem1 | 3.45 | 1.349 | 39 | Red1 | 4.08 | 0.749 | 18 |
| Rem2 | 3.97 | 1.127 | 28 | Red2 | 4.16 | 0.823 | 20 |
| Rem3 | 3.59 | 1.067 | 30 | Red3 | 3.87 | 1.044 | 27 |
| Rem4 | 3.63 | 1.323 | 36 | Red4 | 3.75 | 1.187 | 32 |
| Rem | 3.66 | 1.004 | 27 | Red | 3.96 | 0.694 | 18 |
| Redes1 | 4.13 | 0.905 | 22 | Recov1 | 3.87 | 1.143 | 30 |
| Redes2 | 3.61 | 1.150 | 32 | Recov2 | 3.81 | 1.087 | 28 |
| Redes3 | 3.56 | 1.030 | 29 | Recov3 | 3.69 | 1.219 | 33 |
| Redes4 | 3.56 | 1.200 | 34 | Recov4 | 3.68 | 1.254 | 34 |
| Redes | 3.71 | 0.949 | 26 | Recov | 3.76 | 0.943 | 25 |
Table No 5: General statistics for the paragraphs of the (EPO) axis
| item | Mean | Std. Deviation | cv | Item | Mean | Std. Deviation | Cv |
| EPO1 | 3.60 | 1.115 | 31 | EPO13 | 3.99 | 1.020 | 26 |
| EPO2 | 3.56 | 1.188 | 33 | EPO14 | 3.85 | 1.182 | 31 |
| EPO3 | 2.97 | 1.433 | 48 | EPO15 | 3.77 | 1.181 | 31 |
| EPO4 | 3.41 | 1.054 | 31 | EPO16 | 3.93 | 1.131 | 29 |
| EPO5 | 3.48 | 1.309 | 38 | EPO17 | 4.21 | 1.044 | 25 |
| EPO6 | 3.47 | 1.082 | 31 | EPO18 | 4.25 | 1.001 | 24 |
| EPO7 | 4.00 | 1.065 | 27 | EPO19 | 3.96 | 1.032 | 26 |
| EPO8 | 3.47 | 1.189 | 34 | EPO20 | 3.85 | 1.216 | 32 |
| EPO9 | 3.89 | 1.047 | 27 | EPO21 | 3.75 | 1.316 | 35 |
| EPO10 | 3.92 | 1.075 | 27 | EPO22 | 3.47 | 1.119 | 32 |
| EPO11 | 3.52 | 1.155 | 33 | EPO23 | 3.69 | 1.090 | 30 |
| EPO12 | 3.72 | 1.236 | 33 | EPO24 | 3.31 | 1.230 | 37 |
| EPO | 3.7105 | 0.850 | 23 |
Table No 6: Criteria and decision to accept or reject forms
Parameter
| SSM | OP | ||||
| Parameter Value | Comparison | Decision | Parameter Value | Comparison | Decision | |
| X2(df) (sig.) | 923.571 (237) (0.000) | Sig. Less than 0.05 | Accepted | 1437.543 (252) (0.000) | Sig. Less than 0.05 | Accepted |
| CFI | 0.91 | More than 0.50 | Accepted | 0.91 | More than 0.50 | Accepted |
| TLI | 0.85 | More than 0.50 | Accepted | 0.86 | More than 0.50 | Accepted |
| RMSEA | 0.00 | Less than 0.05 | Accepted | 0.00 | Less than 0.08 | Accepted |
Table No 7: Standard regression weights for each paragraph
| Estimate | Estimate | Estimate | Estimate | |||||||||||||
| Rec1 | <-- | Rec. | .783 | Reu1 | <--- | Reu. | .797 | EPO1 | <-- | EPO. | .633 | EPO13 | <-- | EPO. | .722 | |
| Rec2 | <-- | Rec. | .367 | Reu2 | <--- | Reu. | .640 | EPO2 | <-- | EPO. | .532 | EPO14 | <-- | EPO. | .950 | |
| Rec3 | <-- | Rec. | .944 | Reu3 | <--- | Reu. | .849 | EPO3 | <-- | EPO. | .589 | EPO15 | <-- | EPO. | .856 | |
| Rec4 | <-- | Rec. | .826 | Reu4 | <--- | Reu. | .814 | EPO4 | <-- | EPO. | .557 | EPO16 | <-- | EPO. | .936 | |
| Rem1 | <-- | Rem. | .864 | Red1 | <--- | Red. | .666 | EPO5 | <-- | EPO. | .438 | EPO17 | <-- | EPO. | .736 | |
| Rem2 | <-- | Rem. | .623 | Red2 | <--- | Red. | .760 | EPO6 | <-- | EPO. | .444 | EPO18 | <-- | EPO. | .785 | |
| Rem3 | <-- | Rem. | .592 | Red3 | <--- | Red. | .555 | EPO7 | <-- | EPO. | .350 | EPO19 | <-- | EPO. | .860 | |
| Rem4 | <-- | Rem. | .902 | Red4 | <--- | Red. | .424 | EPO8 | <-- | EPO. | .687 | EPO20 | <-- | EPO. | .764 | |
| Redes1 | <-- | Redes. | .873 | Recov1 | <--- | Recov. | .683 | EPO9 | <-- | EPO. | .749 | EPO21 | <-- | EPO. | .790 | |
| Redes2 | <-- | Redes. | .807 | Recov2 | <--- | Recov. | .847 | EPO10 | <-- | EPO. | .880 | EPO22 | <-- | EPO. | .623 | |
| Redes3 | <-- | Redes. | .840 | Recov3 | <--- | Recov. | .863 | EPO11 | <-- | EPO. | .824 | EPO23 | <-- | EPO. | .593 | |
| Redes4 | <-- | Redes. | .808 | Recov4 | <--- | Recov. | .556 | EPO12 | <-- | EPO. | .936 | EPO24 | --- | EPO. | .474 | |
Table No 8: Correlation between the two axes
| Correlations | ||||||||
| Rec | Rem | Redes | Reu | Red | Recov | SSM | ||
| EPO | Pearson Correlation | .731** | .753** | .685** | .723** | .674** | .704** | .851** |
| Sig. (2-tailed) | .000 | |||||||
| N | 75 | |||||||
Table No 9: Impact analysis results
| Dependent Variable | Predictors | R Square | F test | Sig. of F test | Standardized Regression coefficient | t test | Sig. of t test |
| EPO | SSM | .724 | 191.652 | .000 | .851 | 13.844 | .000 |
| Rec | .534 | 83.576 | .000 | .731 | 9.142 | .000 | |
| Rem | .567 | 95.524 | .000 | .753 | 9.774 | .000 | |
| Redes | .469 | 64.505 | .000 | .685 | 8.031 | .000 | |
| Reu | .522 | 79.774 | .000 | .723 | 8.932 | .000 | |
| Red | .454 | 60.726 | .000 | .674 | 7.793 | .000 | |
| Recov | .496 | 71.747 | .000 | .704 | 8.470 | .000 |
factor analysis was used for this purpose and regression weights were found for them. Furthermore, the researchers discovered the accuracy criteria of the model they had proposed. These criteria included the root mean square error of approximation (RMSEA), the TLI (Tucker-Lewis index), the CFI (comparative fit index) and the ratio of the chi square value to the degree of freedom. The following table contains the results (Table 6).
The above criteria reflected quality of model used, as it showed the suitability of model to data and its effectiveness through their high values, which are an indicator of the quality of model and its ability to explain the relationships between variables effectively. The researchers used the AMOS program to draw structural diagram of dimensions of the two research axes, as shown below (Figure 5).
We found that each dimension's various paragraphs could adequately describe the dimension to which they belonged using the standard regression weights. The typical regression weights for the two axes are shown in the following table and these weights are found on the straight lines that connect the dimension to the paragraphs (Table 7).
Correlation Test
The null hypothesis to be examined was as follows: (There is no significant association between the EPO axis and the SSM at a level of significance of 5%). In order to evaluate this hypothesis, the association values and their significance were documented and then the results were organized as follows (Table 8).
The findings show that there was a p-value of 0.084 and an association of 0.851 between the SSM and EPO axes. Since zero is less significant than five percent, the value was regarded as zero. Given the data, the alternative hypothesis—which suggests that there is a direct and significant relationship between (SSM) and (EPO) below the five percent significance level—is accepted and the null hypothesis is rejected. The p value was regarded as zero, which is less significant than 5% and the association value between the (Rec) and the (EPO) axes was (0.731). Given the data, the alternative

Figure (3) Coefficient of variation for (SSM) axis paragraphs

Figure (4) Coefficient of variation of (EPO) axis vertebrae

Figure 5: shows the structural plan of the dimensions of the two axes.

Figure 6: shows the relationships between the (SSM) axis and its dimensions and the (EPO).
hypothesis—which suggests that there is a direct and significant relationship between (Rec) and (EPO) below the five percent significance level—is accepted and the null hypothesis is rejected. (Rem) and the (EPO) axis had an association value of (0.753) and the p value was since zero is less significant than five percent, the value was regarded as zero. Given the data, the alternative hypothesis—which suggests that there is a direct and significant relationship between (Rem) and (EPO) below the five percent significance level—is accepted and the null hypothesis is rejected. The p-value was 0.000 and the association value between the (Redes) and (EPO) axes was 0.685. Since zero is less significant than five percent, the value was regarded as zero. The alternative hypothesis is accepted and the null hypothesis is rejected in light of the data, suggesting that there is a direct and significant relationship between (Redes) and (EPO) at the five percent significance level. The p-value was zero, which is less significant than 5% and the association value between the (EPO) and (Reu) axes was 0.723. The alternative hypothesis, which suggests that there is a direct and significant relationship between (Reu) and (EPO) below the five percent significance level, is accepted based on the data and the null hypothesis is rejected. The association value between the (Red) and the (EPO) axis was (0.674) and the p value was the value was considered to be zero, which is less significant than 5%. Based on the data, the null hypothesis is denied and the alternative hypothesis is admitted, which implies that there is a direct and significant association between (Red) and (EPO) below the (5%) level of significance. The association value between (Recov) and the (EPO) axis was (0.704) and the p value was the value was considered to be zero, which is less significant than 5%. Based on the data, the null hypothesis is denied and the alternative hypothesis is admitted, which implies that there is a direct and significant association between (Recov) and (EPO) below the (5%) level of significance.
Finally, the researchers drew the following figure that shows the relationships between the (SSM) axis and its dimensions and the (EPO) axis (Figure 6).
Impact of (SSM) and its dimensions in (EPO)
The researchers put forward the following null hypothesis to show the effect of (SSM) on (EPO):
H0: There is no significant effect of the (SSM) axis and its dimensions on the (EPO) axis
In contrast to the alternative hypothesis
H1: There is a significant effect of the (SSM) axis and its dimensions on the (EPO) axis
In order to test this hypothesis, it was necessary to analyze the data and find the results of the effect. These results are included in the following table 9.
The findings show that the p value was 0.084 and the correlation between the SSM and EPO axes was 0.851. Since zero is less significant than five percent, the value was regarded as zero. The alternative hypothesis, which suggests that there is a direct and significant relationship between (SSM) and (EPO) below the five percent significance level, is accepted based on the data, while the null hypothesis is rejected. The p-value was 0.731 and the association value between the (Rec) and (EPO) axes was Since zero is less significant than five percent, the value was regarded as zero. Based on the data, the alternative hypothesis—which suggests that there is a direct and significant relationship between (Rec) and (EPO) below the five percent significance level—is accepted and the null hypothesis is rejected. (Rem) and the (EPO) axis had an association value of (0.753) and the p value was Since zero is less significant than five percent, the value was regarded as zero. The alternative hypothesis, which suggests that there is a direct and significant relationship between (Rem) and (EPO) below the five percent significance level, is accepted based on the data, while the null hypothesis is rejected. The p-value was 0.000 and the association value between the (EPO) axis and (Redes) was 0.685. Since zero is less significant than five percent, the value was regarded as zero. According to the data, the alternative hypothesis is accepted and the null hypothesis is rejected, suggesting that (Redes) and (EPO) are directly and significantly correlated below the five percent significance level. The p-value was 0.723 and the association value between the (EPO) and the (Reu) axis was Since zero is less significant than five percent, the value was regarded as zero. The alternative hypothesis, which suggests that there is a direct and significant relationship between (Reu) and (EPO) below the five percent significance level, is accepted based on the data, while the null hypothesis is rejected. The (Red) and (EPO) axes had an association value of (0.674) and the p value was Since zero is less significant than five percent, the value was regarded as zero. The alternative hypothesis is accepted and the null hypothesis is rejected in light of the data, suggesting that (Red) and (EPO) are directly and significantly correlated below the five percent significance level. (Recov) and the (EPO) axis had an association value of (0.704) and the p value was Since zero is less significant than five percent, the value was regarded as zero. The alternative hypothesis is accepted and the null hypothesis is rejected in light of the data, suggesting that (Recov) and (EPO) are directly and significantly correlated below the five percent significance level.
The researchers came to some significant findings in the subject of this research, the most significant of which are The results of the Cronbach's alpha coefficient are considered significant based on the values that we obtained, which indicate a high degree of reliability, the majority of the paragraphs tend towards AGREE approval by the studied population, the trend of the answers is towards AGREE in most of them, while the low values of the standard deviation and variance of the sample's answers indicate the uniformity of the sample's responses, The accuracy of the factor analysis was reflected in the quality of the model, as it demonstrated the model's appropriateness to the data and its effectiveness via the high values of the standard regression weights, Through the standard regression process, we observed that the items belonging to each dimension were capable of describing the dimensions to which they belong, There is a direct and significant association between (SSM) and its associated dimensions and (EPO) at a significance level of (5%), A change in (SSM) of one unit results in a change in (EPO) of (0.851), A change in (Rec) of one unit results in a change in (EPO) of (0.731), A change in (Rem) of one unit results in a change in (EPO) of (0.753), A change in (Redes) of one unit results in a change in EPO of (0.685), A change in (Recov) of one unit results in a change in EPO of (0.704).
The researchers hypothesizes that the factory should have sufficient awareness of their role in protecting the environment while also avoiding damage to it, they should activate sustainable manufacturing strategies that will lead to the production of quality products, they should also choose environmentally friendly equipment sources that will enhance the factory's efforts to achieve environmental sustainability, all of this will lead to the production of quality products.
Abubakr, Mohamed, et al. "Sustainable and Smart Manufacturing: An Integrated Approach." Mechanical Design and Production Engineering Department, Cairo University, 2020.
Ajami, Mubarak Abdullah Hadi. "Integration between Sustainable Manufacturing Mechanisms and Environmental Management Accounting Methods in Order to Support Performance for Development Projects." Journal of Financial and Business Research, vol. 22, no. 3, 2021.
Al Shahwani, Alaa Abdul Wahab Abdul Salam. The Contribution of Sustainable Manufacturing Strategies to Enhancing Marketing Opportunities. Thesis Degree in Industrial Management, College of Administration and Economics, University of Mosul, 2020.
Al-Damanhouri, Hamad Saeed. Environment and Society. Dar Al-Imar Al-Ilmi, 2014.
Al-Hamdani, et al. "Handling Operational Failure within the Framework of Using the Philosophy of Sustainable Manufacturing." Tikrit University Journal of Administrative and Economic Sciences, vol. 2, no. 38, 2017.
Ali, Hazem, et al. "Sustainable Manufacturing Practices, Competitive Capabilities and Sustainable Performance: Moderating Role of Environmental Regulations." Sustainability, 2021.
Al-Issawi, et al. "The Role of Some Sustainable Manufacturing Practices in Enhancing Green Quality." Algerian Journal of Political Economy, vol. 6, no. 1, 2024.
Al-Shabasi, Mohi Sami Mohamed. “A Proposed Framework for Accounting for Cleaner Production Costs to Support Competitive Advantage in the Industrial Business Environment.” Faculty of Commerce and Business Administration, Helwan University, 2017.
Habidin, Nurul Fadly, et al. "Sustainable Manufacturing Practices in Malaysian Automotive Industry." Journal of Global Entrepreneurship Research, 2015.
Hussain, S. and M. Jahanzaib. "Sustainable Manufacturing – An Overview and a Conceptual Framework for Continuous Transformation and Competitiveness." Advances in Production Engineering & Management, vol. 13, no. 3, 2018.
Ibrahim, Y. M., et al. "Education of Sustainable Manufacturing in Curriculums: Evidence from Iraqi Colleges." 2nd International Conference on Sustainable Engineering Techniques, 2019.
Jaloul, Sabrina Qwaider and Wafaa Mabdou. “The Role of Social Networking Sites in Spreading Sustainable Environmental Pollution among University Students.” Master's thesis, Djilali Bounaama University, Faculty of Humanities and Social Sciences, 2017.
Khanfar, Ayed Radi. Environmental Pollution (Air, Water, Food). Al-Yazouri Publishing and Distribution House, 2010.
Machado, Carla Gonçalves, Mats Peter Winroth and Elias Hans Dener Ribeiro da Silva. "Sustainable Manufacturing in Industry 4.0: An Emerging Research Agenda." International Journal of Production Research, 2019.
Mola, Mohamadi Zohreh and Napsiah Ismail. "Developing a New Scheme for Sustainable Manufacturing." International Journal of Materials, Mechanics and Manufacturing, vol. 1, no. 1, 2013.
Mustafa, Adnan Yassin. Sociological Mirrors of Youth and the Environment: The Debate of Empowerment and Settlement. National Elites and Competencies Foundation for Reform, 2016.
Rosen, Marc A. and Hossam A. Kishawy. "Sustainable Manufacturing and Design: Concepts, Practices and Needs." Sustainability, 2012, www.mdpi.com.
Saadoun, Hadi Faisal. "Environmental Pollution in Iraq and Its Impact on Health and Health Security." Journal of the College of Education, vol. 24, no. 102, 2018.
Saleh, Iman Ahmed. "The Extent of Availability of Sustainable Manufacturing Dimensions in Business Organizations." University of Mosul, Journal of Basic Education College Research, vol. 15, no. 3, 2019.
Taischa, Marco, et al. "Sustainability in Manufacturing Strategy Deployment." 12th Global Conference on Sustainable Manufacturing, College of Management, Economics and Industrial Engineering, Milan, Italy, 2015.
