
+91 6002993949
submission@iarconsortium.org
Open Access
ISSN (Print) : 2708-5139
ISSN (Online) : 2708-5147
This paper attempts to find out the factors that contribute to the success in retail sector of Bangladesh when using big data analytics in their business operations. Recently, there is a driving success in the retail sector in Bangladesh for adopting big data analytics in their operations. So, it was necessary for identifying what is/are contributing to this increasing success. To carry out the investigation, 9 constructs were developed including 1 dependent and 8 independents. The 8 independent variables “Cost saving”, “Increased revenue”, “Speedy data management”, “Future demand”, “Micro targeting customers”, “Better inventory management”, “Better pricing management” and “Product development” were expected to be driving the success in retail sector when using big data analytics (Dependent variable). For this, a survey was carried on the mid/higher level employees of organizations with a close ended questionnaire including questions related to the variables. To analyze the survey data a Statistical Software (SPSS) was used to run reliability tests, multiple regression and find out the correlations between the independent variables. 8 hypotheses were developed for individual independent variables and were accepted or rejected based on their beta standardized coefficient score. In conclusion it was seen that, four hypotheses were accepted. The independent variables “cost saving”, “increased revenue”, “speedy data management”, “future demand” were the only contributing factors that drove success in the retail sector for using big data analytics.
In recent times, the employment of analytics in the all kinds of business sectors, especially the retail sector has proven to increase success in their daily operations. This research paper aims to prove that, in addition will identify what factors are actually contributing to this roaring success in the retail sector in the country Bangladesh. Of course, the use of analytics in the business processes has its own pros and cons, but majority of the organizations feel that the introduction of analytics in their business processes has made things easier for them.
Some of the drawbacks of using big data analytics in the retail sector has risen concerns among the customers as well the retailers. Privacy concern is one of them. Customers feel that their privacy is being snatched away when retailers track their location or store their purchase information for targeting them with personalized advertisements. Although big data analytics help employees to fasten up their work, it also poses a high cost for managing such a huge amount of data. Software needed to sort and analyze these data are very expensive. On the other hand, requires skilled people to work with them. Data quality decreases because of automation of data gathering, sorting and analyzing them.
Some major advantages of using big data analytics in the retail sector of Bangladesh are it saves costs, helps in product development, speeds up data management, helps in predicting future, helps in inventory management, helps in price management, helps in micro targeting customers, etc.
Overall, the use of analytics decreases the use of man force as it automates all the processes but on the other hand. It helps in product development as analytics can carry out sentiment analysis of a lot of actual and potential customers through social media and find out their preferred types of products, developing their future products accordingly.
The use of analytics lets the retailers to predict future demands while analyzing their stocks. Micro targeting the customers can be easy when location of customers can be easily known to the retailers by the use of analytics.
Although there are many cons of adapting big data analytics in business or retail sector, but the pros are more and outweighs all the cons. This research paper aims to prove that.
Problem Statement
This research topic aims in finding out why big data analytics are driving success in the retail sector in Bangladesh. For this, some causative factors were identified and analyzed.
In total, eight of the factors “cost saving”, “increased revenue”, “speedy data management”, “future demand”, “Micro targeting customers”, “Better inventory management”, “Better pricing management” and “Product development” were the main reasons for the increasing success in the retail sector of Bangladesh for using big data analytics. And then the following research question was developed:
Q: “What are the factors contributing to the success in retail sector in Bangladesh for using big data analytics”?
Limitations Of the Study
There are limitations that are present in this research:
Some limitations were due to limited resources. Only a few organizations around Dhaka were selected for conducting the survey on their employees. So, generalizing the findings of this paper may not be accurate
Data was collected at one point of time, only once from all the respondents of the sample
The employees were from 2 levels of hierarchy only; the sample could have been more diverse if different levels of employees would be selected as respondents for this study
The generalization of findings of these papers may not be applicable around the entire country because the survey for this study was conducted only inside Dhaka
There was a time constraint while conducting this study. More predictors could be identified if there were no time limitations
Sample size was small. A bigger sample size could have given more accurate interpretations
In this part of the paper, the literature review will be previewed from existing and published sources on this topic; this will provide an insight into the existing and current situation of research that has already been done on this particular topic. The literature review will also help us find the answers to the research questions that we have generated earlier and help to pick out the weaknesses in the procedures of the experiment as well as the theoretical discordances.
The Description for ‘Big Data’
The first discussion of the literature review will consist of the definition of the big data itself. Big data includes the 3v’s, ‘volume’, ‘variety’ and ‘velocity’. Firstly, volume refers to the proportion of data that has been on an increasing growth in the use of retail businesses, broad amount of data is available to the companies of this sector and how these companies should make efficient and effective use of them for grabbing new opportunities and benefits. The proportion of big data is increasing aggressively in the retail sector.
Secondly, variety refers to the different sorts and types of data. There can be many varieties of data, including the traditional type of data such as transactional data or the new type of data from Facebook, LinkedIn, Twitter, etc. Data can be unstructured such as videos, audios, texts etc. Data can be structured such as data in a table or semi structured or even in the form of all of them altogether [1].
Finally, velocity of data means the frequency and speed of the data. Big data can be streamed, called big data streaming where large sets of data are easily and quickly processed to take out the real-time perceptions. The streaming data are analyzed and possible actions are taken from the results of the analytics; all these happen in real time [2]. These features of the data make them distinctive from typical data and these characteristics make ordinary data into big data. Big data is defined by the its features known as high volume, high velocity and high variety which requires particular technology as well as systematic methodologies to convert the information assets into ‘value’ [3]. Big data generates value in the economy which affects the society and economy in a positive manner. So, we can now derive the definition of big data as the high volumes of data with high velocity and a lot of varieties which requires specific and particular technologies and techniques to gather, store and sort out information assets. The definition of big data changes overtime. As data is growing exponentially as time goes by, the capacity for storing data is also on the increase in different industries. This makes it mandatory for the industries to adapt different and more capable data management systems such as more skilled data scientists.
IBM also referred to another V of big data in addition to the 3V’s ‘volume’, ‘velocity’ and ‘variety’ which is the ‘veracity’ of data. It means that most of the data are uncertain and unreliable. For example, the data that is collected during social media analysis or text sentiment analysis from social Medias, most of the data are unreliable and uncertain as it contains human judgments but they are also useful [4]. So, this kind of uncertain data needs advanced techniques and technologies for mining and analyzing of them. Big data definitions are not confined in these 4Vs rather it evolves for every company according to its size, location and way of doing their business.
As the size of data is on an aggressive increase as time goes by, all the companies and enterprises require more newly skilled people to capture, gather, store, analyze and interpreting the data. This is when the enterprises will need a skilled data scientist. Data scientists have a deep knowledge about mathematics and statistics and are skilled in data gathering, mining and interpreting. Therefore, the final definition of big data that we will refer to in this thesis is ‘The data with high volume, variety, velocity and veracity that requires specific technologies and skilled data scientists to be gathered, stored and analyzed for interpretation of information assets.’
Contributions Of Big Data in Retail Sector
The emerging use of technologies such as use of smart phones, social Medias and in-store adaptation of technologies for real-time solutions is providing a plethora of opportunities and benefits in the retail sector. According to Bradlow, Gangwar, Kopalle and Voleti [5], below are some of the areas/aspects where big data analytics has made substantial contributions:
Customer Oriented
The introduction of big data in the retail sector has enabled the retail sector enterprises to move from aggregate data analyzing to individual analyzing of target customers and existing customers to carry out their marketing techniques more effectively and efficiently. All the enterprises have a mission of expanding their market share by acquisition of more customers and more customer unique IDs. Big data enabled the businesses to track down the purchasing behavior of their existing customers and target customers by using social media analytics with the help of user generated content. More customer data can be used from the Customer Relationship Management System (CRM) to sync with the emails of the clients and target them in the most appropriate ways.
Product Oriented
The information gathering about a specific product becomes comparatively easy with the introduction of big data to the retailers. All the information about all the products is available to almost thousands of stocks keeping units and departments of a retail store, as big data provides access to large amount of data to almost all of the departments of a retail store. Secondly, the product information such as its features and characteristics are not bounded by size limits because big data lets the enterprises to store huge amount of data regarding a specific product. Therefore, this lets them to group categories and subcategories of the products and narrowing down the targeting of customers in a more proper way. In other words, do micro targeting.
Time Oriented
This dimension of big data multiplies the data size. Previously during the era of traditional data, retailers used to look up to weekly or monthly data for analyzing but with the emergence of big data, the retailers can now look up to continuous recording of data for analyzing customer buying patterns, inventory levels, store environments, etc. For example, if a retailer wants to know how decreasing or increasing the product pricing will affect the visitation of customers will now have a way to analyze because of the availability of the data that shows the customer’s visit to the store linked with their transactions. Hence, the retail sectors are now more inclined towards real-time solutions.
Location Oriented
Big data introduction in retail sector has enabled the retailers to carry out target advertising with the use of geospatial location targeting of the customers. This enabled to carry out delivering of the correct message to the correct consumer at the correct time. More effective and efficient marketing can be done by the retailers by target advertising specific customers based on their current physical location by tracking down their location. The customer’s geospatial location is stored in the customer relationship management database and from there retailers can also derive the customer’s purchase behaviors, enabling them to do hyper targeting the customers when they are nearby similar or their preferred products.
Channel Oriented
Nowadays, there are a number of channels through which the consumers can access, evaluate and purchase a variety of products. Customers are increasingly adapting researching before purchasing method by surfing through various websites, comparing prices, features and quality then making their purchase decisions. The retailers can benefit from this action in some ways, they can track down customers surfing and allocating their recourses like staff, money, etc. can bring them more revenue.
These are the dimensions to which retailers should be focusing onto to do their business in a more efficient way and capture a large market share.
Risks And Drawbacks of Big Data in Retail Sector
Privacy Issues
According to Tene and Polonetsky [6], the gathering of large datasets and analyzing them involves some serious privacy concerns. As information about customer’s location, their purchasing behaviors, their activities online are being studied, as a result raising concerns for the customers about losing control over their own personal data and also raising concern about discrimination of their person data by third parties. Previously during the era of traditional data, organizations used to have techniques like encoding of data, encryption and anonymization of data for preventing the linkage of customer’s personal identity with their data. But nowadays in the era of big data, it has become easy for the computer scientists to link back the data with the customer’s personal identity. This makes the people lose trust in the technique of anonymization.
The growth in the use of devices such as close circuit cameras, televisions, mobile devices has led to an increased risk for exploitation of people’s personal information although usage of these devices has provided lots of benefits. Many websites lack sufficient security of web interfaces, which lets the hackers take control of the device being used by the person with the help of cross site, SQL, etc. Websites lack encryption of information while transporting from sender to receiver and vice versa, this lets the hacker to see and read all the information being exchanged between them. Insufficient software protection causes the attacker to take control over the device being used by the user. All of these contributes to hampering of privacy [7].
Data breaches have been on the increase for the use of big data in retailing, according to information commissioner’s office. In 2014, Rebecca Minkoff partnered with ebay to do a project named ‘connected store’. This enables a large screen to welcome the customer and lets the customer browse the inventory of the store as well as select clothes for trialing. The customer can also adjust the lighting of the trial room through that screen and can also buy something he/she likes online through that screen. The retailer can later review what the customer could not purchase and then target advertise those kinds of products to that particular customer. While this kind of retail businesses are flourishing worldwide, the privacy concern regarding what kind of and how much of their customer’s personal information is being harvested is also on the rise [8].
Big data in retailing lets the automatic decision making on behalf of the customers with the help of artificial intelligence and algorithms. It takes decisions on behalf of the customers regarding their money, insurance, even what advertisements they will come across, narrowing down their choices [6].
High Cost of Big Data Management
There is a high cost of gathering, storing, analyzing and overall management of big data in retail enterprises. Organizations which are smaller try to avoid adapting big data technologies as they think they would not be able to afford it. But with the right management of resources and budgeting, costs of adapting big data technologies can be decreased.
For cleaning and analyzing the data after gathering them, requires skilled people to transform the data for the higher executives to later use them, this is another cost that the firms need to face and this cost is higher if the data volume is higher. This process also involves time cost. The companies that do not hire the skilled people and use their existing employees possess the risk of faulty analyzation of data which in turn maybe useless. To avoid this problem, firms may use cloud computing but this also possesses data security risks. Now to solve this problem, the firms might want to create infrastructure by themselves for stocking and analyzing the data but this process is also costly. Hardware costs are extremely high even if some of the firms do have cloud computing systems. Big data use requires complicated network systems to be maintained, high power of processing and manipulating the data, human resource skills for configuring software if the firms use them from free sources [9].
All these are monetary costs, time and resource costs that the firms have to incur while using big data for retailing.
Deterioration of Data Quality
When datasets are large in size because of large number of individual’s records, problems and biases arise in the design of studying the data. This also causes errors in measurement of data. For example, if a retailer is collecting data of various customers on specific attributes or behavioral patterns, in his electronic customer records. In this case, data may not be of accuracy because it is depending on what the retailer is observing, he may miss out on something during observation [10]. The variety dimension of big data that we have discussed earlier has a part in the decrease of data quality. Big data has many varieties which makes them difficult to be evaluated for quality [11].
Abdullah, Ismail, Sophiayati and Sam [12], stated that there are 4 characteristics that data should have if they are of high quality:
Accuracy: No misspellings in data and random acronyms are not present
Completeness: All the data are properly linked between the attributes and specific customers
Availability: If data are required, they should be able to be accessed easily
Timeliness: Information is updated
The two most serious issues that arises because of the poor quality of data according to Abdullah et al. [12] are:
The time required to restore the data and the lost integrity of the systems
In the absence of accurate data, the firms make decisions based on their intuition rather than data. They do not get the whole picture of what is happening in their market environment and their organization
Factors Contributing to Success of Big Data Use in Retail Sector
Independent Variables
Predicting Future Demands: Predicting customer product demands were never so easy before the adoption of big data in the retail industry. A firm can get competitive advantage in the market over their competitors by having more efficient supply chains and most of the firms attained this through a better understanding of customer needs and demands. The emergence of Information technology and data sciences in the business sector has made it possible for companies to predict customer demands sing quantitative approaches. Firms like Walmart and Kohl uses big data analytics of their sales, pricing and data of customer demographic profiles to better understand customer demands. User generated contents are helping companies to a great deal to understand customer demand better. A huge amount of data from promotional activities of marketing, reviews from e commerce sites, data that are related to products can be effectively used to predict customer demands better and help them plan the companies’ logistics better. Companies can also do social media analytics to collect chatters from there to look for certain pattern of customer behavior to predict future demands of their products [13]. Prediction of demand is more efficient in this time, retailers can now find out the demand of a particular product at any time of the year, season, etc. and adjust their inventory levels accordingly [14].
Better Micro-Targeting of Customers
Web provides kind of opportunities for big data too. For example; social network analysis such as understanding user intelligence for more targeted advertising, marketing campaigns and capacity planning, customer behavior and buying patterns also sentiment analytics. According to these inference firms optimization their content and recommendation engine [15]. One of the most important aspects of big data in the retail sector is to target customers individually with customized promotional messages according to his/her preferences. This makes advertising more effective and on the other hand, creates a good personal relationship between the customer and the retailer, stimulating repeated business. Increased knowledge about the preferences of the retailer’s customer helps them in providing the customers with more relevant recommendations for purchasing in the future which further facilitates repeat business. For example, Nordstrom uses big data analytics to send personalized advertisements to target customers according to their shopping behavior, whose information they get from their sales data from stores, websites or social media platforms [16].
Speedy Data Management
As stated by Davenport and Dyché [17], Macy’s application for pricing optimization of prices is a great example of how the total time can be reduced for large scale and complicated calculations to weeks, days or even seconds. This store has made it possible for them to do price optimization for its nearly 73 million products from 27 hours to only one single day. This also means that they could re price their products much more frequently than usual according to changes in the marketplace. Big data analytics has let the companies to conduct real time interactions with their customers with the help of data from experiences of customer. This means fast gathering, assembling, processing and analyzation of data. There are a range of software and hardware architecture of big data technologies which includes a cluster of servers, these use Hadoop or MapRoad for analyzing of memory and processing of databases, etc. All these technologies are comparatively faster than the older traditional technologies for management of data and analyzing them. To accompany these faster technologies, agile methods for analysis and machine learning techniques are adopted for gathering insights faster.
Better Inventory Management
Retailers get a lot of help in managing their inventory from big data. Many retailers sell a wide variety of products to customers and for them it is very difficult to keep track of all of them. Big data allow retailers to get up to date information about the location and size of their inventories [16]. In the planning of operations, big data business analytics has helped in management of logistics, procurement, inventories, etc. Big data analytics in supply chain of retail also provides a variety of advantages regarding the management of inventory. Organizations are increasingly using ERP systems to analyze gigantic datasets. Information on previous demand forecasting, lead times of replenishment, fixed costs for replenishment order placements, holding costs, etc. can be generated from the ERP systems. Organizations can design optimized inventory systems to handle most complicated challenges in retail inventory management. Using big data analytics in supply chain of the retail can help retailers to identify inventory needs and be more responsive to changes in customer demands. It also allows reducing inventory costs dramatically. Clickstream data, also another important kind of big data generates information that can reduce the backordering and holding cost of inventory of a frim from 3 percent to 5 percent [18].
Better Price Management
Most retailers realize that use of technology has been increasingly important for retailers to fix prices. According to Liu [19], using big data analytics technology, the company can find out the customer’s willingness to pay range, it is the amount of money a customer is willing to pay for a certain product or service. When the companies can offer fairer price than their customers, they can easily attain a competitive advantage over their competitors in the marketplace. Big data analytics lets firms carry out dynamic pricing to their products. Dynamic pricing enables firms to achieve an adjustable strategy of pricing their items according to the dynamic customer tastes and preferences [20]. Some of the potentialities of big data in retail sector includes: behavior analysis of customers in the store, variety and optimization of price, placement of products, performance improvement, optimization of labor, logistics and distribution, markets that are web based [15]. Big data helps the retailers to identify the habits of their customers to set the prices of their products s profit maximizing [16].
Increases revenue
The most eventual challenge of big data analytics incorporated inside organizations is to create value for the firm.). In other words, providing valuable and economic insights from data extraction and analyzing. With the use of big data analytics, organizations can generate their business value by increasing their sales (revenue), meeting their customer needs, developing their products and services, etc. Amazon, the big online retailer could increase their sales by 50% after incorporating big data analytics in their business. Grocery chain, Automercados was able to incline their sales by 30% by adaptation of information integration. Big data analytics in e-retail sector enables personalization and customization of products according to customer needs, this can increase sales by 10% and increase ROI by 5 to 8 times on marketing expenses. Bikeberry.com is an example of this [21].
Cost Saving
Big data analytics can be used to improve transaction efficiency, efficiency of a firm’s processes, time and cost efficiency. Big data analytics in online retails (e-commerce) aims to attain cost savings, efficient processes, etc. by transformation of inventory management, innovation of products, human resources, etc. Firms can get cost effective processing and storage capacities and advance analytical tools, all of which makes it possible for firms to decrease costs and create benefits pretty easily [21]. Hadoop is a framework for storing huge amount of data on distributed clusters. In Hadoop cluster, one-year storage cost for one terabyte is $2,000. That is 800 times less than the traditional relational databases [22].
Figure 1: Conceptual Framework
Product Development
Big data analytics use in the e commerce sector has led the firms to provide customized and personalized products to the customers which include special content and advertisings. They can distinguish between their loyal/repeated customers and new customers by this [21]. According to Tan, Zhan, Ji, Ye and Chang [23], big data analytics significantly provides opportunities for innovation of products according to customer’s preferences. Use of analytics of big data, managers can create models’ decisions about product development which helps to encourage innovation capabilities. Firms are including customer sentiments from analysis of big data into product development. This makes them deviated from a product focused innovation to customer experience focused innovations of products [24]. The analysis of big data further provides opportunities to speed up the product development, allows designers to get insights based on solid customer inputs and designs that lowers down the production costs and gather customer insights to decrease the product development costs from innovations [25]. The velocity of big data ensures new product development a lot faster and in lower costs by gathering customer’s feedback and tracking their behavior in real time then reporting it to the RandD team to ensure that the new product launched will suit their preferences [26].
Dependent Variable
Big Data Analytics Driving Retail Success: Big data makes it possible for retail clients to get a better understanding of information related to their stock management, customer relationship management, electronic mails, data from various transactions, etc. Companies can optimize pricing for their products, can track current/new trends in the market and manage their multiple distribution channels to make their distribution sales more effective. Retailers with the help of big data analytics can create customer unique IDs and profiles according to their buying history, interactions on social medias, etc. and create segments of customers. Then they can target them with tailored products based on their tastes or what people who are similar to them are purchasing. Dynamic pricing occurs online in the retail sector which depends on the stock, demand in the market, pricing of the competitors’ products, etc. Data analytics can greatly help in optimizing the price through the use of algorithms. Analytics of big data also lets the companies predict demand in the market by tracking changing trends in the marketplace or industry. They can use data from social media to do sentiment analysis of the customers. Once the company can track the trends and demand, they know which segments to focus on and managing of their inventory level becomes easier [14] (Figure 1).
In this part of the paper, the methodology of the research paper is discussed. It outlines the research design, sample selection, how the research data was collected and how all the data were analyzed.
Research Question
“What are the factors contributing to the success in retail sector in Bangladesh for using big data analytics”?
Research Setting
I have conducted the research through distribution of the questionnaire in person to some of the individuals in the sample and some other individuals were sent the questionnaire through social networking sites to fill it up.
Research Design/Methodological Approach
The intention of this paper is to find out the reasons that are contributing to the success of use of big data analytics in the retail sector of Bangladesh. A s this is a quantitative study, initially a research question was developed and some factors that might contribute to the success were considered, then a closed ended questionnaire was developed to survey the officials or top/mid-level managers of the retail companies using big data analytics in their day-to-day operations. Quantitative data was collected following the survey and the data were analyzed using the statistical software SPSS to find out the degree of relationship between the independent variables and dependent variable.
Sample
The population which is chosen for the research paper is all of the employees working in the retail sector of Bangladesh. From the population, 25 individuals were sampled from different retail organizations by the simple random sampling method. So, in this research paper n=25. The findings from the sample will be used to generalize conclusions to the entire population.
Questionnaire Development
The questions were made to find out the respondent’s idea, thoughts, experiences and attitude towards the research’s subject. Firstly, from the dependent and independent variables and the hypothesis created from them was carefully reviewed. Focus was put on the research question and the main information that was needed from the sample. All the questions were closed ended but self-explanatory that contained all the needed information so that all the respondents can understand and answer them appropriately. All the questions were Likert scale with ranges from which respondents had to choose:
Strongly disagree
4-Disagree
3-Neutral
2-Agree
1-Strongly agree
Some of the questions developed are listed below:
Big data helped me predict the demands of my products and services for the next week/month/year
From big data I could know better what my customers want by observing the records of their buying pattern
Big data helped me manage thousands of customer’s data in a small amount of time
Algorithms automatically analyse my inventory levels very quickly
(The whole questionnaire is attached in the Appendix)
Data Collection
Questionnaire was distributed individually to the sample respondents so the data collection was a primary data collection method. Data were collected in quantitative form because the questions were closed ended and Likert scale questions and respondents could answer by choosing any of the options available ranging from strongly agrees to strongly disagree. Survey data was collected from 25 mid and higher-level employees of retail organizations.
Data Analysis
Data collected from the respondents were analyzed by predictive modeling to find the relationship between the dependent variable and the independent variable. Using Spss, multiple regression was conducted on the data to find the best fit line. The value of the R square was used to interpret the strength of the relationship between the independent and dependent variables. Multiple regression helps us to find the degree to which the independent variables are influencing the dependent (target) variable.
Table 1: Reliability Alpha Coefficient of Reliability Summary Table
Variable’s Type | Variables | Cronbach’s Alpha |
Independent | Future demand prediction | 0.809 |
Independent | Micro targeting customers | 0.835 |
Independent | Speedy data management | 0.843 |
Independent | Better inventory management | 0.827 |
Independent | Better price management | 0.816 |
Independent | Increases revenue | 0.796 |
Independent | Cost saving | 0.735 |
Independent | Product development | 0.791 |
Dependent | Big data analytics driving retail success. | 0.849 |
Reliability Statistics
The concept of alpha is that it is used to evaluate assessments and questionnaires. The index of alpha is widely used for test reliability. A very low value of alpha represents a low consistency between items whereas a very high index represents redundancy of the items [27]. Alpha values of .70 or above are considered desirable and are accepted [28] (Table 1).
Interpretation of Cronbach’s Alpha
Future Demand Prediction: The Cronbach’s alpha for the independent value “Future demand prediction” has a value of .809. This value proves that there is a good internal consistency between the items. All the values of the “Cronbach’s alpha If item deleted” was below the overall Cronbach’s alpha value. From these data we can conclude that the degree of internal consistency between the items is good and the independent variable “Future demand prediction”. therefore, has successfully passed the reliability test.
Micro-Targeting Customers
The Cronbach’s alpha for the independent value “Micro-targeting customers” has a value of .835. This value proves that there is a good internal consistency between the items. All the values of the “Cronbach’s alpha If item deleted” was below the overall Cronbach’s alpha value. From these data we can conclude that the degree of internal consistency between the items is good and the independent variable “Micro-Targeting customers” therefore, has successfully passed the reliability test (Table 2).
Speedy Data Management
The Cronbach’s alpha for the independent value “Speedy data management” has a value of 0.848. This value shows a good internal consistency between the items. All the values of the “Cronbach’s alpha if item deleted” was lower than the overall Cronbach’s alpha value. From these data we can sum up that there is a good degree of internal consistency between the items. Therefore, the independent variable “Speedy data management” therefore, has successfully passed the reliability test (Table 3).
Better Inventory Management
The Cronbach’s alpha for the independent value “Better inventory management” has a value of 0.827. This value shows a good internal consistency between the items. All the values of the “Cronbach’s alpha if item deleted” was lower than the overall Cronbach’s alpha value. From these data we can sum up that there is a good degree of internal consistency between the items. Therefore, the independent variable “Better inventory management” therefore, has successfully passed the reliability test (Table 4).
Better Price Management
The Cronbach’s alpha index for the independent value “Better price management” has a value of 0.816. This value shows an internal consistency of good standard between the items. All the values of the “Cronbach’s alpha if item deleted” was below than that of the overall Cronbach’s alpha value. From these data we can say that there is good internal consistency between the items. Therefore, the independent variable “Better price management” therefore, has successfully passed the reliability test (Table 5).
Table 2: Cronbach’s Alpha For ‘Micro-Targeting Customers
| Cronbach’s Alpha | N of items |
| 0.835 | 5 |
Table 3: Cronbach’s Alpha For ‘Speedy Data Management’
| Cronbach’s Alpha | N of items |
| 0.809 | 5 |
| 0.848 | 5 |
Table 4: Cronbach’s Alpha For ‘Better Inventory Management
| Cronbach’s Alpha | N of items |
| 0.827 | 5 |
Table 5: Cronbach’s Alpha For ‘Better Price Management’
| Cronbach’s Alpha | N of items |
| 0.816 | 5 |
Table 6: Correlation

Figure 2: Normal Probability Plot

Figure 3: Scatter Plot
Testing for Homoscedasticity, Linearity and Normality
Normality
The normality of the residuals is checked from the normal probability plot. Here, most of the data are generally following the normal line (diagonal) and therefore it is not violating any linearity or normality parameters. The residuals therefore, have no deviations of high strength and are normally distributed (Figure 2).
Linearity
We check for the linear relationship among our independent variables and dependent variables with the use of the scatter plot. In the scatter plot below, it shows that most of the independent variables share a linear relationship with the dependent variables. Mostly the data are falling towards the 0 of both the X and Y axis. Exceptions are here as there are outliers present (Figure 3).
Histogram
The histogram shows that most of the variables are normally distributed (Figure 4).
Correlations
The correlations table shows the inter relationship between the independent variables. It also tells us about the directional relationship and strength between the dependent and independent variables.
Firstly, from these data we can conclude that no collinearity is present between the independent variables as all the p-values between the independent variables are less than 0.60. This means that there is a good internal consistency among the variables and no violations of assumptions occurred.
Secondly, almost all of the interdependent variables have 0.30 to 0.60 values which shows positive and medium or large strength of relationships.
Finally, dependent variable (big data success in retail) has a positive correlation with most of the independent variables. With big data success in retail, future demand has a correlation of 0.289, which has a positive relationship. With big data success in retail, speedy data management has a positive correlation of 0.371. With big data success in retail, cost saving has a positive correlation of 0.530 and with increased revenue it has a positive correlation of 0.546, both of which has a high level of strength.
So, most of the independent variables has a medium to large strength of correlation with the dependent variable with a very good level of significance (Table 6).
Regression
For the study that is being conducted, regression analysis plays an important role. It is a combination of techniques to find out the inter-relationship between the dependent and the independent variables.
In this part, it investigates the research question “What are the factors contributing to the success in retail sector in Bangladesh for using big data analytics”?
Table 7: Model Summary
Table 8: ANOVA Model
| ANOVA | ||||||
| Model | Sum of Squares | df | Mean Square | F | Sig. | |
1
| Regression | 10.660 | 8 | 1.333 | 4.673 | 0.004b |
Residual | 4.562 | 16 | 0.285 | |||
Total | 15.222 | 24 | ||||
a. Dependent Variable: BIG_Data_Success_retail_BD_AVG, b. Predictors: (Constant), Increased_Revenue_AVG, Better_Pricing_MGT_AVG, Product_Dev_AVG, Future_DEMAND_AVG, Micro_Targeting_Customer_AVG, Better_INV_MGT_AVG, Speedy_Data_MGT_AVG, Cost_Saving_AVG
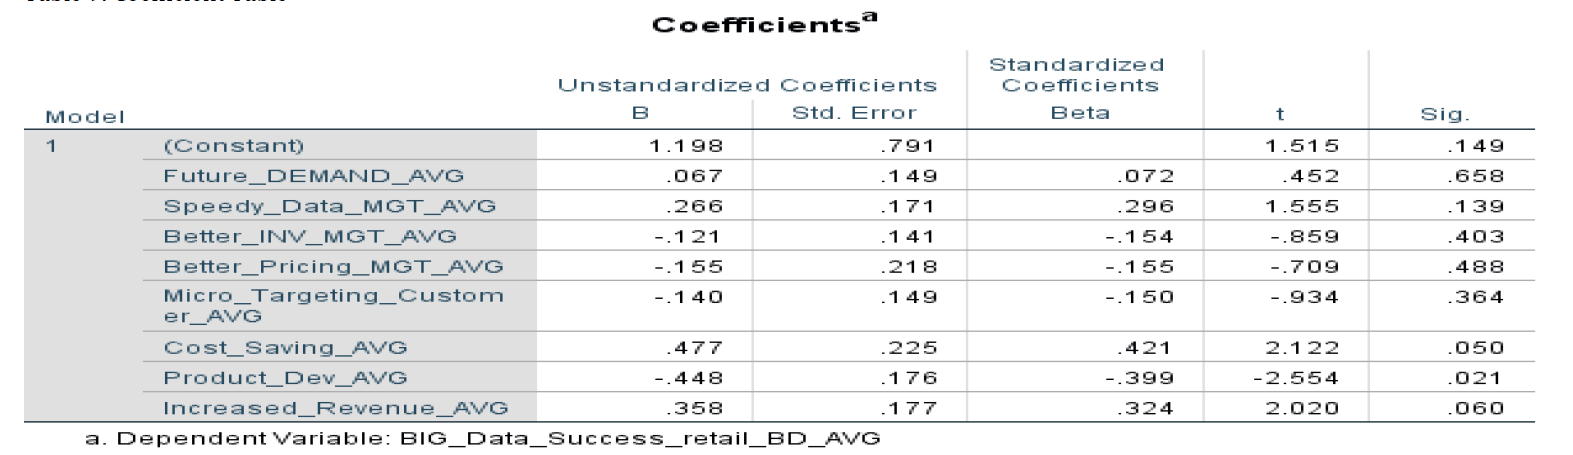
Table 9: Coefficient Table

Figure 4: Histogram
There are various types of regression, 3 to be more specific but the most useful and common one is the standard regression. This type of regression groups all the independent variables (predictors) and the regression is run against the dependent variable. With the help of this method, we can find out and explain the degree of variance in the dependent variable caused by the independent variables.
Model Summary
Evaluation: The value of r square is 0.70, this is shown in the model summary table. From this value of the r square we can conclude that 70% (0.70 x 100) of the variance in the dependent variable, which is “Big data analytics driving retail success” can be explained by the 8 other independent variables. This is a very significant value for this study. The r square adjusted value is 0.55 which is pretty much close to that of the actual r square value, representing the true population (Table 7).
Anova Table
The Anova tables describes the total statistical difference. In this Anova table below, it can be seen that the significance is 0.004. This is the p-value from which it can be interpreted that there is a significant difference between the dependent variable (big data success in retail sector in Bangladesh) and the independent variables (Table 8).
Evaluating The Independent Variables
From the below coefficient table, the most crucial column to look at is the standardized coefficients beta. This is the beta value for all the independent variables, the factors contributing to the success for using big data analytics in the retail sector of Bangladesh.
In this table, four of the independent variables are showing a positive relationship with the dependent variable. The other four independent variables have a negative relationship with the dependent variable.
The results are as follows:
Cost saving = 0.421
Increased revenue = 0.324
Speedy data management = 0.296
Future demand score = 0.072
Micro targeting customers = -0.150
Better inventory management = -0.154
Better pricing management = -0.155
Product development = -0.399
From these data it can be interpreted that the independent variable that made the largest contribution to the positive relationship with the dependent variable was “cost saving”, “increased revenue”, “speedy data management” and “future demand”, respectively.
The other four independent variables “Micro targeting customers”, “Better inventory management”, “Better pricing management” and “Product development” has a negative and insignificant relationship with the dependent variable (Table 9).
Hypothesis Testing
The main objective of this study was to prove that the predictors (independent variables) contribute to the dependent variable or the outcome variable. Some studies on this matter have proved the same that these factors “cost saving”, “increased revenue”, “speedy data management”, “future demand”, “Micro targeting customers”, “Better inventory management”, “Better pricing management” and “Product development” has a contributing effect on the success in retail sector for using big data analytics’ around the globe.
Now that the contributing factors are identified from the literature review, proceeding to prove all the 8 hypothesis is necessary. 8 hypotheses were generated and proved, which the central objective of this study was:
H1: The factor “cost saving” has a positive and significant relationship with the success in retail sector for using big data analytics
This hypothesis is accepted. The beta standardized coefficient of this independent variable has a score of 0.421. It has a positive relationship with the dependent variable. The strength of the relationship is also quite significant and of medium to large strength. The significance value, which is the p value is 0.050. This value is very close to 0 and it means that with 95% confidence level it can be stated that the hypothesis is right and accepted. Thus, the relationship between the independent variable “Cost saving” and the dependent variable “success in retail sector for using big data analytics” is positive and significant.
H2: The factor “increased revenue” has a positive and significant relationship with the success in retail sector for using big data analytics.
This hypothesis is accepted. The beta standardized coefficient of this independent variable has a score of 0.324. It has a positive relationship with the dependent variable. The strength of the relationship is also quite significant and of medium to large strength. The significance value is 0.060. This value is close to 0 and it means that with 94 percent confidence level it can be stated that this hypothesis is correct and accepted. Thus, the relationship between the independent variable “Speedy data management” and the dependent variable “success in retail sector for using big data analytics” is positive and significant.
H3: The factor “Speedy data management” has a positive and significant relationship with the success in retail sector for using big data analytics:
This hypothesis is accepted. The beta standardized coefficient of this independent variable has a score of 0.296. It has a positive relationship with the dependent variable. The strength of the relationship is low to in strength. The significance value, which is the p-value is 0.139. This value is very close to 0 and it means that with 86% confidence level it can be stated that the hypothesis is right and accepted. Thus, the relationship between the independent variable “Speedy data management” and the dependent variable “success in retail sector for using big data analytics” is positive and significant.
H4: The factor “Future demand” has a positive and significant relationship with the success in retail sector for using big data analytics:
This hypothesis is accepted. The beta standardized coefficient of this independent variable has a score of 0.072. It has a positive relationship with the dependent variable. The strength of the relationship is low in strength. The significance value, which is the p-value is 0.658. This value means that with 34% confidence level it can be stated that the hypothesis is right and accepted. Thus, the relationship between the independent variable “Future demand” and the dependent variable “success in retail sector for using big data analytics” is positive and significant.
H5: The factor “Micro targeting customers” has a positive and significant relationship with the success in retail sector for using big data analytics:
This hypothesis is rejected. The beta standardized coefficient of this independent variable has a score of -0.150. It has a negative relationship with the dependent variable. The strength of the relationship is very low to in strength. The significance value, which is the p-value is 0.364. This means that with 63.6% confidence level it can be stated that the hypothesis is not correct and rejected. Thus, the relationship between the independent variable “Micro targeting customers” and the dependent variable “success in retail sector for using big data analytics” is negative and insignificant.
H6: The factor “Better inventory management” has a positive and significant relationship with the success in retail sector for using big data analytics:
This hypothesis is rejected. The beta standardized coefficient of this independent variable has a score of -0.154. It has a negative relationship with the dependent variable. The strength of the relationship is very low to in strength. The significance value, which is the p-value is .403. This means that with 60 percent confidence level it can be stated that the hypothesis is not correct and rejected. Thus, the relationship between the independent variable “Better inventory management” and the dependent variable “success in retail sector for using big data analytics” is negative and insignificant.
H7: The factor “Better pricing management” has a positive and significant relationship with the success in retail sector for using big data analytics:
This hypothesis is rejected. The beta standardized coefficient of this independent variable has a score of -0.155. It has a negative relationship with the dependent variable. The strength of the relationship is very low to in strength. The significance value, which is the p-value is 0.488. This means that with 51% confidence level it can be stated that the hypothesis is not correct and rejected. Therefore, the relationship between the independent variable “Better pricing management” and the dependent variable “success in retail sector for using big data analytics” is negative and insignificant.
H8: The factor “Product development” has a positive and significant relationship with the success in retail sector for using big data analytics:
This hypothesis is rejected. The beta standardized coefficient of this independent variable has a score of -0.399. It has a negative relationship with the dependent variable. The strength of the relationship is very low to in strength. The significance value, which is the p-value is 0.021. This means that even with a confidence level of 98% it can be stated that the hypothesis is not correct and rejected. Thus, the relationship between the independent variable “Product development” and the dependent variable “success in retail sector for using big data analytics” is negative and insignificant.
Hypothesis Testing Summary
In this study, the H1, H2, H3 and H4 are accepted as they have a positive standardized coefficient value but on the other hand H5, H6, H7 and H8 are rejected as their standardized coefficient score was negative, showing negative relationship between the independent variables and the dependent variable.
This research topic was arisen out of an interest in finding out why big data analytics are driving success in the retail sector in Bangladesh. For this, some causative factors were identified and analyzed.
It was expected that eight of the factors “cost saving”, “increased revenue”, “speedy data management”, “future demand”, “Micro targeting customers”, “Better inventory management”, “Better pricing management” and “Product development” were the main reasons for the increasing success in the retail sector of Bangladesh for using big data analytics. As it was expected that organizations could predict future demands better, they could micro target their customers, manage their inventory better, do their pricing in a better way and develop their products with the help of using analytics on big data.
However, after analyzing the survey data, which were taken from middle and higher-level officials of various organizations, it was proved that four of the predictors actually contributed to the driving success in the retail sector for using big data analytics. The independent variables “cost saving”, “increased revenue”, “speedy data management”, “future demand” were the most contributing factors that drove success in the retail sector for using big data analytics.
In conclusion, the answer to the research question is identified. “What are the factors contributing to the success in retail sector in Bangladesh for using big data analytics”? It can be stated that for using big data analytics, organizations could save costs, increase their revenue, speed up their data management and develop their products, thus driving success in the retail sector of Bangladesh.
Suggestions For Future Research and Recommendation
Although the research was conducted thoroughly, some limitations were present. The major limitation was the time factor. More time needs to be taken for identifying some more causative factors for the increasing success in the retail sector for using big data analytics.
The sample size in this study was n = 25. As only the mid and high-level officials were included in the sample size, increasing the sample size was not possible. So further research can be done using a broader sample size, including more organizational officials.
The conceptual framework could be expanded by adding more variables/constructs that contributes to the growing success in the retail sector for using big data analytics. As discussed in the literature review, big data analytics saves organizations a lot of time.
This study could be conducted on a different location instead of Bangladesh in different organizations in retail sector so that the results could be generalized across all the retail sector organizations.
T.H. Davenport et al. How "Big Data" Is Different. MIT Sloan Management Review, 2012.
Russom, P. “Big data analytics”. TDWI Best Practices Report, vol. 19, no. 4, 2011, pp. 1–34.
A. De Mauro “A formal definition of big data based on its essential features”. Library Review, vol. 65, no. 3, 2016, pp. 122–135. https://doi.org/10.1108/LR-06-2015-0061.
A. Gandomi et al. “Beyond the hype: Big data concepts, methods and analytics”. International Journal of Information Management, vol. 35, no. 2, 2015, pp. 137–144. https://doi.org/10.1016/j.ijinfomgt.2014.10.007.
E.T. Bradlow et al. “The role of big data and predictive analytics in retailing”. Journal of Retailing, vol. 93, no. 1, 2017, pp. 79–95.
O. Ten et al. “Big data for all: Privacy and user control in the age of analytics”.Northwestern Journal of Technology and Intellectual Property, vol. 11, 2012, p. xxvii.
B. Shaqiri. Exploring Techniques of Improving Security and Privacy in Big Data, 2017.
A. Farshidi “The new retail experience and its unaddressed privacy concerns: How RFID and mobile location analytics are collecting customer information”. Case Western Reserve Journal of Law, Technology and the Internet, vol. 7, 2016, p. 15.
A.A. Tole. “Big Data Challenges”. Database Systems Journal, vol. 4, no. 3, 2013, pp. 31–40.
D.R. Cox et al. “Big Data: Some Statistical Issues”. Statistics and Probability Letters, vol. 136, 2018, pp. 111–115. https://doi.org/10.1016/j.spl.2018.02.015.
I. Taleb et al. Big Data Quality: A Survey, 2018.
N. Abdullah et al. “Data quality in big data: A review”. International Journal of Advances in Soft Computing and Its Applications, vol. 7, no. 3, 2015.
A.Y.L. Chong et al. “Predicting consumer product demands via big data: The roles of online promotional marketing and online reviews”. International Journal of Production Research, vol. 55, no. 17, 2017, pp. 5142–5156.
S. Chandramana “Retail analytics: Driving success in retail industry with business analytics”. vol. 7, 2017.
D. Rajasekar et al. “A survey on big data concepts and tools”. International Journal of Emerging Technology and Advanced Engineering, vol. 5, no. 2, 2015, pp. 80–81.
A. Anderson et al. “Statistics for big data for dummies”. Hoboken, New Jersey: John Wiley and Sons, Inc., 2015.
T.H. Davenport et al. “Big data in big companies”. International Institute for Analytics, no. 3, 2013.
T. Huang et al. “Clickstream data and inventory management: Model and empirical analysis”. Production and Operations Management, vol. 23, no. 3, 2014, pp. 333–347.
P. Liu “Pricing strategies of a three-stage supply chain: New research in the big data era”. Discrete Dynamics in Nature and Society, 2017.
S. Erevelles et al. “Big data consumer analytics and the transformation of marketing”. Journal of Business Research, vol. 69, no. 2, 2016, pp. 897–904.
S. Akter et al. “Big data analytics in e-commerce: A systematic review and agenda for future research”. Electronic Markets, vol. 26, no. 2, 2016, pp. 173–194.
J.R. Alam et al. “A Review on the role of big data in business”. International Journal of Computer Science and Mobile Computing, vol. 3, no. 4, 2014, pp. 446–453.
K.H. Tan et al. “Harvesting big data to enhance supply chain innovation capabilities: An analytic infrastructure based on deduction graph”. International Journal of Production Economics, vol. 165, 2015, pp. 223–233.
Y. Zhan et al. “Unlocking the power of big data in new product development”. Annals of Operations Research, vol. 270, no. 1–2, 2018, pp. 577–595.
B. Nedelcu “About big data and its challenges and benefits in manufacturing”. Database Systems Journal, vol. 4, no. 3, 2013, pp. 10–19.
Y. Zhan et al. “A big data framework for facilitating product innovation processes”. Business Process Management Journal, vol. 23, no. 3, 2017, pp. 518–536.
M. Tavakol et al. “Making sense of Cronbach’s alpha”. International Journal of Medical Education, vol. 2, 2011, pp. 53.
K.S. Taber “The use of Cronbach’s alpha when developing and reporting research instruments in science education”. Research in Science Education, vol. 48, no. 6, 2018, pp. 1273–1296. https://doi.org/10.1007/s11165-016-9602-2.
